Thursday, April 17, 2014 (Weekly Commentary)
Rally Alert. Initial Buy Signal.
This short week was significant because the weakness we saw for the past few weeks in NASDAQ and the small caps may have finally come to an end. On both the weekly and the daily charts of IWM and QQQ we can see hammer candlesticks forming. These are signs of support.
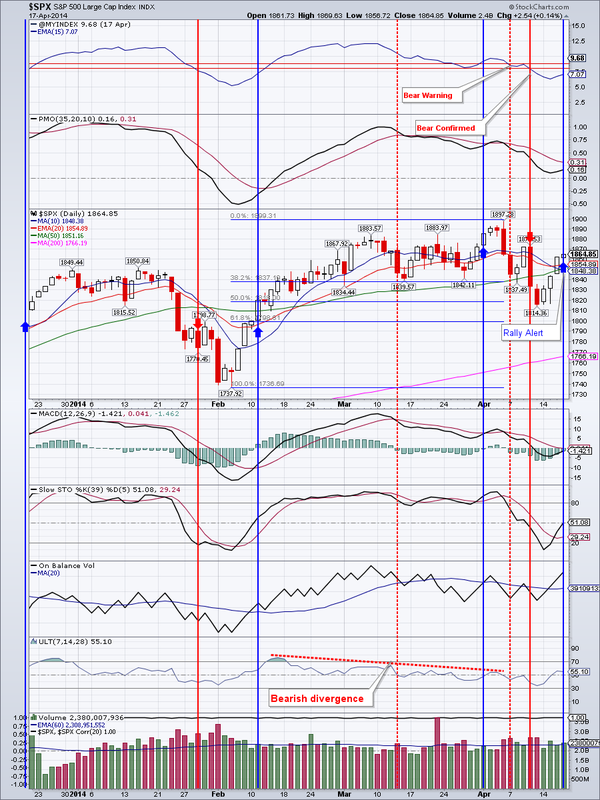
Most significantly however, market breadth is signaling a return to the bullish phase of the general market. We have received our initial buy signal on Thursday and opened very small positions in DIA and TNA to play this potential rebound. (We also covered our short by selling SPXU). Whether this is a rally into resistance or something that would take the markets to new highs remains to be seen. Next week will be crucial to see if this rally holds. Should market breadth continue to improve, we will add to our long positions.
TLT seems to have run into resistance and printed a shooting star on the weekly chart. On the daily chart of TLT a Bearish Engulfing pattern took shape. This needs a confirmation on Monday. Confirmation could come in a form of a close below $109.70, or perhaps a gap down. We took profits in TLT.
A Bearish engulfing pattern also unfolded on the weekly gold chart. Gold looks precarious. Any further weakness, say a close below $1277.40, would surely cause a retest of December lows at $1186. There is some support around $1240.
GDX in my opinion looks even worse then gold. It also printed a Bearish engulfing, but closed at the week's lows. A close below $23.27 could cause a retest of December lows that are 15% away. We have a small DUST position open and would add should GDX close below $23.27.
IYR had a great week and gained 1.76%. It managed to break out and close above March 3 high. Further upside is likely. I believe we are headed up to test the May 2013 highs at $73.26.
As I mentioned before, EEM may have already made a "throwback". It was an extremely shallow one so far, not even 38% Fibonacci retracement. It's still possible that it would come back to retest $39-40 area, but should it close above $42.47, it might just take off to the upside.
Oil had a good week and gained 1.2%. It has run into resistance at $105, but I believe it will power through it and continue higher.
Natural gas had a great day on Friday by gaining almost 4.5%, on good volume and closing above the 50 day moving average! It looks like gas has put in a bottom and is headed higher. There is potential for significant upside. We will be revisiting the UGAZ trade shortly.
Open positions: IYR, TLT (took profits), EEM, DUST, DIA (new small position), TNA (new small position)
Hedging positions: SPXU (closed)
Bottom line: General markets may have flipped back into a bullish mode
Rally Alert. Initial Buy Signal.
This short week was significant because the weakness we saw for the past few weeks in NASDAQ and the small caps may have finally come to an end. On both the weekly and the daily charts of IWM and QQQ we can see hammer candlesticks forming. These are signs of support.
Most significantly however, market breadth is signaling a return to the bullish phase of the general market. We have received our initial buy signal on Thursday and opened very small positions in DIA and TNA to play this potential rebound. (We also covered our short by selling SPXU). Whether this is a rally into resistance or something that would take the markets to new highs remains to be seen. Next week will be crucial to see if this rally holds. Should market breadth continue to improve, we will add to our long positions.
TLT seems to have run into resistance and printed a shooting star on the weekly chart. On the daily chart of TLT a Bearish Engulfing pattern took shape. This needs a confirmation on Monday. Confirmation could come in a form of a close below $109.70, or perhaps a gap down. We took profits in TLT.
A Bearish engulfing pattern also unfolded on the weekly gold chart. Gold looks precarious. Any further weakness, say a close below $1277.40, would surely cause a retest of December lows at $1186. There is some support around $1240.
GDX in my opinion looks even worse then gold. It also printed a Bearish engulfing, but closed at the week's lows. A close below $23.27 could cause a retest of December lows that are 15% away. We have a small DUST position open and would add should GDX close below $23.27.
IYR had a great week and gained 1.76%. It managed to break out and close above March 3 high. Further upside is likely. I believe we are headed up to test the May 2013 highs at $73.26.
As I mentioned before, EEM may have already made a "throwback". It was an extremely shallow one so far, not even 38% Fibonacci retracement. It's still possible that it would come back to retest $39-40 area, but should it close above $42.47, it might just take off to the upside.
Oil had a good week and gained 1.2%. It has run into resistance at $105, but I believe it will power through it and continue higher.
Natural gas had a great day on Friday by gaining almost 4.5%, on good volume and closing above the 50 day moving average! It looks like gas has put in a bottom and is headed higher. There is potential for significant upside. We will be revisiting the UGAZ trade shortly.
Open positions: IYR, TLT (took profits), EEM, DUST, DIA (new small position), TNA (new small position)
Hedging positions: SPXU (closed)
Bottom line: General markets may have flipped back into a bullish mode


 RSS Feed