|
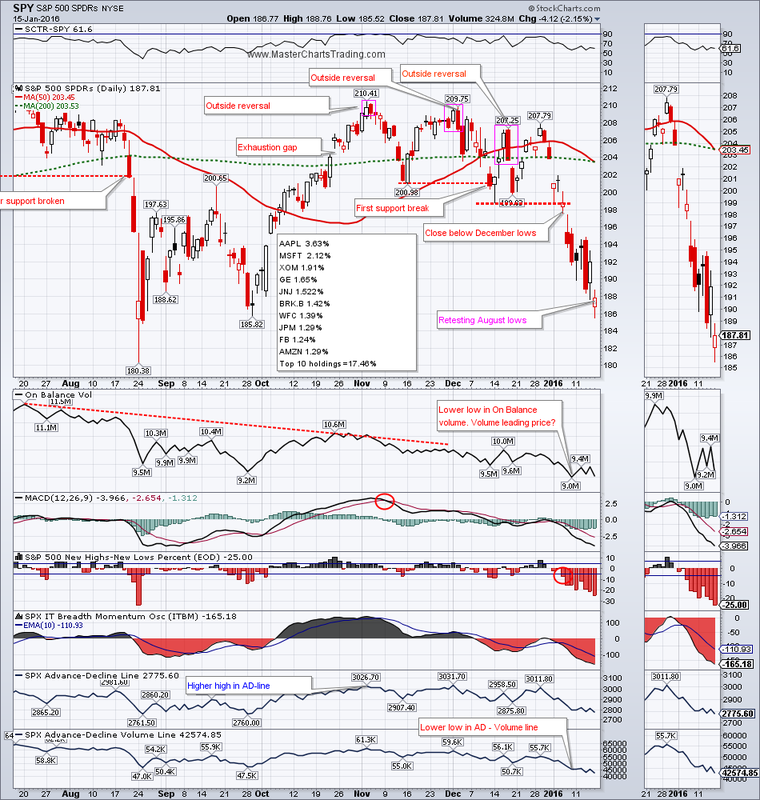
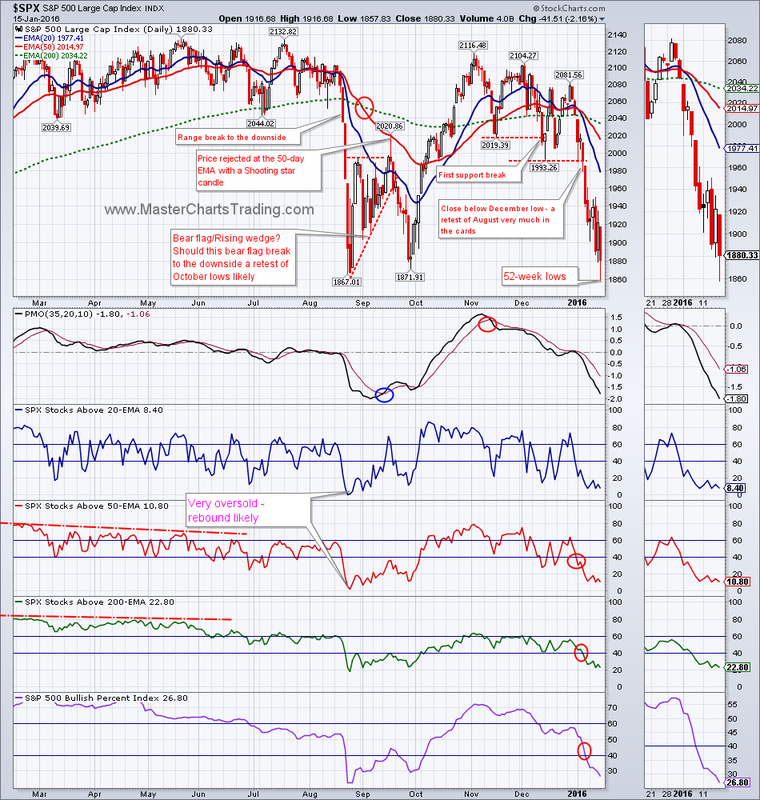
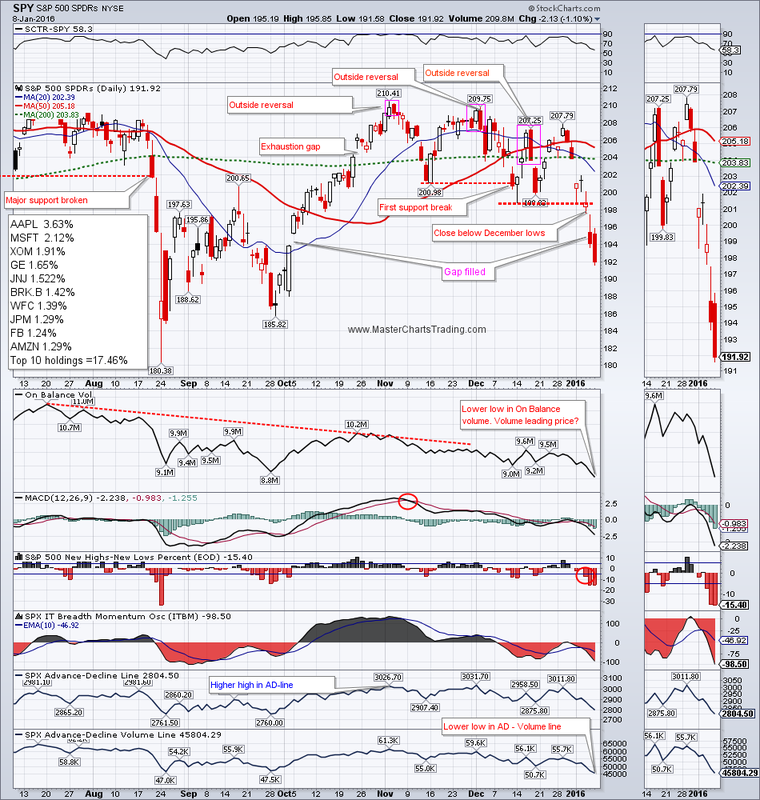
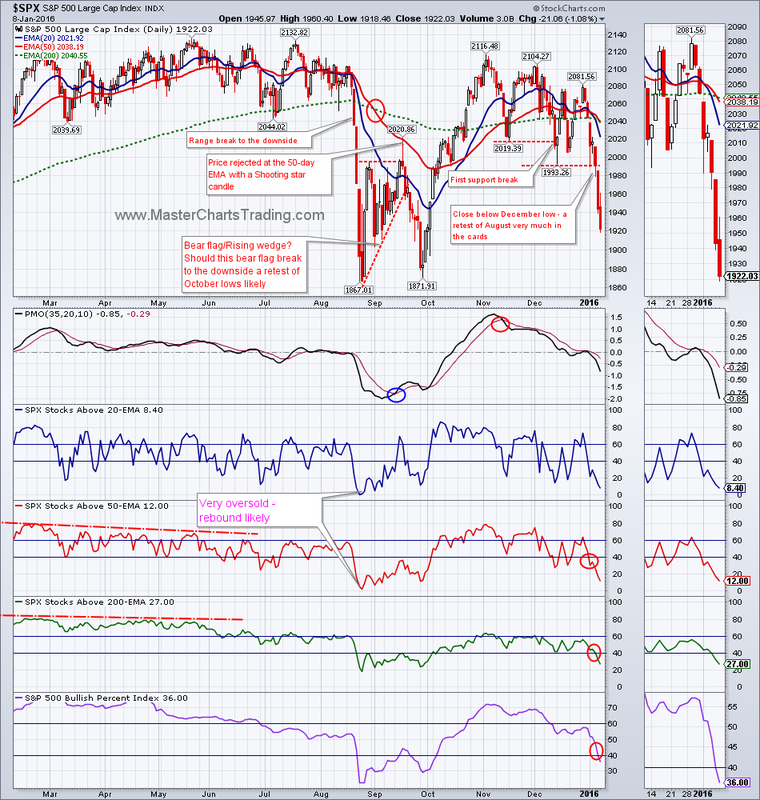
Another one of those weeks that bulls would like to put behind them. Stocks (SPY) dropped an additional 2.14% today to close the week at $187.81. We are rapidly approaching August lows. A drop below them could spark a stampede out of stocks as investors panic at 52-week lows. $SPX has already made an intraday 52-week low on Friday. The index is somewhat oversold after a 10+% move from the December 29th highs. So far two attempts by the bulls to halt the slide fall flat, and bears are still in control.
CHART OF SPY CHART OF $SPX |
|
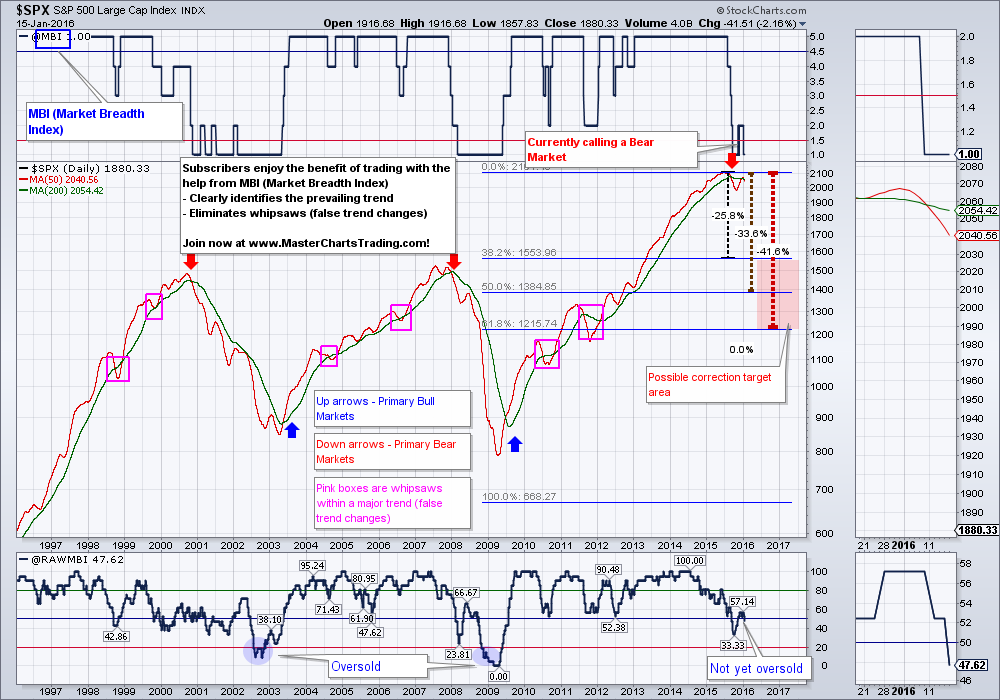
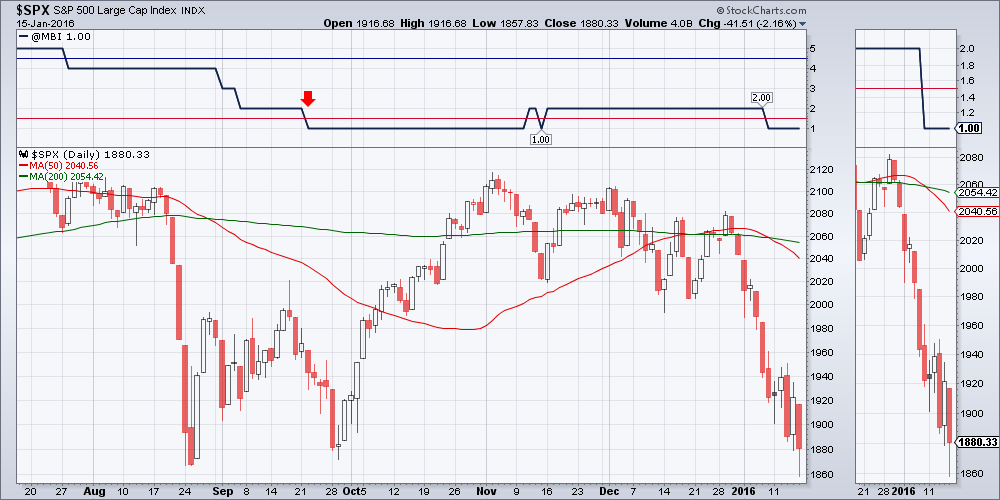
Next chart shows my custom Market Breadth Index (MBI) and the raw input for it (RAWMBI). I have described this very useful tool in the past here. The important takeaways from this chart are as follows:
- Stocks are currently in a bear market. A bear market is characterized by a series of lower lows, lower highs and failed rallies.
- At this time $SPX is about 11% off the all-time highs, but it could easily correct by an additional 15-35%. This is based on the Fibonacci retracements from the 2009 lows to the recent all-time highs.
- The bottoming patterns during the previous bear markets showed up in the RAWMBI readings as “oversold”. Right now RAWMBI is not even close to being oversold.
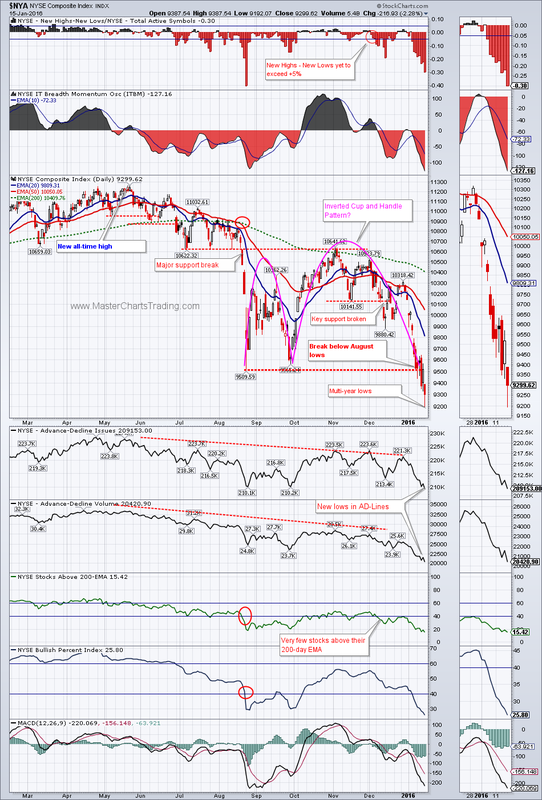
NYSE Composite index ($NYA) closed below the August 2015 lows and hit a multi-year low on Friday. The current chart of $NYA may be sporting an inverted Cup and Handle pattern. If this pattern plays out we could easily correct by around 10% more from today’s prices.
CHART OF $NYA
CHART OF $NYA
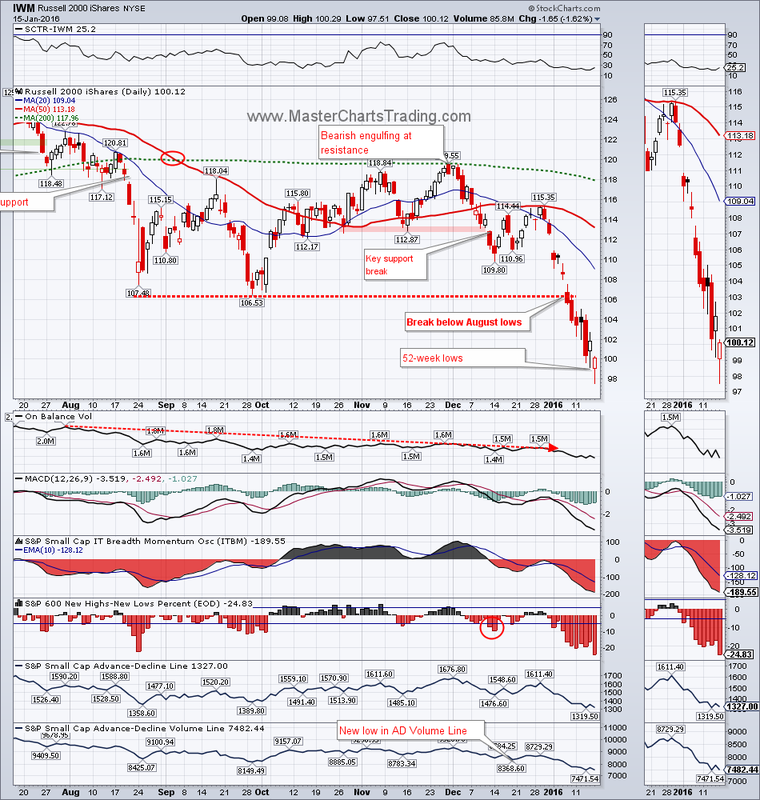
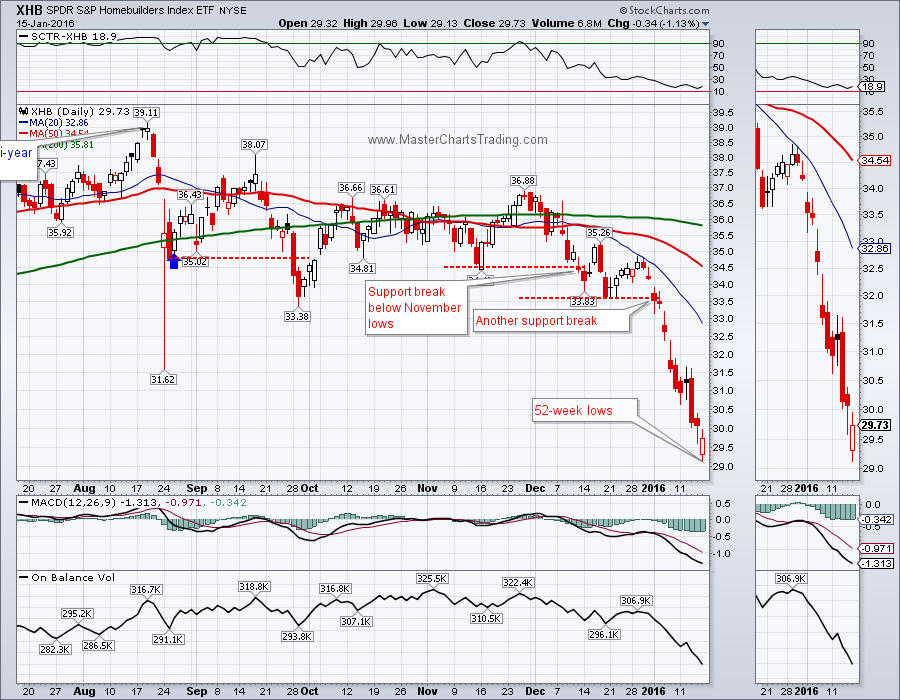
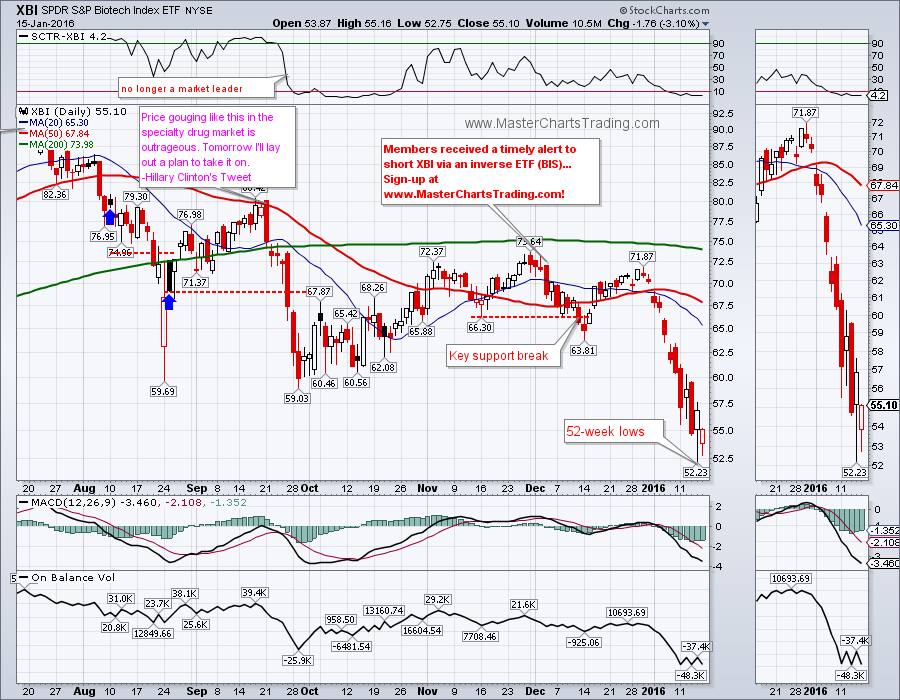
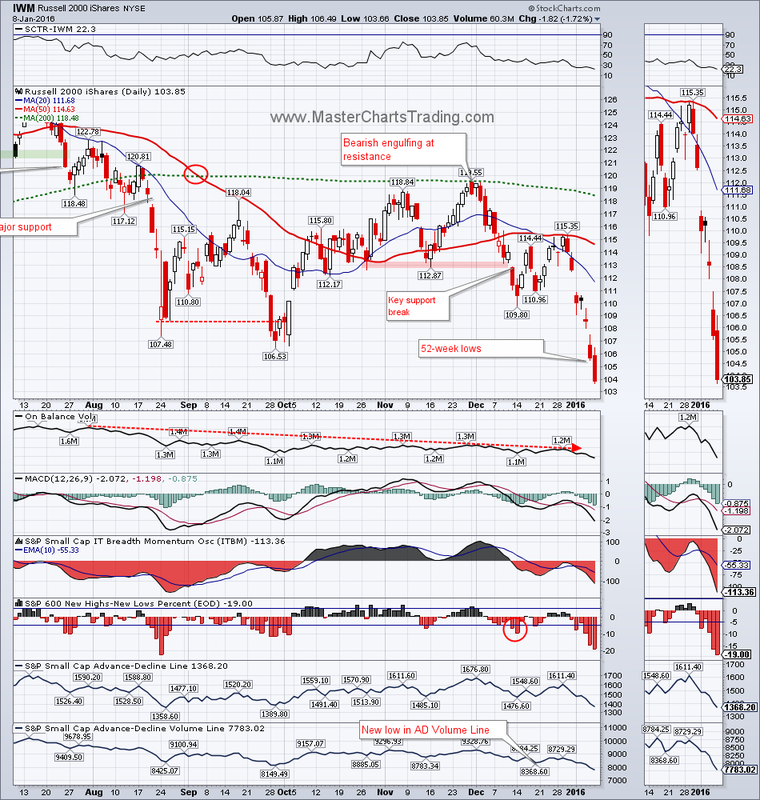
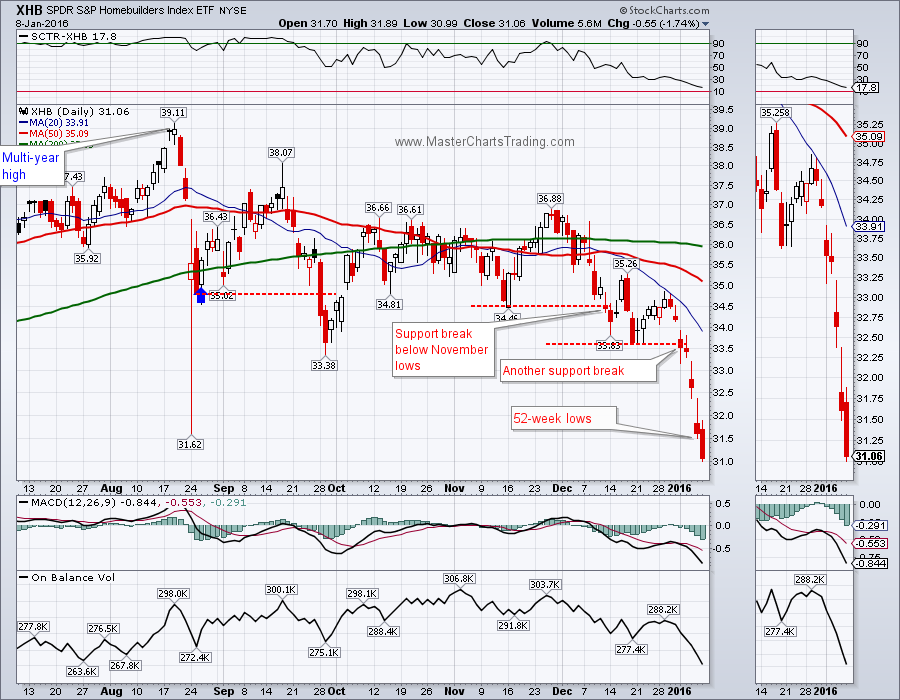
Many of the high-beta, economically sensitive areas of the market have been under pressure for a considerable period of time now and hit a fresh set of multi-year or 52-week lows. This includes IWM (small caps), XHB (homebuilders) and XBI (Biotech). This shows poor appetite for risk among the market participates.
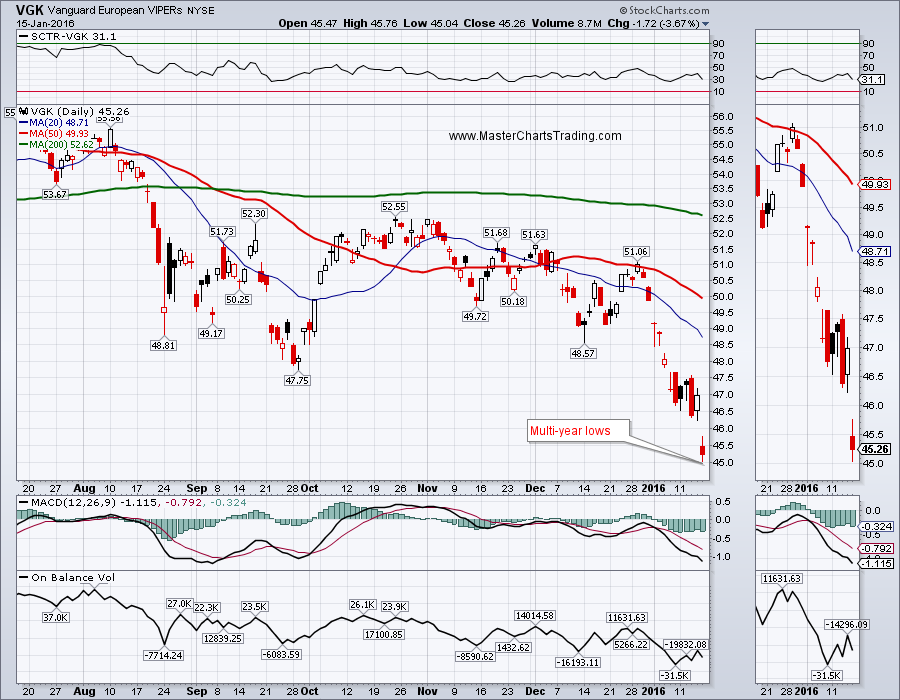
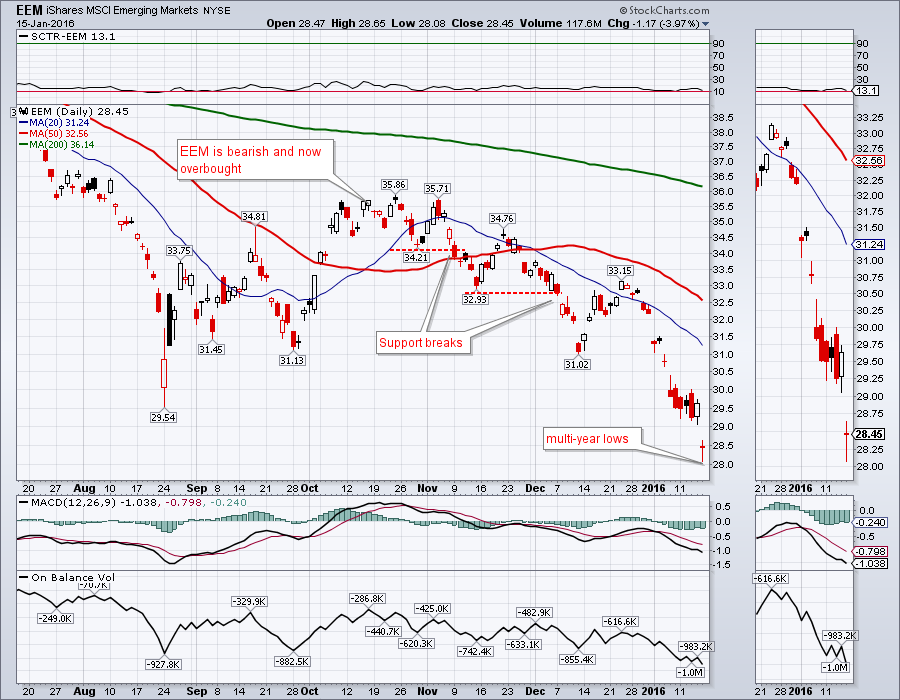
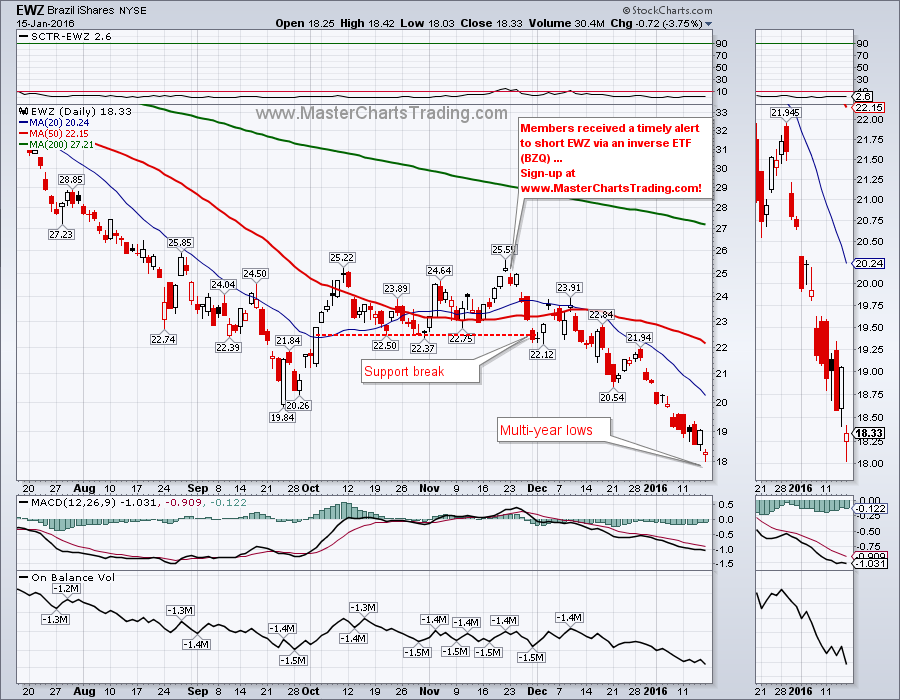
Selling was not limited to the US markets, but was evident worldwide during the first two weeks of 2016. Both the developed and the emerging markets were hit hard and many country funds hit multi-year and 52-week lows. VGK (Europe stocks), EEM (emerging markets), EWZ (Brazil) are some of the more prominent examples.
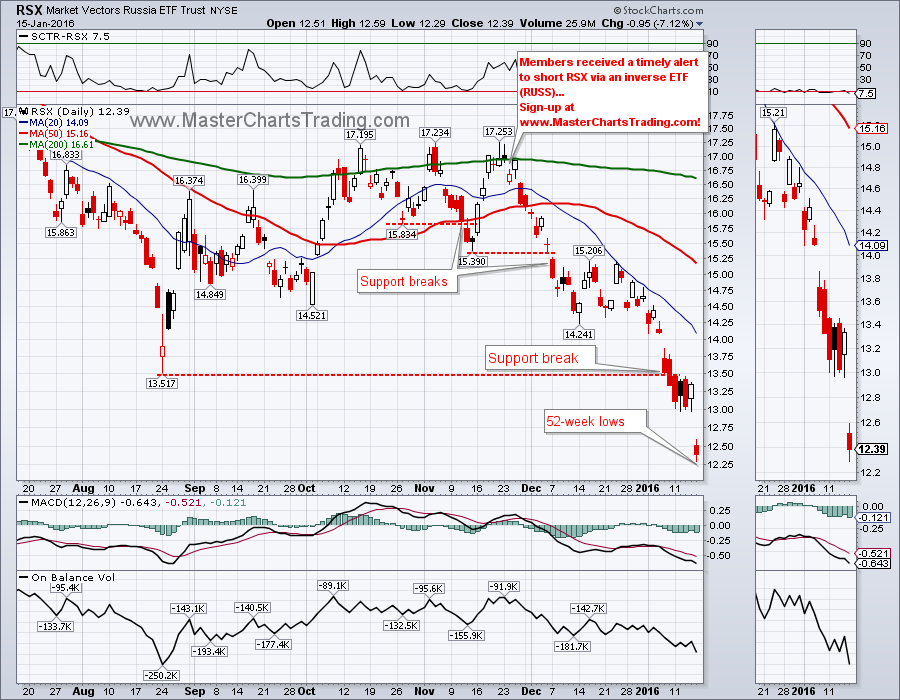
A clear winner on the downside this week was RSX – the ETF tracking the stock market of mother Russia. Just on Friday it collapsed over 7% and hit a fresh set of 52-week lows.
A clear winner on the downside this week was RSX – the ETF tracking the stock market of mother Russia. Just on Friday it collapsed over 7% and hit a fresh set of 52-week lows.
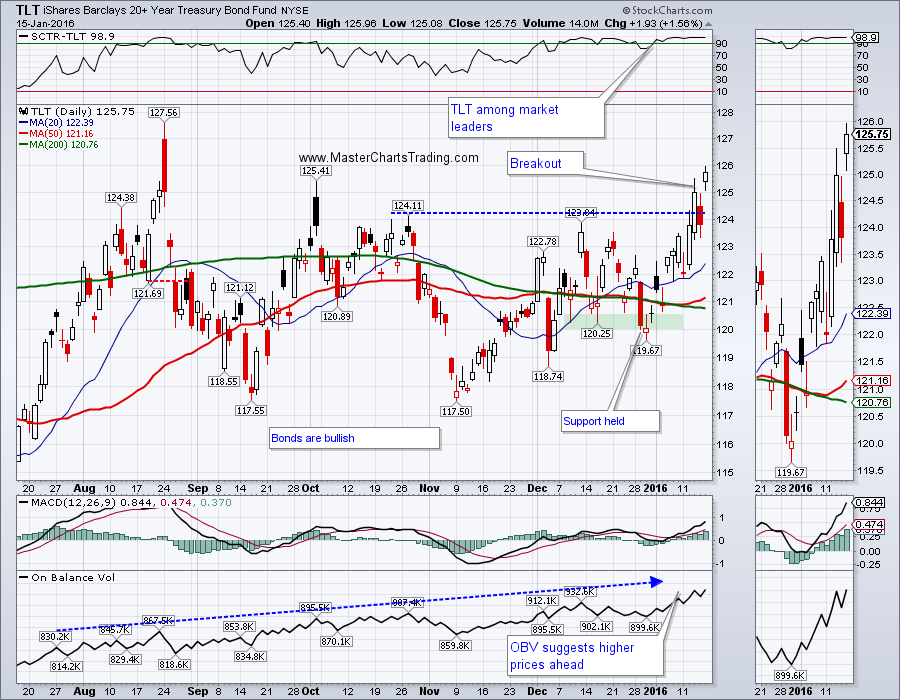
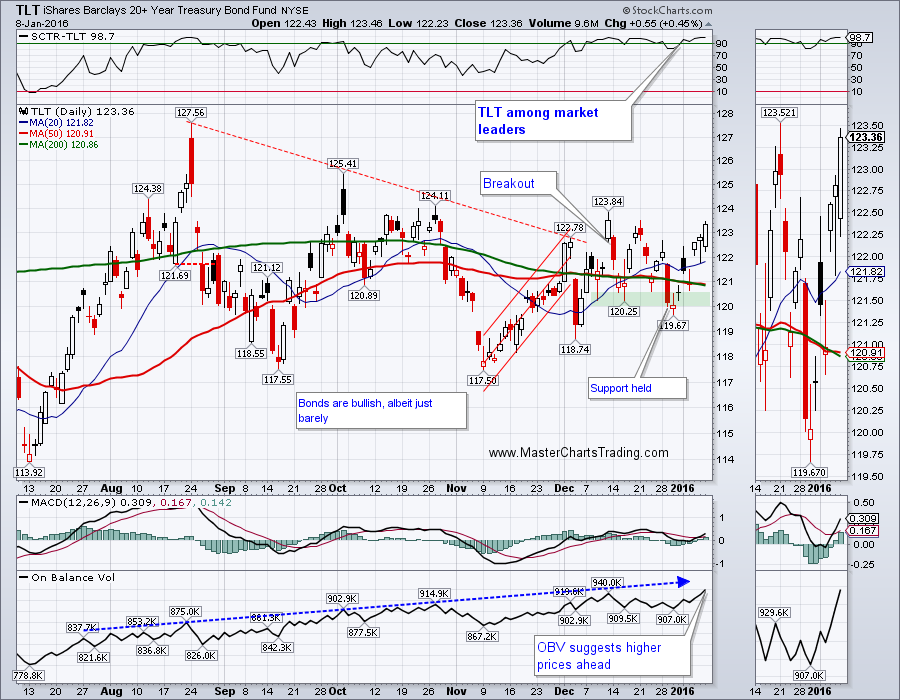
Bonds benefit during the time of financial stress, as money rotates into the perceived safety of the return of the capital. Return on capital takes a backseat to simply getting your money back from an investment. TLT broke out above the October/December highs and hit a new closing high for the move.
CHART OF TLT
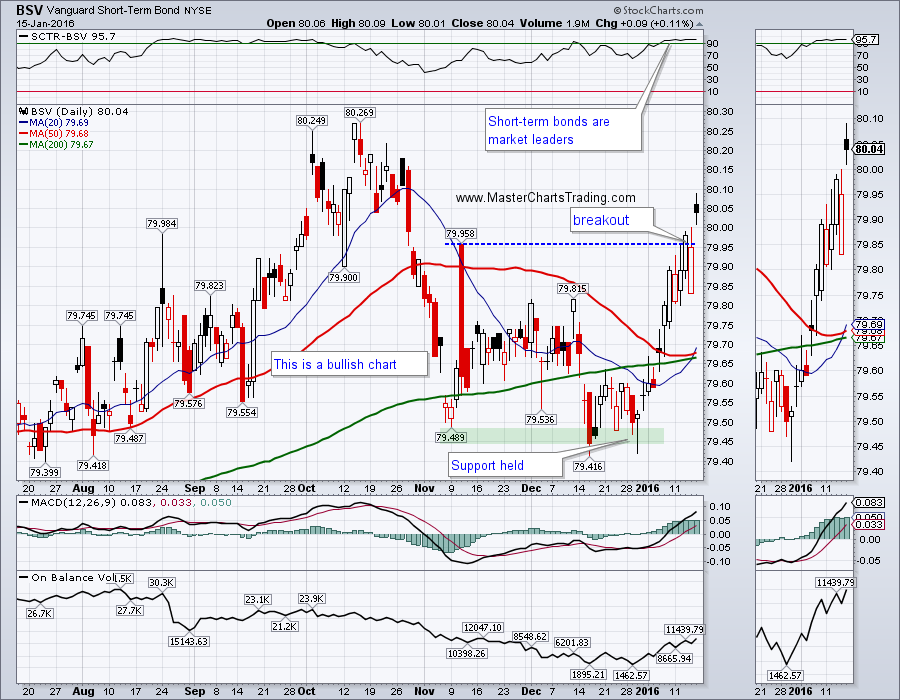
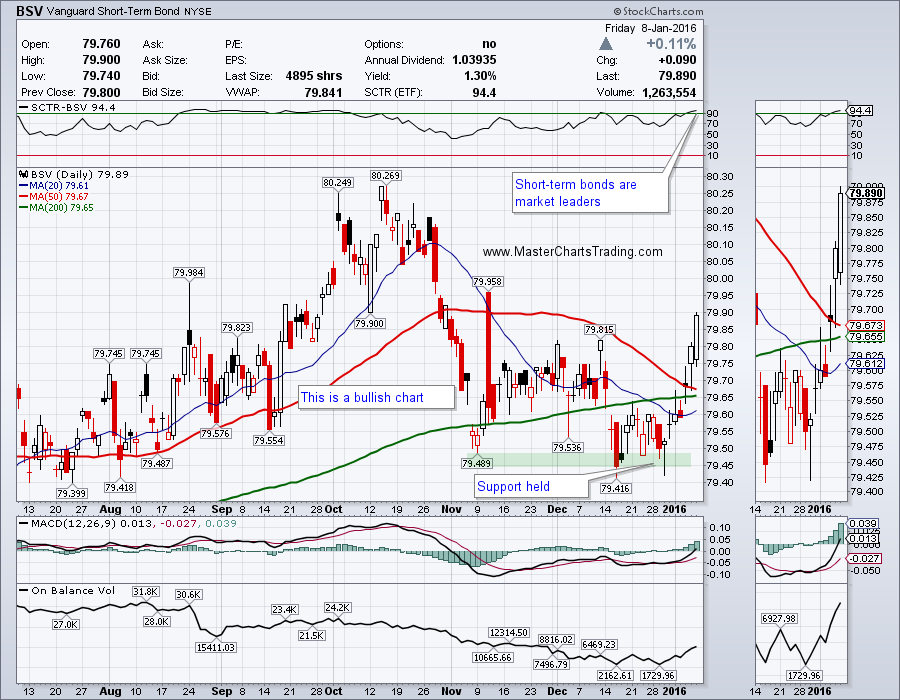
Even the short-term bonds are pushing higher. If you think about this for a moment, it is very counterintuitive. If the Fed is raising interest rates, shouldn’t bonds be worth less? The Market is sending a completely different message: we don’t care about rates; we just want to receive our principal back!
CHART OF BSV
CHART OF TLT
Even the short-term bonds are pushing higher. If you think about this for a moment, it is very counterintuitive. If the Fed is raising interest rates, shouldn’t bonds be worth less? The Market is sending a completely different message: we don’t care about rates; we just want to receive our principal back!
CHART OF BSV
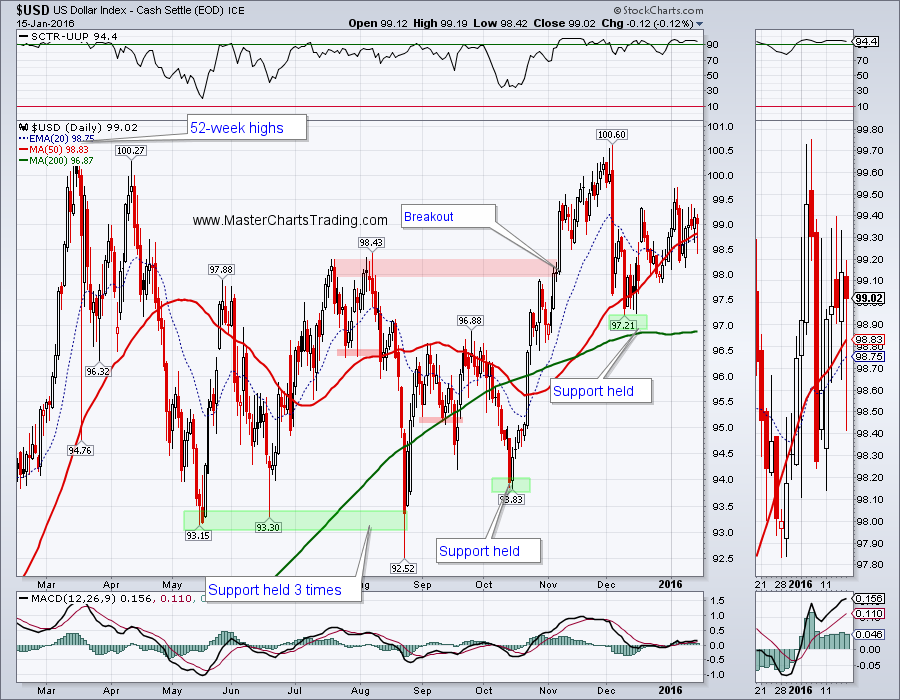
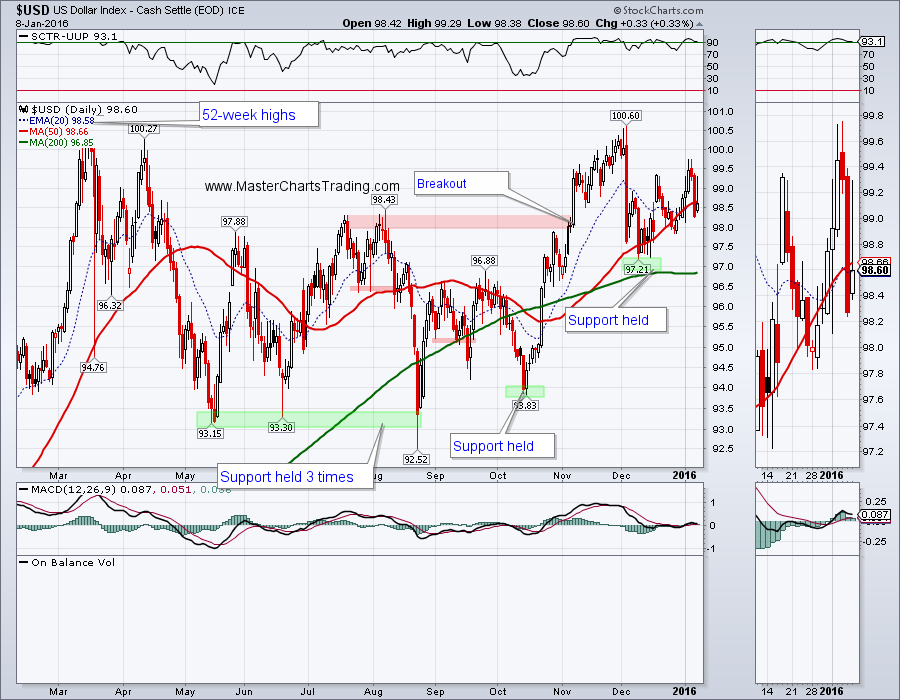
The dollar index ($USD) traded more or less sideways this week. $USD is bullish and is within a spitting distance of 52-week highs. With most of the world’s Central Banks easing (printing money), and the Fed tightening (raising interest rates and not printing money right now) its no wonder the dollar looks attractive.
CHART OF $USD
CHART OF $USD
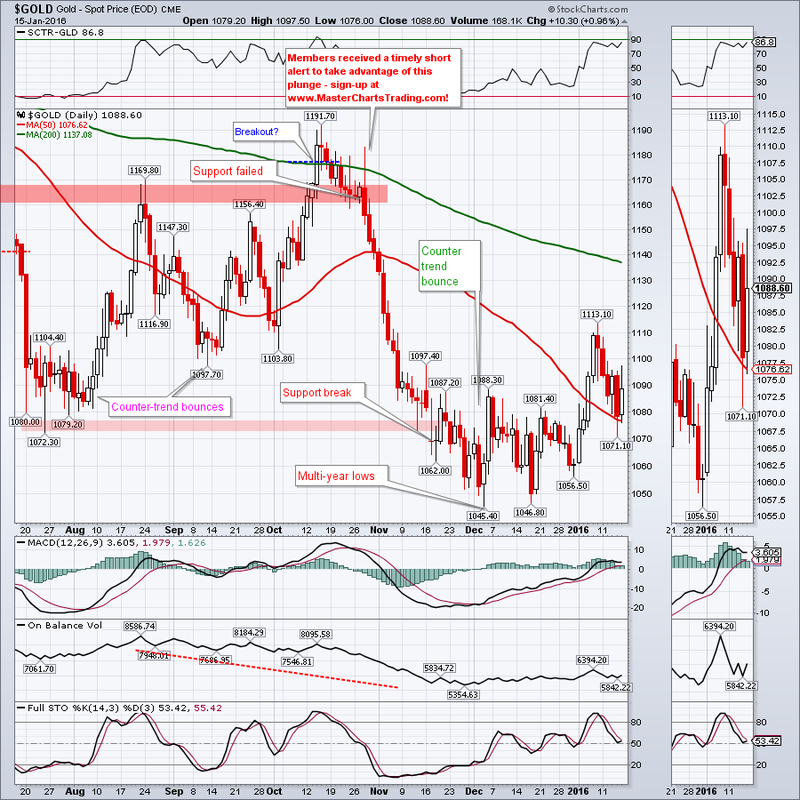
If you go to a store and buy an item on sale – you got yourself a bargain. A store discounts items for various reasons such as: new inventory arrived, the store bought too much, item’s expiration date is approaching, etc. But if you approach the stock market with the same attitude, you will likely go broke very soon! Market discounts stocks in accordance to a myriad of factors. One thing for certain is that it’s never wrong. If a stock goes on sale there is probably a reason for it. The beauty of technical analysis is that we don’t really need to know the “why” it is happening, we can simply take that it “is” happening and act accordingly.
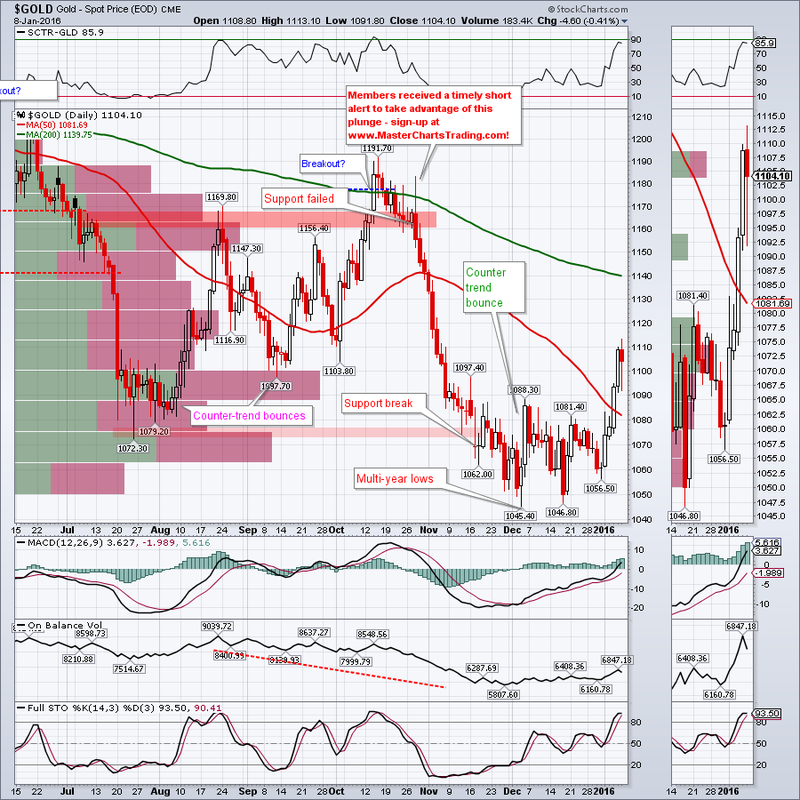
Gold is one such example: it hit multi-year lows just a few weeks back and since rebounded and then traded more or less sideways. It doesn’t change the fact that gold is currently very bearish. Maybe if $USD weakens somewhat gold could push higher to around $1140-$1160. Or maybe it just collapses from here. Either way: I am not looking to pick a bottom, but rather to wait for an overbought condition to manifest so I can short again.
GOLD CHART
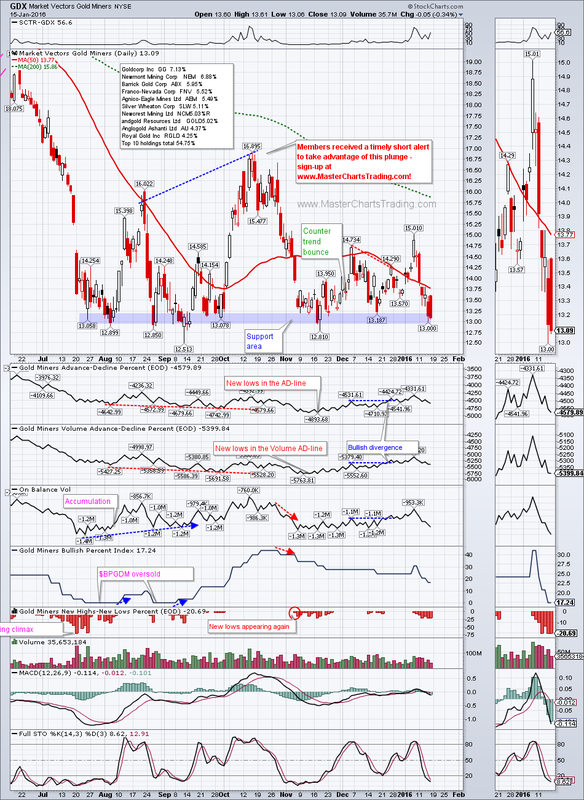
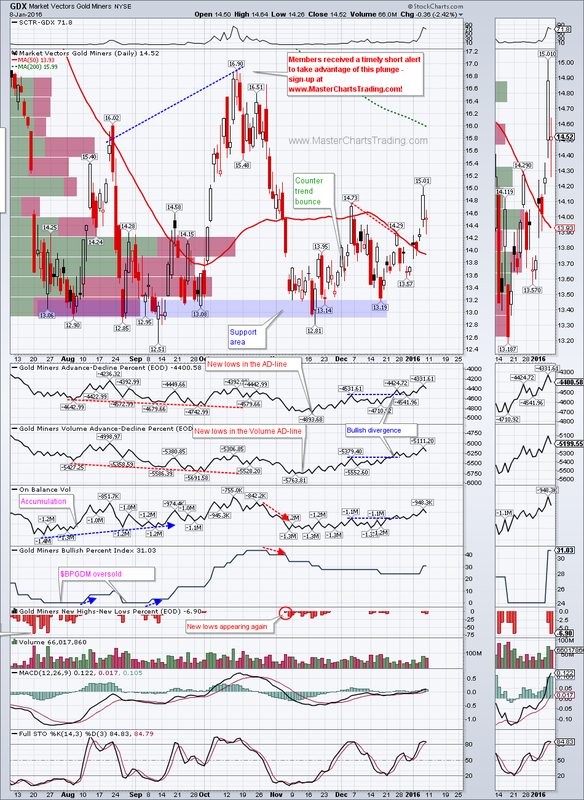
When you trade GDX it helps to keep in mind what is GDX composed of: small/medium cap, low priced stocks tied to a commodity. Small caps are more volatile then large caps. Low priced stocks are more volatile then the higher priced once. Commodity related stocks are generally more volatile then other types of stocks. Standard Deviation (a measure of fund's volatility) for GDX is around 34. That for SPY is around 11 and that for AGG is 2.74. What this means is GDX is violently volatile. It is best to allocate only a small percentage of your trading account to this security. Having said this…
GDX is back to the $13 magic level where it held support on numerous occasions in the past. It certainly looks vulnerable now and a break below $13 could easily shave off another 15-20% off its current price. An alternative scenario is another rebound attempt to, a now prominent resistance around $15, or possibly higher. In either case, I am only looking to short and not trying to pick a bottom.
CHART OF GDX
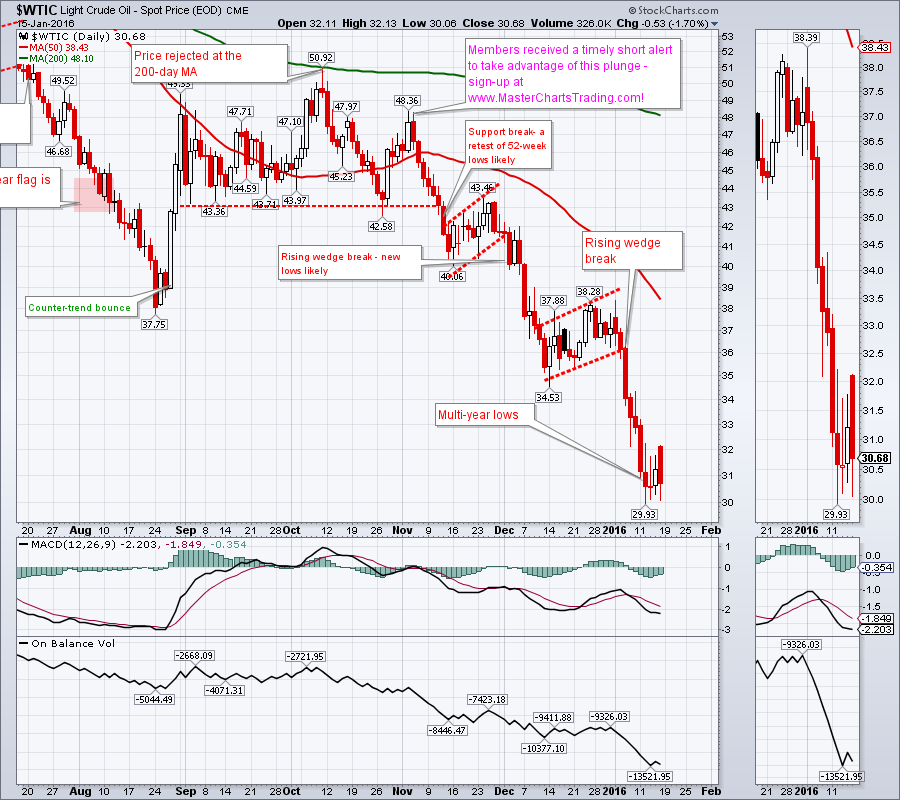
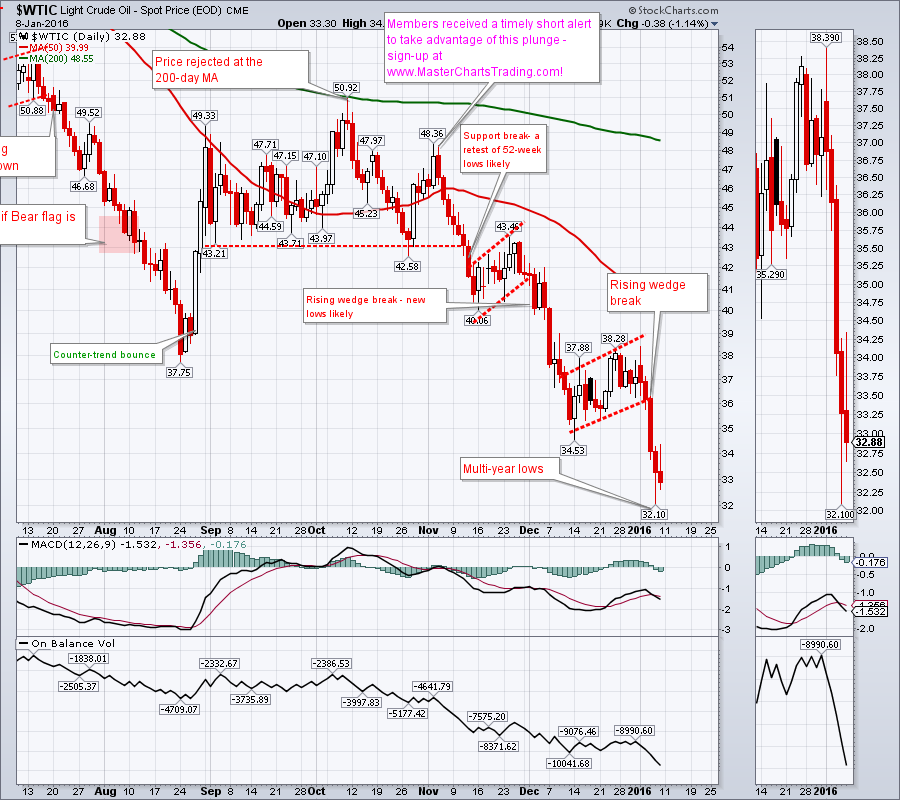
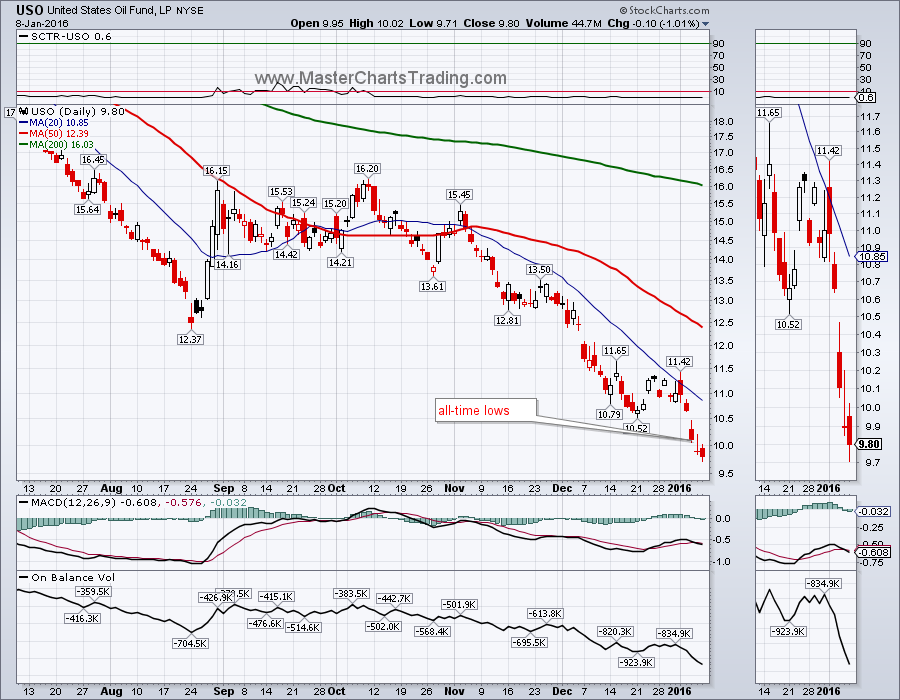
Oil hit the high $20s this week. It’s possible that we get a corrective action and a bounce to the $35 area. Oil is very much in a bear market so attempting to pick bottoms is fraught with dangers, but… Today we will look at some of the oil related funds and their behavior during the past few weeks which may be indicating that oil could put in at least an intermediate bottom or a “trade-able bottom” in the near term.
CHART OF $WTI
CHART OF $WTI
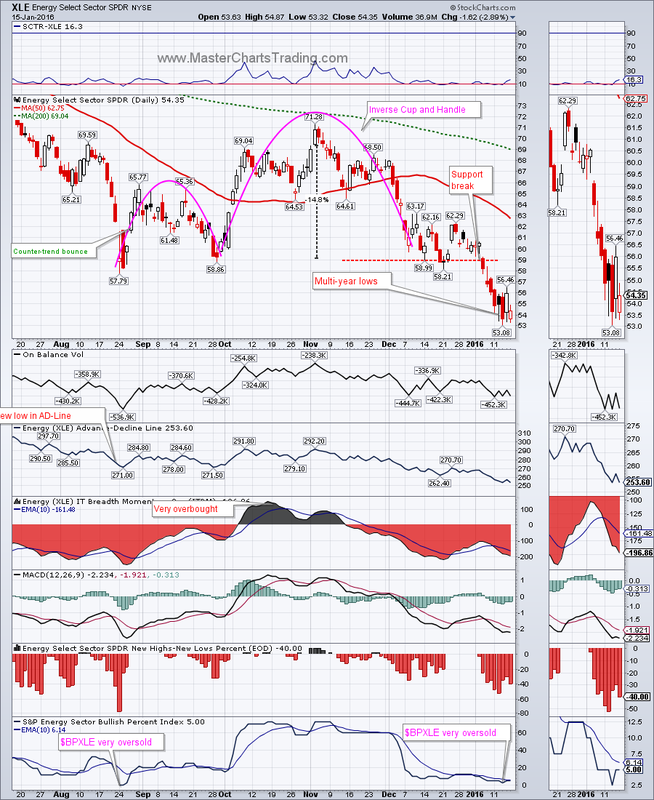
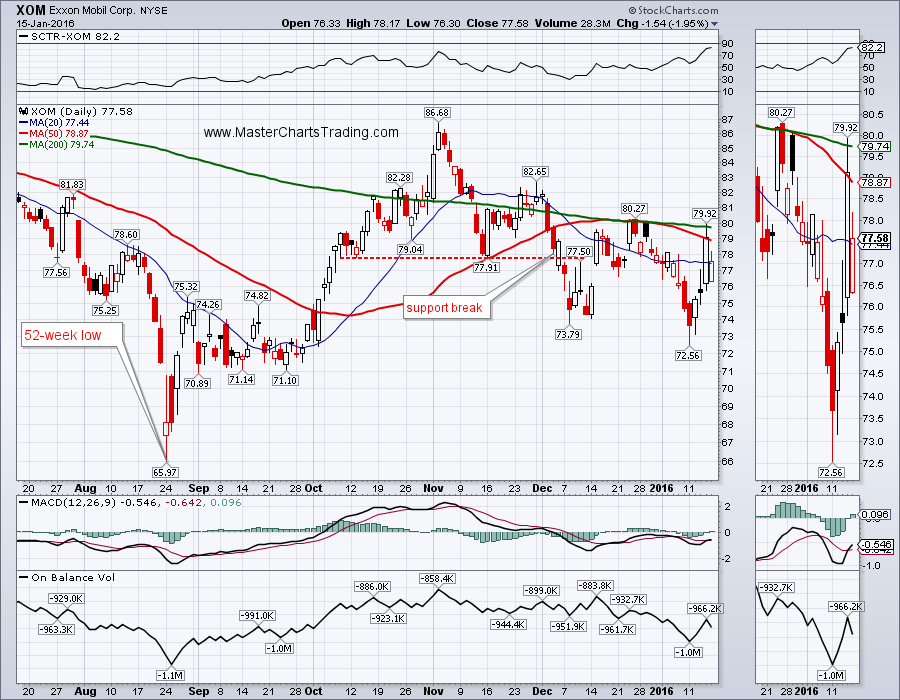
Energy fund (XLE) also hit a multi year low this week, but it may be approaching an inverse cup and handle pattern limits (see chart) and a sizable bounce could materialize. Looking under the hood of XLE, we see that it is extremely oversold. The Bullish Percent index for XLE hit 2.5% a few days back – a very oversold level. In the past levels these oversold lead to a sizable rally. Exxon Mobil (XOM) also diverged from the general market this week and did not drop with the rest of stocks.
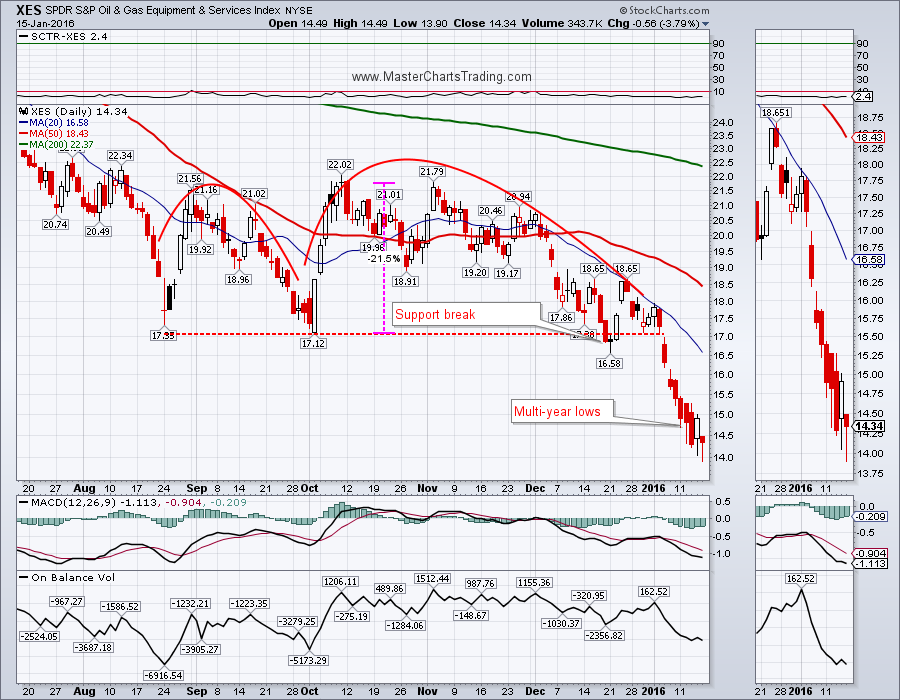
The Oil & Gas Equipment Services fund (XES) may also be approaching a limit of the measured move from the inverse cup and handle breakdown (see chart). Keep in mind that these measured moves are just rough estimates, but they could act as guideposts to lock in profits. If traders start covering their shorts in XES, a bear-market rally could easily materialize.
The Oil & Gas Equipment Services fund (XES) may also be approaching a limit of the measured move from the inverse cup and handle breakdown (see chart). Keep in mind that these measured moves are just rough estimates, but they could act as guideposts to lock in profits. If traders start covering their shorts in XES, a bear-market rally could easily materialize.
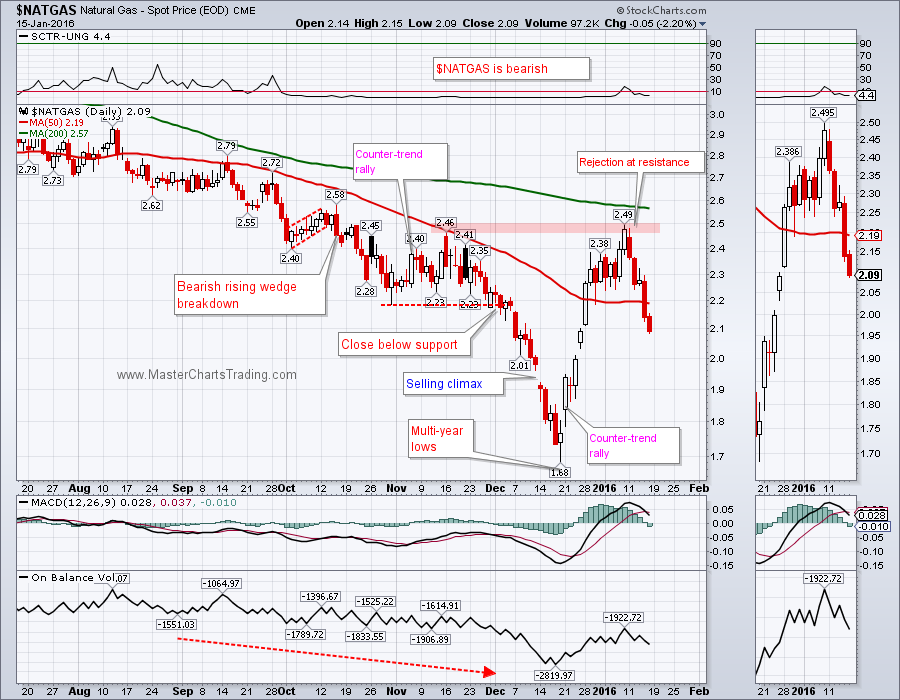
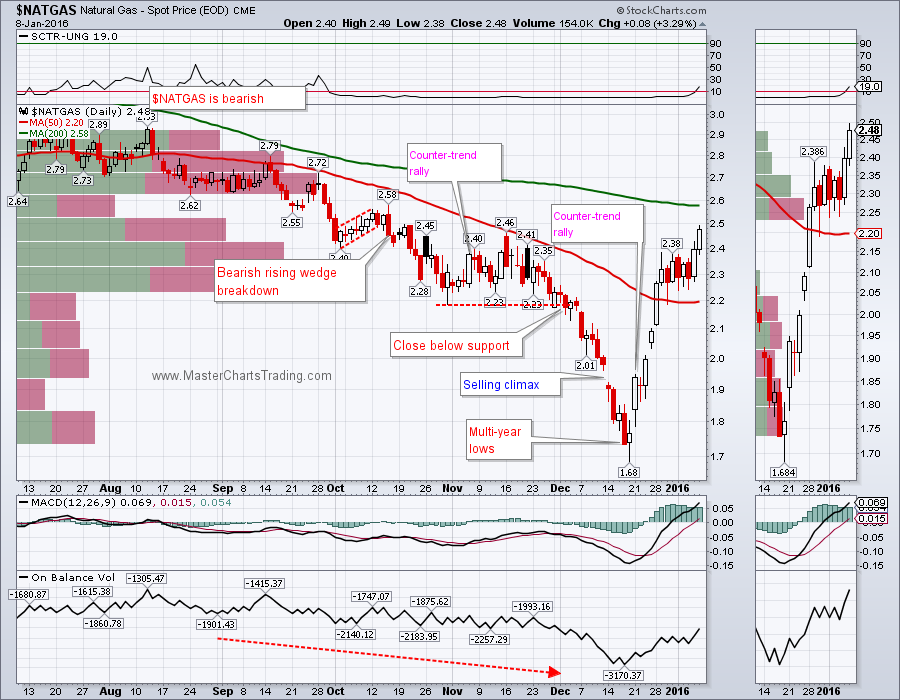
Natural gas price appears to have been rejected around $2.49. This is a resistance level marked by the previous peak – a logical place to fail. Natural gas is bearish, so (naturally) I am only looking for bearish setups and shorting opportunities. We could now easily retest the multi-year lows that were set in December.
CHART OF NATGAS
CHART OF NATGAS
Trade Alerts Service is now live – please sign-up here!
That’s it for this week’s market recap,
Best Regards and have another great trading week!
Alexander Berger (www.MasterChartsTrading.com)
That’s it for this week’s market recap,
Best Regards and have another great trading week!
Alexander Berger (www.MasterChartsTrading.com)


 RSS Feed