|
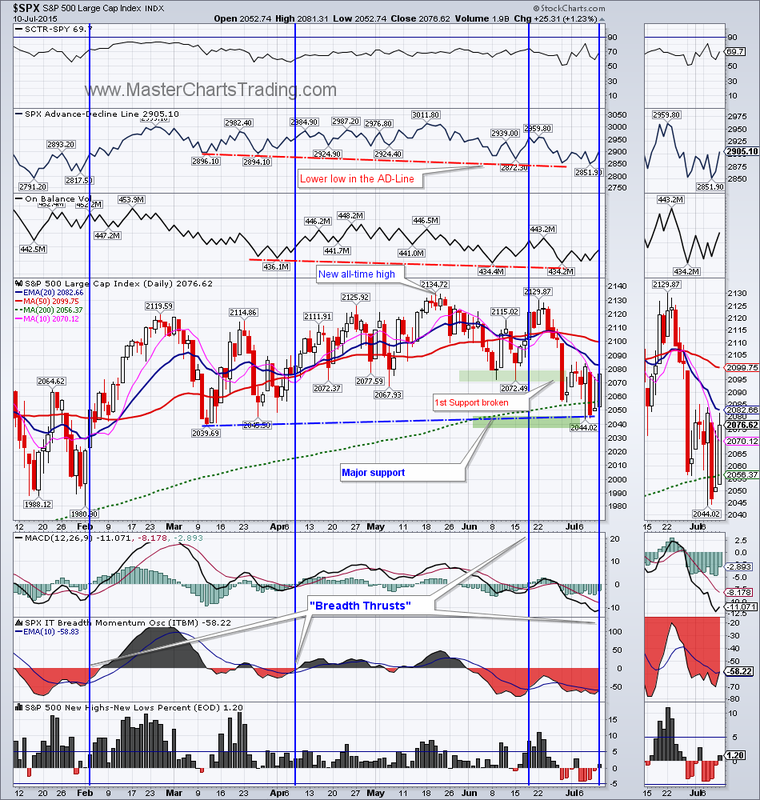
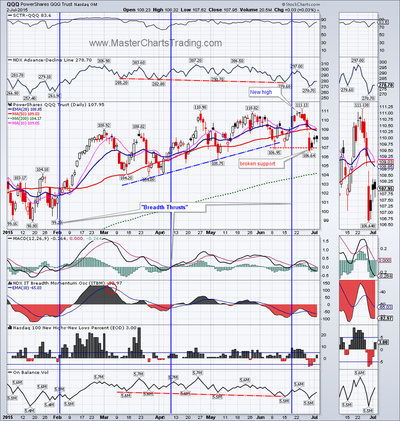
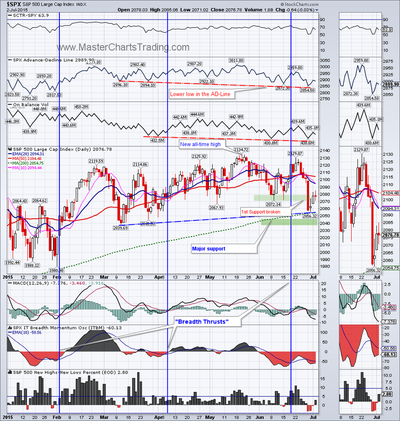
This was indeed a volatile week for the stock markets. On Wednesday the S&P 500 actually closed below its 200-day moving average. The 200-day moving average is a widely watched benchmark - even by the fundamental investors. Many consider a price closing below the 200-day as a sign that a security now entered a bear market. Thursday $SPX tried to rally, but closed near the lows, while Friday was a strong day with a close above the 200-day moving average on a strong candlestick. Few divergences still remain on the charts of $SPX, but I think they have basically “worked off”. $SPX went on our buy signal and breadth momentum for $SPX is on an upswing.
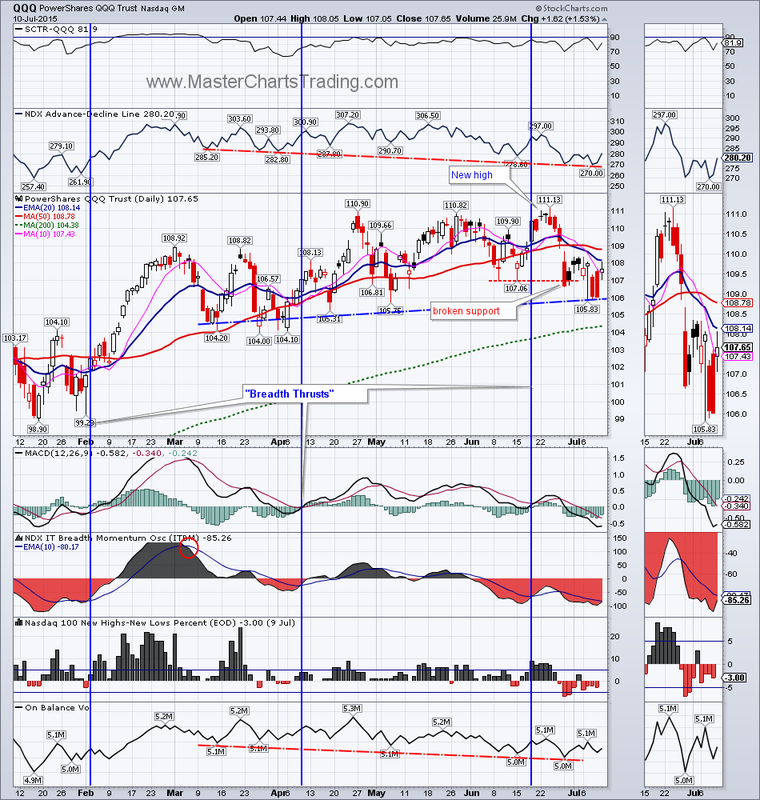
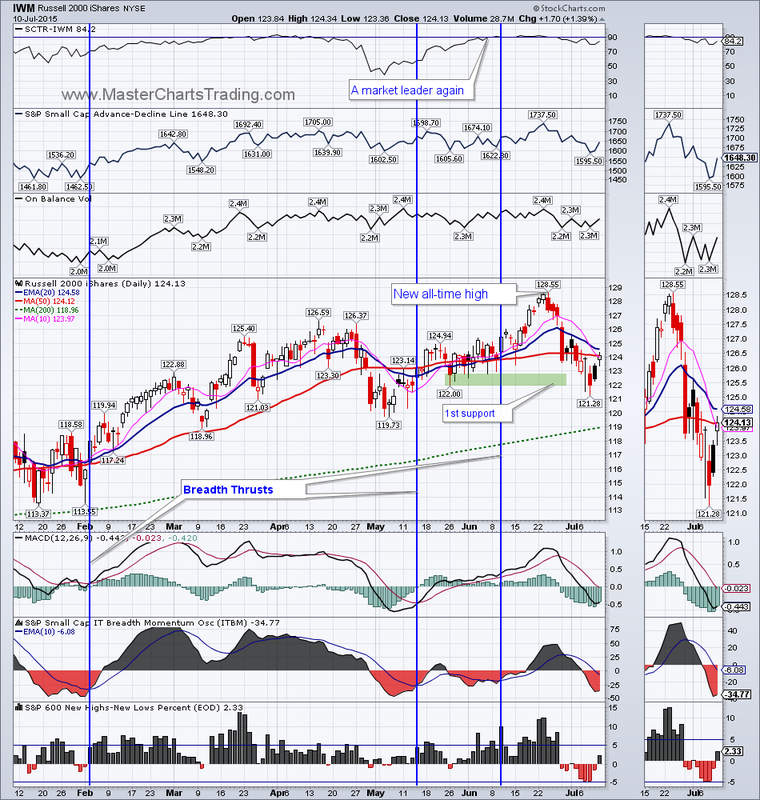
Charts of SPX, QQQ, IWM and their market breadth |
|
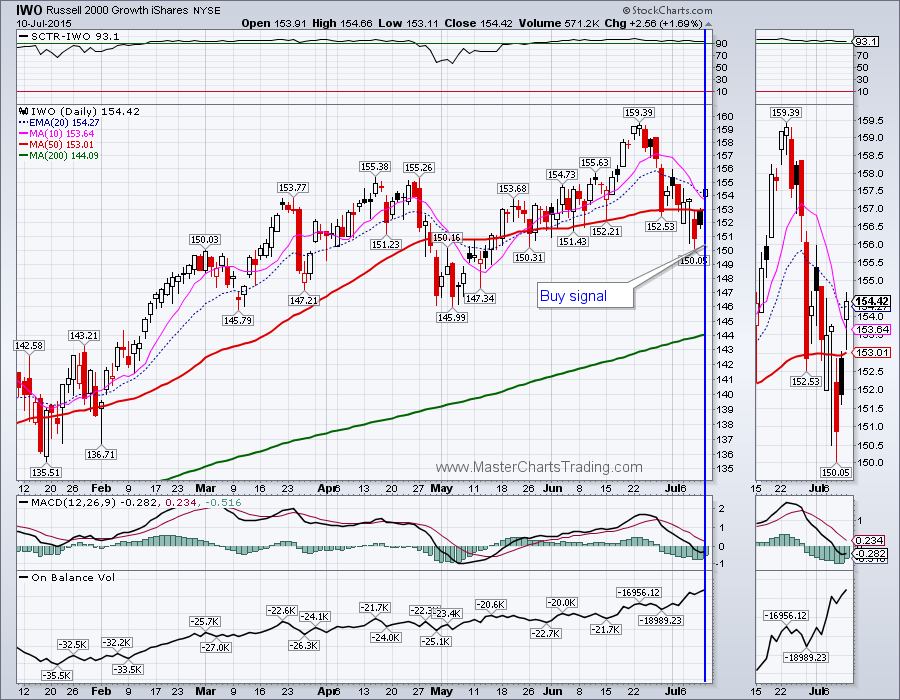
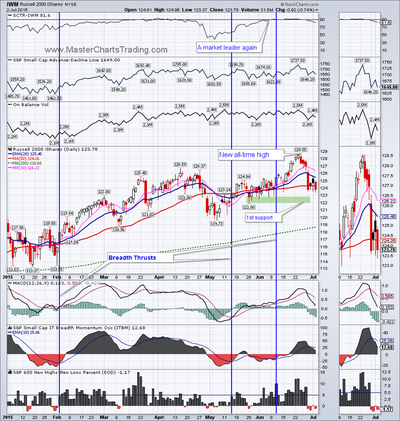
I think the best opportunities in the market right now are in the small cap universe. The charts of IWM have the least divergences. Unlike its large-cap brethren, IWM did not even break its first support by holding above the $122 level on closing basis.
Best Regards and have another great trading week!
** Special Announcement**
We are close to launching a stocks alert service. Please sign-up for our mailing list to be the first to take advantage of the discounted membership once it becomes available!
Alexander Berger (www.MasterChartsTrading.com)


 RSS Feed