Watch this Video on Youtube!
youtu.be/jGcqKwvyfVY
Magnificent Seven Stocks Lead, while Rest of the Market Lags
Junk Debt Diverges from Stocks
Market Breadth Shows Significant Weakness for Small & Mid Cap Stocks
Bonds Are Oversold & Interest Rates Likely to Ease
Gold Loses Luster as Dollar Approaches 52-Week Highs
Bitcoin’s Officially Enters a New Bull Market
Stocks Covered In Members Only Video:
Market Breadth, SPY, DIA, QQQ, IWM, Magnificent 7, Equal Weight SPX, Real Estate, Communication Services, Financials, Utilities, Semiconductors, Brazil, China, Hong Kong, Australia, Mexico, Germany, Argentina
Amazon, Boeing, Bank of America, Caterpillar, Disney, FedEx, Google, Intel, JPM, Kraft Heinz, 3M, Nvidia, UPS
Beam Tx, James Hardie Industries, Novavax, NovoCure, Newell, Tronox Holdings, Sweetgreen, Sarepta Tx
Follow for daily insights and technical analysis:
🌐 Website: https://www.masterchartstrading.com
🐦 X (Twitter): https://twitter.com/Master_Charts
💬 StockTwits: https://stocktwits.com/Mastercharts
📘 Facebook: https://www.facebook.com/MasterChartsTrading
🎥 YouTube: www.youtube.com/c/MasterChartsTradingcom
📊 TradingView: https://www.tradingview.com/u/mastercharts/#published-scripts
$SPY $QQQ $IWM $JNK $HYG $IEF $TNX $DXY $GLD $GDX $BTC $IBIT
#StockMarket #Bitcoin #MarketAnalysis #SP500 #Nasdaq #Investing #Trading #Bonds #TreasuryYields #InterestRates #Gold #Dollar #Crypto #TechnicalAnalysis #MarketBreadth #BullMarket #BearMarket #MasterChartsTrading $SPY $QQQ $IWM $JNK $HYG $IEF $TNX $DXY $GLD $GDX $BTC $IBIT


There are still quite a few bearish divergences in the markets, and they’re getting worse, if anything. Will the stock market right itself as a result?
We will look at bonds, which I think are definitely oversold, and I think interest rates are likely to ease in the near future. Gold continues to lose its luster as the dollar closes in on 52-week highs. And finally, Bitcoin has officially entered a new bull market, as was predicted recently.
All this and more in today’s edition of the MasterChartsTrading.com Market Recap.
As always, like, share, and comment on this video. Put a thumbs-up or any other comment on the video. This is what keeps this channel going and makes the algorithm offer this video to more viewers. Thank you very much for all the comments I’ve been getting.
If you are a subscriber, stay tuned. We finally have some interesting developments and lots of various oversold stocks, so stay tuned for that. We’ll cover that in the members-only video.
If you are not yet a member, consider signing up by going to MasterChartsTrading.com. Click on Sign Up and sign up for our products. Throughout the presentation, I’ll be using my proprietary trading indicators, which can be seen on all of the charts displayed in this video.
So first of all, let’s look at the S&P 500.
The S&P 500 is basically very close to its records. In fact, some of the biggest stocks in the S&P 500—the Magnificent Seven—have already hit new records. There was a new record on September 21st and yet another one on September 22nd.
So this is showing a clear tendency of market participants to prefer the mega-caps—the huge stocks: Google, Apple, Amazon, Nvidia, Tesla, Microsoft, Facebook/Meta.
On the other hand, we’re seeing small caps, IWM, which are no longer anywhere close to the records. In fact, this is a new low for the past three or four months or so, set on September 24th. So you can notice a huge divergence between the Magnificent Seven and the small caps.
Mid-caps are also doing pretty much the same thing. So this is showing a divergence.
An additional divergence can be seen on the chart of high-yield bonds. High-yield bonds—JNK, ticker symbol JNK, or HYG—are pretty much identical as far as I’m concerned.
JNK made a new record here on August 27th and then pretty much continued lower. In fact, we’re now below the blue support/resistance line.
This is, in my opinion, a good opportunity to consider opening a new long position—to buy bonds yet again. So if we rally back above the blue support/resistance line for ticker symbol JNK, then most likely there’s a very good chance we will at least attempt a new record.
But the way things are going, obviously nothing is set in stone, and the divergences are pretty glaring.
So I just showed you two divergences. One was high-yield bonds. High-yield bonds correlate highly with the general markets. Therefore, we can say that there is a good chance that high-yield bonds are actually leading the S&P 500 to the downside. At the very least, they appear to be doing so for mid-caps and small-cap stocks.
The other divergences I wanted to highlight are in entirely different metrics, and that is market-breadth measures. So let me show them to you on the market-breadth chart.
Some of those glaring divergences are, for example, the percentage of stocks above the 200-day moving average. We topped out at around 75% in mid-August and then just completely collapsed.
And it actually kind of makes sense because smaller-cap stocks, like I just showed you—small-cap and mid-cap stocks—are moving lower, while the large-cap stocks such as QQQ and Nasdaq are moving higher. Nasdaq also, I believe, made a new record, or at least is attempting to make a new record.
So when we see such a divergence in market breadth, it does make sense. For market breadth, it doesn’t matter what size the stock is. A stock could be a little tiny small-cap company or it could be a mega-cap, but they will count the same—as either one or minus one.
In this case, we can see that a whole bunch of stocks just completely collapsed. We went from 75% of stocks above the 200-day moving average to about 47% of stocks above the 200-day moving average.
So that’s one of the measures that we’ll look at for stock-market breadth.
Another breadth measure that’s displaying a pretty obvious bearish divergence is the Bullish Percent Index. Again, you can find out more about the Bullish Percent Index by going to StockCharts.com and searching for it in ChartSchool.
There is a calculation that is done, but nevertheless, it’s a useful measure because you can see that we went from over 70% of stocks being on a buy signal to less than 37% being on a buy signal.
The same levels correspond to the S&P 500 from April of this year, right around where this gap is.
So my previous week’s idea was that perhaps we’re about to see a move lower toward the 2026 levels. Can this happen? Yes. But for that, the Magnificent Seven need to start being sold, because right now they’re at new records, and obviously they’re pulling the weight of the entire stock market.
If the Magnificent Seven also start being sold, then we can easily reach levels that were seen in April of this year.
So there is that gap between April 7th and April 8th. That level is actually very dangerous because it will be almost at the yellow support/resistance line, which would indicate a bear market for the entire S&P 500.
So let’s hope that doesn’t happen, and let’s hope that we see JNK finally find a bottom and buyers come in.
It’s entirely possible. When I get to the bond sector of this presentation, I will also show you that bonds are indeed oversold. High-yield bonds are indeed bonds, although they behave more like stocks, albeit with lower volatility.
So we’re looking at multiple divergences that are still plaguing this stock market. So far, none of them have been resolved. We’re looking at either a potential continuation of the pullback or, finally, a bottom and maybe an attempt to push higher, especially if high-yield bonds find a bottom.
Okay, so now I want to mention the 10-year Treasury note yield.
The 10-year Treasury note yield has pretty much skyrocketed very recently. You can see that as recently as June of this year, it was at 4.4%, and it’s currently around 5.18%. So that’s a significant move for interest rates.
By extension, bonds have basically been routed. Here is the intermediate 7-to-10-year Treasury bond fund. You can see that it really collapsed and actually hit, I believe, a multi-year low—or at least a two-year low.
So, yeah, it hasn’t been this low since July 2025.
Now remember that I’m using adjusted prices. Adjusted means that the coupon or dividend from this fund is added back into the return. If I uncheck “adjusted,” then the bonds are really in the dumpster, at levels going back to 2023.
But I personally prefer to use adjusted prices for anything that pays a dividend or coupon. In this case, yes, it definitely pays a dividend or coupon.
So I think that this is most likely a topping candle. It looks exactly like a shooting-star candlestick. I’m going to zoom in on it.
On Friday, yesterday, prices basically went up, and then the bears said, “No way, we’re going to come down,” and we actually closed near the lows of the day. So it’s a classic-looking shooting-star candlestick.
The opposite is true for the IEF 7-to-10-year Treasury bond fund. We can see it’s more of a hammer-like candlestick—a shadow out of the bottom, a green candlestick, and the close near the top.
So this does look like a potential bottoming candle for bonds and a potential topping candle for the yield.
I think in the next few weeks we will see a rebound in bonds. In fact, we can put in a ghost field. Let me see where it’s at.
I did put in a ghost field before, and it kind of worked out really well, weirdly enough.
Going into probably November—I’m guessing around the November elections—we might see something like that.
This is the red support/resistance line, and assuming we don’t make any new lows, it will just continue sideways, basically.
So I’m predicting that we’re going to see a rise in bonds and, by extension, a fall in yields going into the November election.
But I think this rise will ultimately be a bear-market rally, and we will want to sell it short once it gets to that level. But right this instant, I definitely don’t think we’re going to go much lower. Maybe slightly lower, but not dramatically lower.
We can also put in a ghost field for interest rates. Something of this nature might happen. Maybe we’ll see the yield come down toward the blue support/resistance line, to about 4.75% for the 10-year Treasury yield.
But right this instant, I think that a rebound in bonds is very likely.
The dollar is also surprising many, many people.
We had Treasury intervention back around July 29th and 30th. We made another low, but we never made it all the way back down to the bear-market levels where the red line is.
Then we sort of went back, and now we are back in the bull market, basically.
Not only are we back in the bull market, we’re actually approaching fresh 52-week highs. These are 52-week highs that were set in June of this year.
So if we break out above them, we will actually be at 52-week highs, and we’re going to be at roughly two-year highs by then.
I’m fairly certain this is going to happen. Maybe not necessarily immediately, but I think we are still in a bull market for the dollar.
By extension, gold is really under pressure.
You can see that we made a high back in January of this year, and we pretty much have been making lower lows and lower highs. In fact, the bear market for gold began right there where I’m hovering, on June 10th.
Okay, we made this higher high here, but it’s not that significant. Relative to the high from May 12th, it’s still lower.
Then we have multiple sell signals—those downward-facing arrows—where we are trading first above the red line and then below it.
Right now, we’re pretty much unequivocally in a bear market. In fact, we’re so close to the yellow support/resistance line that if we close below that, that’s a definite bear market.
So what’s happening? Yes, because the dollar is rising, gold is falling.
Gold is traded in U.S. dollars—gold divided by the U.S. dollar. The bottom part of this equation, the U.S. dollar, is getting bigger. It’s getting heavier, so it’s pulling this currency pair lower.
Remember that gold is nothing more than a currency pair. It’s a commodity.
Yes, you can store it under your pillow in case of an emergency and try to buy food when the Mad Max scenario unfolds, although I seriously doubt you’ll be able to do that because most likely you’ll get robbed unless you buy yourself security, in which case you basically become a local gangster.
So yes, gold is a store of value, but in general, in my opinion, it’s nothing more than a currency pair.
Yes, it carries value of some sort, and smart people might use it somehow to survive in very unfortunate scenarios.
And as I kept saying, one of the better ways to store gold would be to have easily divisible gold, such as actual gold chains.
What you could do is cut off a piece of that gold chain and go to a local underground market. Let’s say we’re talking about a pretty far-out scenario where suddenly there are food shortages or other shortages. Cash is basically useless, but you could cut off a piece of gold and go to a market and say, “Okay, I want this much meat or bread for it.”
Then you’re much less likely to get robbed than if you bring your gold coin—a Gold Eagle—which is, what, about $3,000 per Gold Eagle right now? You can’t easily cut it. I mean, you have to use a chisel or a hammer or something to cut it.
So yes, definitely think about that if you are trying to prepare for end-of-the-world scenarios.
But the other thing is: don’t worry about end-of-the-world scenarios.
If you want to prepare for that, you may want to have emergency food, medicine, clothing, transportation, gas, things of that nature, and a place to go out of town.
Maybe if you’re wealthy—or if you’re using my indicators, for example, to trade and you’re actually making money—then yes, definitely invest in safety. Definitely invest in safety for your friends and family. Community also will become important.
Anyway, that’s my aside about gold.
So yes, I think gold is in a downtrend, and should the dollar continue moving higher, gold will absolutely continue moving lower.
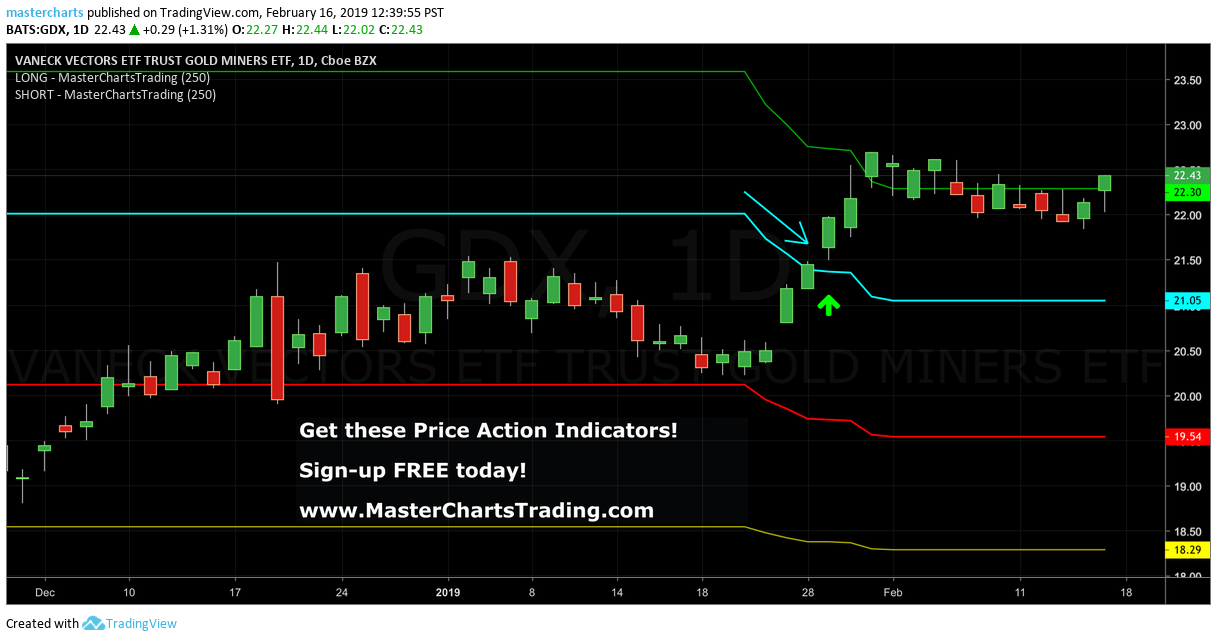
The same can be said about gold miners. They actually really rallied, and you can see there were several buy signals here in August. But now we’re back into bear territory, and gold miners are definitely tied to gold. They’re not tied to anything else.
So yes, gold miners are also under pressure.
Finally, Bitcoin.
I’ve been saying things about Bitcoin for a while. I’ve been saying that as early as, I believe, June—or maybe even earlier this year—that we most likely had bottomed.
Then we had this giant rally. Three days basically wiped out tons of losses.
I was saying, “Yeah, we’re pretty much there. We’re almost in a bull market.”
Finally, this week—officially on Monday, September 21st—we broke out above the blue support/resistance line. We’re now officially in a bull market.
We can project my indicators into the future. One of the subscribers actually sent me this picture. I sometimes look at those, but sometimes I forget to look at them.
Whenever the indicators line up like this, in this case you can see that they line up into the future. So this is already October.
The way the indicators are curving down, combined with the fact that the price is already above the blue support/resistance line, makes me think that we’re going to kind of hug the indicator lines to the downside until we probably bottom out sometime in mid-October and then most likely make a new leg higher.
You could potentially buy Bitcoin right away if you have a longer-term horizon—for example, if you don’t really worry about a stop below the previous lows or the yellow support/resistance line.
But if you want to get a better price, there is a good chance we will pull back in the next few weeks toward around $70,000 or so. At that point, that would be a killer buying opportunity for Bitcoin.
And as I mentioned, I think the upside for Bitcoin is actually quite robust.
Bitcoin could easily, just from this pattern—I’m going to highlight this pattern—from the lows, or even from this pattern right here where the breakout began, from the lows of August 16th to the recent highs, we had about a $24,000 move, or 38%.
So if that is purely duplicated on the upside, we’re looking at well over $100,000 for Bitcoin. That is actually very, very likely even in the relatively short term.
But I think if that happens, then these highs are threatened, and most likely we’ll make new records—and I mean all-time-high records.
So I am quite bullish on Bitcoin right this instant.
I was bearish not so long ago. The bear market in Bitcoin started where I’m hovering, in November 2025, and continued unabated until relatively recently, when we made the low here in July 2026.
But like I said, the picture has definitely changed.
I would really consider looking at Bitcoin, either as actual Bitcoin or through Bitcoin-related ETFs. In America, for example, we have IBIT, which is one of the ETFs that holds Bitcoin.
That’s it for this week’s recap.
Head over to MasterChartsTrading.com. Again, these indicators are available for this interface called TradingView.com. TradingView is free. All you’ve got to do is sign up for free on TradingView.com, then come back to MasterChartsTrading.com.
My indicators are available with a seven-day free trial. They’re $24.95 per month if you are a yearly subscriber or $29.95 per month if you are a monthly subscriber.
I send out daily alerts about various stocks that we trade, along with a weekly members-only video. For example, this week we’ll be covering quite a few different ETFs, large-cap stocks, as well as some more speculative securities.
That’s the newsletter, and the best deal is to get both the indicators and the newsletter. You get almost 17% off, which is essentially two months free, if you sign up for the yearly subscription versus the monthly subscription.
That’s it for this week’s recap.
Please, again, don’t forget to hit the Like button and subscribe to this channel. Put a Like and put a thumbs-up in the comment section.
Thank you for watching. Have another great trading week.





 RSS Feed