Watch this video on YouTube!
youtu.be/KD9E_YyQ5F4
Click Here for the Latest Market Recap!
Vulnerable Junk Bonds Creep Towards Catastrophic Levels
Breadth Improves as Small Caps Rebound, but for How Long?
META, Google, AT&T Lead Stock Losses
Interest Rates Pull Back. Time to Sell Treasury Bonds?
Gold & Silver Threaten 52-Week Lows, as Dollar Stabilizes
Crypto Review: Bitcoin, Solana & Ethereum Direction
Keep Reading!
Stocks Covered In Members Only Video:
Market Breadth, SPY, DIA, QQQ, IWM, Magnificent 7, Equal Weight SPX, Materials, Financials, Retail, Hong Kong, Australia, Europe, Mexico, United Kingdom, Switzerland, Malaysia, Spain
Amazon, Bank of America, Caterpillar, Costco, Salesforce, Cisco, FedEx, General Motors, Intel, JPM, Kraft Heinz, Nvidia, Walmart
Brown Forman, James Hardie Industries, NovoCure, Newell Brands, Rexford Industrial Realty, Baxter, Bath & Body Works, Brandywine Realty, Repay Holdings
Follow for daily insights and technical analysis:
🌐 Website: https://www.masterchartstrading.com
🐦 X (Twitter): https://twitter.com/Master_Charts
💬 StockTwits: https://stocktwits.com/Mastercharts
📘 Facebook: https://www.facebook.com/MasterChartsTrading
🎥 YouTube: www.youtube.com/c/MasterChartsTradingcom
📊 TradingView: https://www.tradingview.com/u/mastercharts/#published-scripts
#StockMarket #JunkBonds #InterestRates #Gold #TreasuryBonds #MarketOutlook #Trading
$SPY $QQQ $JNK $HYG $IWM $XLC $META $GOOGL $T $IEF $TLT $GLD $SLV $GDX
Transcript available here
youtu.be/KD9E_YyQ5F4
Click Here for the Latest Market Recap!
Vulnerable Junk Bonds Creep Towards Catastrophic Levels
Breadth Improves as Small Caps Rebound, but for How Long?
META, Google, AT&T Lead Stock Losses
Interest Rates Pull Back. Time to Sell Treasury Bonds?
Gold & Silver Threaten 52-Week Lows, as Dollar Stabilizes
Crypto Review: Bitcoin, Solana & Ethereum Direction
Keep Reading!
Stocks Covered In Members Only Video:
Market Breadth, SPY, DIA, QQQ, IWM, Magnificent 7, Equal Weight SPX, Materials, Financials, Retail, Hong Kong, Australia, Europe, Mexico, United Kingdom, Switzerland, Malaysia, Spain
Amazon, Bank of America, Caterpillar, Costco, Salesforce, Cisco, FedEx, General Motors, Intel, JPM, Kraft Heinz, Nvidia, Walmart
Brown Forman, James Hardie Industries, NovoCure, Newell Brands, Rexford Industrial Realty, Baxter, Bath & Body Works, Brandywine Realty, Repay Holdings
Follow for daily insights and technical analysis:
🌐 Website: https://www.masterchartstrading.com
🐦 X (Twitter): https://twitter.com/Master_Charts
💬 StockTwits: https://stocktwits.com/Mastercharts
📘 Facebook: https://www.facebook.com/MasterChartsTrading
🎥 YouTube: www.youtube.com/c/MasterChartsTradingcom
📊 TradingView: https://www.tradingview.com/u/mastercharts/#published-scripts
#StockMarket #JunkBonds #InterestRates #Gold #TreasuryBonds #MarketOutlook #Trading
$SPY $QQQ $JNK $HYG $IWM $XLC $META $GOOGL $T $IEF $TLT $GLD $SLV $GDX
Transcript available here
Vulnerable junk bonds creep towards catastrophic levels. Here I mean every word of it. If we get to the level that I will describe later in this video, the entire premise of the stock market, the bull market for stocks, will be questioned.
Last week, Meta, Google, and AT&T, all big members of the communication services sector, led the losses for stocks. I'll show you how this is affecting market breadth because we can see the small caps are rebounding.
Larger caps suddenly are pulling back, so overall market was more or less flat, but some sectors pulled back pretty significantly.
Interest rates also pulled back. Is it time to sell Treasury bonds? And I'll show you that bonds currently are at the exact level where selling them would make technical sense. However, we'll also look a little bit at the fundamental perspective and see if it's a good idea to do so.
Gold and silver are very close to 52-week lows. I've been saying this, that dollar is in an uptrend. It stabilized around the critical important support level, and I will show you the possible direction of gold and the dollar.
And we'll finish up with crypto as Bitcoin, Solana, and Ethereum continue with the pullback, but I think the bigger direction is up.
All this and more in today's edition of MasterChartsTrading.com market recap for October 24th, 2020.
As always, please hit the like button. I see lots of views, not a lot of likes. If every one of you at least hits the like button, that would boost my videos significantly. More people will see them. This is a useful analysis.
Share my video, comment, make a comment if you have questions. If you have just good feelings, put a heart or a thumbs up in the video comments section again. This is what keeps the channel going.
Thank you for all the likes, comments, shares I've been getting.
If you are a subscriber, stay tuned. We'll be covering in a separate video quite a bit of various ETFs. I will also touch upon market breadth, some of the large cap stocks, and some of the more speculative securities, but not just. Interestingly enough, there's realtors now showing up on the scan.
Let's get started.
S&P 500 basically traded more or less sideways since about August of this year.
And this is comparable to high-yield bonds. So notice that in August of this year, high-yield bonds hit records.
Stocks also hit records around the same time, around August, but again stocks traded more or less sideways while the high-yield bonds, I mean, it's visible to the naked eye. You don't have to be a stock market analyst, right?
You can see high-yield bonds hit records on the 27th of August. This is ticker symbol JNK. And fell back.
As low as October 1st we had a low, and notice exactly where that low came in, right around the red line.
Tried to bottom around that area but bounced. We sort of went under it actually, so right now it's still very much up in the air which way things will go right now.
Technically speaking, where high-yield bonds are in a caution phase, and I am just that, more cautious about buying stocks.
In general, I'll explain why stocks and junk bonds mattered so much.
So here it is.
High-yield bonds on a weekly time frame.
So down below here is one of my favorite indicators, correlation coefficient, how much does one asset move the same or different than the other assets.
So this is high-yield bonds, JNK, correlating to the S&P 500.
Generally speaking, very high correlation. Occasionally we get in negative correlation as in, for example, where I'm hovering in December 2021.
And then again here in 2018, so right now we're having something similar. We're having a negative correlation.
What's happening here?
So this is what I'm trying to explain. Whereas S&P 500 have recently hit records, in fact, that's the new record right there on 6 October, high-yield bonds are doing something completely different. They're moving lower.
And now I said catastrophic level. So what level would be catastrophic for high-yield bonds and very much possibly the entire stock market?
And it is this line here. I call it the yellow line.
So red line here means caution. I know it's weird. It probably should be reversed, but I just did it that way. I'm just not going to bother with it anymore.
So right now here we are around caution phase, but if we drop even a little bit, and I already said we're about a percentage point away from an outright bear market for high-yield bonds.
This is 1.21 percent so far high-yield bonds moved from the recent highs with recent prices 2.7 percent, so they only need to move a third as much to get into an outright bear market.
And again this is another critical, this is a catastrophic level.
The reason being again is because very often when high-yield bonds go into bear market, then S&P 500 could just very easily follow.
So we can look at, for example, 2000 when you won.
Anyways, I don't want to bother with the historical records right now, but yes, definitely this is important.
Important level to watch, so about a percentage point away for high-yield bonds. We will obviously be watching it very carefully.
And interestingly enough, the small caps also were underperforming since August.
You can see August. Fortunes was the last time small caps made the record.
Now we're again trying to bottom around this support resistance line.
As a result of that, we can see how does the market breadth behave and how is it calculated and how does it help us or not?
Notice on this chart this is percent of stocks above a 200-day moving average, so it was rising into August, absolutely normally.
You know, S&P 500 was rising into August.
You can see S&P 500 down on the bottom here.
We were right into August, we peaked around 75% in mid-August and ever since into October we declined very sharply.
But notice again this S&P 500 actually barely budged.
So what does it mean?
This means that we have what's called the bearish divergence.
We have a few stocks that were supporting the market and they were very large cap like Meta, you know, Facebook, the Magnificent Seven.
So here it is. Magnificent Seven, Guinness is on seven, just hit the fresh record in October, mid-October, you see.
But small caps were doing something different.
They were dropping together with high-yield bonds as I was just showing to you.
Okay. So we're seeing those divergences.
We're seeing bearish divergence in high-yield bonds. We're seeing a bearish divergence in small caps.
It is also quite highly visible on the market breadth chart, whereas S&P 500 is trading sideways.
Breadth decreased since October. Breadth actually stabilized and moved higher pretty significantly, so that means a lot of small caps at least didn't fall.
And indeed, that is true. We can see that, and every small cap stock didn't really fall since like late September into mid-October and some actually rallied.
Okay, so right this instant what's happening is we're seeing this selling just in the last few days really since, you know, October 13th we're selling.
We've seen a lot of selling in the high, you know, super duper huge caps Google, Apple, Amazon, Nvidia, Tesla, etc.
Even just in the last since October 13th and the last two weeks this lost, you know, almost seven percent.
Small caps since October, small caps since October 13th, you know, I'm sorry, since September 30th, barely did anything, just traded sideways.
So like I just showed you, this is what this chart shows basically.
We're stabilizing the breadth.
So small caps are stabilizing, now the large caps, the mega caps, are faltering.
Okay, so again we're trading sideways on average for S&P 500.
Now, within S&P 500, there are sectors.
And the worst performance sector potentially besides utilities, utilities actually bounced recently, but this is a worst performance sector.
Currently it's called Communication Services XLC.
Within it there are two companies that absolutely dominate the entire ETF in this Meta and two different Google shares, so basically they are 50% of this ETF.
And so we have an AT&T.
We have well over 50% of the ETF that is actually pulling this important communication services sector lower.
And so we can see there is Meta just basically collapsing over the last few days, and Google also very much pulling back.
So this is Google, and it also very interestingly, you can see on this chart the way the indicators have caught up, so I keep pointing this type of pattern.
So notice that our distance between the yellow and the green line has narrowed significantly.
So it's now 94 points.
But let's just say even in July of this year that same distance was 143 points, so narrowing trading range, and look what's happening.
We're seeing stock move closer towards this red support resistance line, and as I just showed, this red support resistance line indicates caution.
And so if Google continues, it will get to the catastrophic levels, the yellow line, which is not that far away as well.
For Google to do that, it's only another 10% move. Not that much for a technology stock.
So this is what we're seeing in the communication services sector.
Here's AT&T also pretty much collapsed and basically down to that catastrophic level, basically a bear phase kind of level.
So overall my assessment of current stock market is that we are trading sideways.
Because of the small rebound in small caps.
If small caps hold and rally, we might pull out of this still, but if suddenly small caps also decide to falter then I think, you know, for Magnificent 7 to continue lower wouldn't take a lot of effort.
You know, we're seeing pretty much significant selling there as well.
So we're basically looking towards small caps to see if they hold.
We're looking to junk to make sure that they don't drop further.
If junk drops towards this critical yellow line level, another 1% from today's prices, I think the entire bull market narrative might be in danger.
Let me know what you think, make a comment.
A few weeks ago, I put in this, was called a ghost feed.
I put it in on Friday when I was recording the video, so right there on 27, 25th of September.
And I almost nailed it. I think I already showed it.
So we have this Treasury bonds, so seven to ten, you know, like intermediate treasury bonds.
They hit a low in early October and pretty much bounced.
As I said, by extension, the interest rates will come down.
Into November, they were doing exactly that.
I put in the same ghost field right there same date and we can see we're coming down.
So right now the small caps, I'm sorry, the IEF, the 7 to 10 year treasury bonds, they're exactly where they should be sold.
This is exactly the area where selling could come in because of the important level, this red support resistance line.
Notice that two days in a row we're kind of trading around that area.
I think the bears are trying to make a stand.
There is still a little bit of a gap that remains unfilled between the 9th and 10th of July.
So I think a little bit higher, that's why I put in this ghost field into November.
After the elections I think we might still see a slight pop higher for the bonds, but then, you know, unless we see just quick turnaround and a jump above the blue support resistance line, I think sellers will come in and start selling.
So we're watching.
The next few weeks are truly critical.
I keep saying that word because of the elections in America that are coming up.
And so we're watching for any market moving news such as resumption of hostilities in the Middle East, which is not out of the question.
Yeah, let's look at dollar and gold as well, and silver as here is dollar on the daily time frame.
So dollar is in an uptrend.
I kept saying this since this breakout right there back in March of this year.
So we have a breakout above the blue line, no close below the red line here in April, so we would have determined that uptrend continues.
We made a big run higher recently, a small pullback towards the green line, so potentially we might find some support here.
It's very possible.
It's a very strong security looking like this advance was very sharp, so this pullback and then maybe another leg higher is quite likely.
And I think gold is already reacting to that.
Gold XAU divided by USD, remember the bottom part of this equation is a security that's getting bigger, so it's pulling this currency pair lower right there.
That was the entry since June of this year, although I was questioning the uptrend already back in January.
Gold has been in a downtrend in the bear market.
So right now we're seeing, we saw a sell signal where I'm hovering back in September of this year and then new lows.
We're very close to 52-week lows, super close, so if we make fresh 52-week low, you know, that's not a good sign and most likely that would imply dollar will continue higher.
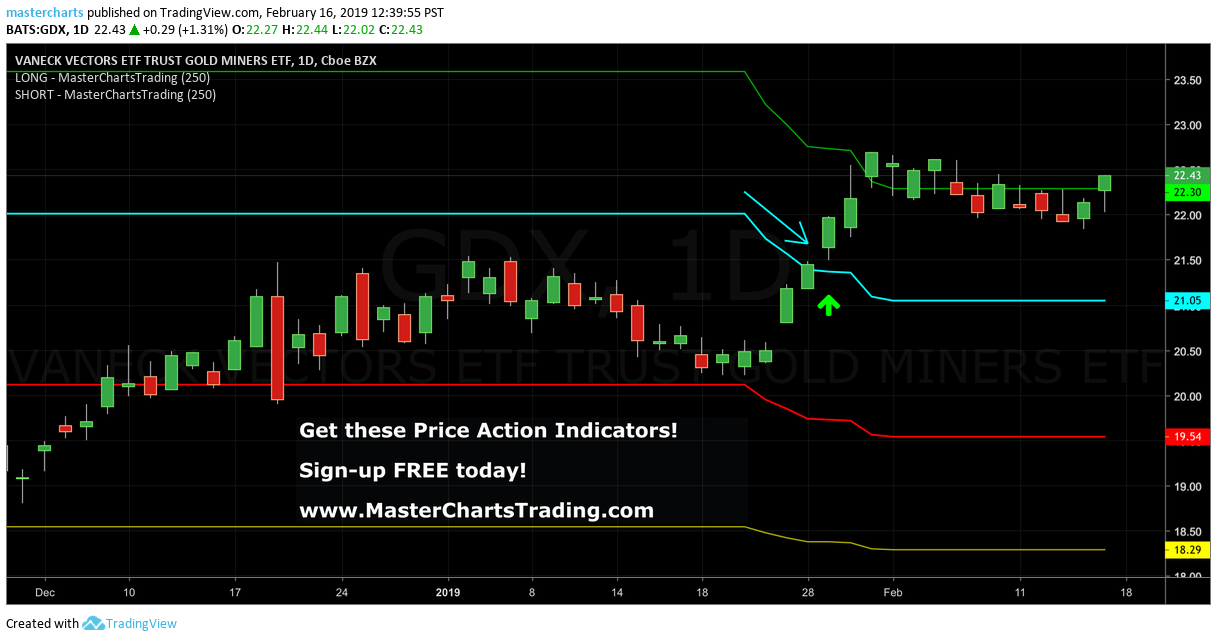
Gold miners are doing the same thing, although they bounced really powerfully from like 70 bucks all the way to 101.5, so like over 30% move, you know, pretty significant.
But I didn't want to buy them and now we're, you know, we seem to be in downtrend again, so I would definitely avoid the gold miners as well.
Here is silver.
So silver gave a little bit more clear signs, or somewhat clear more clear signs, like for example here was the rejection back in May, enter into a bear market in June, and a couple of opportunities to sell silver short.
We're again approaching 52-week low.
So whatever is happening, it was the, you know, silver and gold being an inflation hedge doesn't seem to be working, at least right this instant.
Maybe in the long term, yes, but the best hedge against inflation is still the stock market, not gold or silver.
Let's finish up with the crypto analysis.
Here is Bitcoin.
So Bitcoin has broken out into a new uptrend right there where I'm hovering on 21st of September.
Previously it was in a downtrend.
There's the downtrend that started back in November of last year and several opportunities to sell it short.
And a breakout and finally a new bull market where I'm hovering 24th of September.
Having said that, we may not necessarily go immediately higher.
We could still pull back.
In fact, two other currencies that I monitor is Ethereum.
So same thing, we saw a breakout, now a pullback, and we pull back exactly to the blue support resistance line, attempting to find support.
Solana is doing exactly the same thing, attempting to find support the blue line.
If it does, it probably would be a good sign that Bitcoin will just continue higher and no more pullback for Bitcoin.
Other than that, I think Bitcoin is on an uptrend, so I would own some and I do own some myself.
That's it for this week's recap.
Head over to MasterChartsTrading.com. Click on sign up.
Sign up for one of the products.
So again, I have this trading indicators, and good news, I got the news from the TradingView.com.
This TradingView.com is where you can get my indicators.
They will soon be for sale there as well directly on their website.
But for now, all you gotta do is sign up for free on TradingView account.
And then come over to my site, Master Charts Trading, and purchase the trading indicators both on monthly and yearly plans.
Yearly plans get two months free basically compared to the monthly plans.
Newsletter, I send out daily alerts and weekly members only videos about the various securities we trade.
And the best deal of course is to get both trading indicators and newsletters.
And the prices you can see on this chart here in front of you.
Again, thank you very much for watching.
Don't forget to hit the like button, share this video, put a heart or a thumbs up in the comment section.
Thank you for watching.
Have another great trading week.
Last week, Meta, Google, and AT&T, all big members of the communication services sector, led the losses for stocks. I'll show you how this is affecting market breadth because we can see the small caps are rebounding.
Larger caps suddenly are pulling back, so overall market was more or less flat, but some sectors pulled back pretty significantly.
Interest rates also pulled back. Is it time to sell Treasury bonds? And I'll show you that bonds currently are at the exact level where selling them would make technical sense. However, we'll also look a little bit at the fundamental perspective and see if it's a good idea to do so.
Gold and silver are very close to 52-week lows. I've been saying this, that dollar is in an uptrend. It stabilized around the critical important support level, and I will show you the possible direction of gold and the dollar.
And we'll finish up with crypto as Bitcoin, Solana, and Ethereum continue with the pullback, but I think the bigger direction is up.
All this and more in today's edition of MasterChartsTrading.com market recap for October 24th, 2020.
As always, please hit the like button. I see lots of views, not a lot of likes. If every one of you at least hits the like button, that would boost my videos significantly. More people will see them. This is a useful analysis.
Share my video, comment, make a comment if you have questions. If you have just good feelings, put a heart or a thumbs up in the video comments section again. This is what keeps the channel going.
Thank you for all the likes, comments, shares I've been getting.
If you are a subscriber, stay tuned. We'll be covering in a separate video quite a bit of various ETFs. I will also touch upon market breadth, some of the large cap stocks, and some of the more speculative securities, but not just. Interestingly enough, there's realtors now showing up on the scan.
Let's get started.
S&P 500 basically traded more or less sideways since about August of this year.
And this is comparable to high-yield bonds. So notice that in August of this year, high-yield bonds hit records.
Stocks also hit records around the same time, around August, but again stocks traded more or less sideways while the high-yield bonds, I mean, it's visible to the naked eye. You don't have to be a stock market analyst, right?
You can see high-yield bonds hit records on the 27th of August. This is ticker symbol JNK. And fell back.
As low as October 1st we had a low, and notice exactly where that low came in, right around the red line.
Tried to bottom around that area but bounced. We sort of went under it actually, so right now it's still very much up in the air which way things will go right now.
Technically speaking, where high-yield bonds are in a caution phase, and I am just that, more cautious about buying stocks.
In general, I'll explain why stocks and junk bonds mattered so much.
So here it is.
High-yield bonds on a weekly time frame.
So down below here is one of my favorite indicators, correlation coefficient, how much does one asset move the same or different than the other assets.
So this is high-yield bonds, JNK, correlating to the S&P 500.
Generally speaking, very high correlation. Occasionally we get in negative correlation as in, for example, where I'm hovering in December 2021.
And then again here in 2018, so right now we're having something similar. We're having a negative correlation.
What's happening here?
So this is what I'm trying to explain. Whereas S&P 500 have recently hit records, in fact, that's the new record right there on 6 October, high-yield bonds are doing something completely different. They're moving lower.
And now I said catastrophic level. So what level would be catastrophic for high-yield bonds and very much possibly the entire stock market?
And it is this line here. I call it the yellow line.
So red line here means caution. I know it's weird. It probably should be reversed, but I just did it that way. I'm just not going to bother with it anymore.
So right now here we are around caution phase, but if we drop even a little bit, and I already said we're about a percentage point away from an outright bear market for high-yield bonds.
This is 1.21 percent so far high-yield bonds moved from the recent highs with recent prices 2.7 percent, so they only need to move a third as much to get into an outright bear market.
And again this is another critical, this is a catastrophic level.
The reason being again is because very often when high-yield bonds go into bear market, then S&P 500 could just very easily follow.
So we can look at, for example, 2000 when you won.
Anyways, I don't want to bother with the historical records right now, but yes, definitely this is important.
Important level to watch, so about a percentage point away for high-yield bonds. We will obviously be watching it very carefully.
And interestingly enough, the small caps also were underperforming since August.
You can see August. Fortunes was the last time small caps made the record.
Now we're again trying to bottom around this support resistance line.
As a result of that, we can see how does the market breadth behave and how is it calculated and how does it help us or not?
Notice on this chart this is percent of stocks above a 200-day moving average, so it was rising into August, absolutely normally.
You know, S&P 500 was rising into August.
You can see S&P 500 down on the bottom here.
We were right into August, we peaked around 75% in mid-August and ever since into October we declined very sharply.
But notice again this S&P 500 actually barely budged.
So what does it mean?
This means that we have what's called the bearish divergence.
We have a few stocks that were supporting the market and they were very large cap like Meta, you know, Facebook, the Magnificent Seven.
So here it is. Magnificent Seven, Guinness is on seven, just hit the fresh record in October, mid-October, you see.
But small caps were doing something different.
They were dropping together with high-yield bonds as I was just showing to you.
Okay. So we're seeing those divergences.
We're seeing bearish divergence in high-yield bonds. We're seeing a bearish divergence in small caps.
It is also quite highly visible on the market breadth chart, whereas S&P 500 is trading sideways.
Breadth decreased since October. Breadth actually stabilized and moved higher pretty significantly, so that means a lot of small caps at least didn't fall.
And indeed, that is true. We can see that, and every small cap stock didn't really fall since like late September into mid-October and some actually rallied.
Okay, so right this instant what's happening is we're seeing this selling just in the last few days really since, you know, October 13th we're selling.
We've seen a lot of selling in the high, you know, super duper huge caps Google, Apple, Amazon, Nvidia, Tesla, etc.
Even just in the last since October 13th and the last two weeks this lost, you know, almost seven percent.
Small caps since October, small caps since October 13th, you know, I'm sorry, since September 30th, barely did anything, just traded sideways.
So like I just showed you, this is what this chart shows basically.
We're stabilizing the breadth.
So small caps are stabilizing, now the large caps, the mega caps, are faltering.
Okay, so again we're trading sideways on average for S&P 500.
Now, within S&P 500, there are sectors.
And the worst performance sector potentially besides utilities, utilities actually bounced recently, but this is a worst performance sector.
Currently it's called Communication Services XLC.
Within it there are two companies that absolutely dominate the entire ETF in this Meta and two different Google shares, so basically they are 50% of this ETF.
And so we have an AT&T.
We have well over 50% of the ETF that is actually pulling this important communication services sector lower.
And so we can see there is Meta just basically collapsing over the last few days, and Google also very much pulling back.
So this is Google, and it also very interestingly, you can see on this chart the way the indicators have caught up, so I keep pointing this type of pattern.
So notice that our distance between the yellow and the green line has narrowed significantly.
So it's now 94 points.
But let's just say even in July of this year that same distance was 143 points, so narrowing trading range, and look what's happening.
We're seeing stock move closer towards this red support resistance line, and as I just showed, this red support resistance line indicates caution.
And so if Google continues, it will get to the catastrophic levels, the yellow line, which is not that far away as well.
For Google to do that, it's only another 10% move. Not that much for a technology stock.
So this is what we're seeing in the communication services sector.
Here's AT&T also pretty much collapsed and basically down to that catastrophic level, basically a bear phase kind of level.
So overall my assessment of current stock market is that we are trading sideways.
Because of the small rebound in small caps.
If small caps hold and rally, we might pull out of this still, but if suddenly small caps also decide to falter then I think, you know, for Magnificent 7 to continue lower wouldn't take a lot of effort.
You know, we're seeing pretty much significant selling there as well.
So we're basically looking towards small caps to see if they hold.
We're looking to junk to make sure that they don't drop further.
If junk drops towards this critical yellow line level, another 1% from today's prices, I think the entire bull market narrative might be in danger.
Let me know what you think, make a comment.
A few weeks ago, I put in this, was called a ghost feed.
I put it in on Friday when I was recording the video, so right there on 27, 25th of September.
And I almost nailed it. I think I already showed it.
So we have this Treasury bonds, so seven to ten, you know, like intermediate treasury bonds.
They hit a low in early October and pretty much bounced.
As I said, by extension, the interest rates will come down.
Into November, they were doing exactly that.
I put in the same ghost field right there same date and we can see we're coming down.
So right now the small caps, I'm sorry, the IEF, the 7 to 10 year treasury bonds, they're exactly where they should be sold.
This is exactly the area where selling could come in because of the important level, this red support resistance line.
Notice that two days in a row we're kind of trading around that area.
I think the bears are trying to make a stand.
There is still a little bit of a gap that remains unfilled between the 9th and 10th of July.
So I think a little bit higher, that's why I put in this ghost field into November.
After the elections I think we might still see a slight pop higher for the bonds, but then, you know, unless we see just quick turnaround and a jump above the blue support resistance line, I think sellers will come in and start selling.
So we're watching.
The next few weeks are truly critical.
I keep saying that word because of the elections in America that are coming up.
And so we're watching for any market moving news such as resumption of hostilities in the Middle East, which is not out of the question.
Yeah, let's look at dollar and gold as well, and silver as here is dollar on the daily time frame.
So dollar is in an uptrend.
I kept saying this since this breakout right there back in March of this year.
So we have a breakout above the blue line, no close below the red line here in April, so we would have determined that uptrend continues.
We made a big run higher recently, a small pullback towards the green line, so potentially we might find some support here.
It's very possible.
It's a very strong security looking like this advance was very sharp, so this pullback and then maybe another leg higher is quite likely.
And I think gold is already reacting to that.
Gold XAU divided by USD, remember the bottom part of this equation is a security that's getting bigger, so it's pulling this currency pair lower right there.
That was the entry since June of this year, although I was questioning the uptrend already back in January.
Gold has been in a downtrend in the bear market.
So right now we're seeing, we saw a sell signal where I'm hovering back in September of this year and then new lows.
We're very close to 52-week lows, super close, so if we make fresh 52-week low, you know, that's not a good sign and most likely that would imply dollar will continue higher.
Gold miners are doing the same thing, although they bounced really powerfully from like 70 bucks all the way to 101.5, so like over 30% move, you know, pretty significant.
But I didn't want to buy them and now we're, you know, we seem to be in downtrend again, so I would definitely avoid the gold miners as well.
Here is silver.
So silver gave a little bit more clear signs, or somewhat clear more clear signs, like for example here was the rejection back in May, enter into a bear market in June, and a couple of opportunities to sell silver short.
We're again approaching 52-week low.
So whatever is happening, it was the, you know, silver and gold being an inflation hedge doesn't seem to be working, at least right this instant.
Maybe in the long term, yes, but the best hedge against inflation is still the stock market, not gold or silver.
Let's finish up with the crypto analysis.
Here is Bitcoin.
So Bitcoin has broken out into a new uptrend right there where I'm hovering on 21st of September.
Previously it was in a downtrend.
There's the downtrend that started back in November of last year and several opportunities to sell it short.
And a breakout and finally a new bull market where I'm hovering 24th of September.
Having said that, we may not necessarily go immediately higher.
We could still pull back.
In fact, two other currencies that I monitor is Ethereum.
So same thing, we saw a breakout, now a pullback, and we pull back exactly to the blue support resistance line, attempting to find support.
Solana is doing exactly the same thing, attempting to find support the blue line.
If it does, it probably would be a good sign that Bitcoin will just continue higher and no more pullback for Bitcoin.
Other than that, I think Bitcoin is on an uptrend, so I would own some and I do own some myself.
That's it for this week's recap.
Head over to MasterChartsTrading.com. Click on sign up.
Sign up for one of the products.
So again, I have this trading indicators, and good news, I got the news from the TradingView.com.
This TradingView.com is where you can get my indicators.
They will soon be for sale there as well directly on their website.
But for now, all you gotta do is sign up for free on TradingView account.
And then come over to my site, Master Charts Trading, and purchase the trading indicators both on monthly and yearly plans.
Yearly plans get two months free basically compared to the monthly plans.
Newsletter, I send out daily alerts and weekly members only videos about the various securities we trade.
And the best deal of course is to get both trading indicators and newsletters.
And the prices you can see on this chart here in front of you.
Again, thank you very much for watching.
Don't forget to hit the like button, share this video, put a heart or a thumbs up in the comment section.
Thank you for watching.
Have another great trading week.




 RSS Feed