(00:00) Securities Covered
(00:30) Sign-Up Here: https://www.masterchartstrading.com/store/c1/Featured_Products.htm
(02:15) Stock Futures Make a Stand at Key Support
(05:20) Bearish Divergence in Transports Raises Red Flags for Stock Bulls
(08:08) Bitcoin Appears Poised for a Bullish Breakout
(12:27) Japanese Yen Leads Renewed Currency Rally Against the Dollar
(15:37) Gold Battles to Hold Support in Bearish Territory
Stocks Covered In Members Only Video:
Market Breadth, SPY, DIA, QQQ, IWM, RSP, Magnificent 7, Discretionary, Real Estate, Industrials, Semiconductors, Retail, Aggregate Bonds, Treasury Bonds, China
Amazon, Caterpillar, Disney, Google, Honeywell, Intel, 3M, UPS
Beam Therapeutics, Cabaletta Bio, 3D System, Estee Lauder, Pulmonx Corp, NovoCure, Skyworks
Follow for daily insights and technical analysis:
🌐 Website: https://www.masterchartstrading.com
🐦 X (Twitter): https://twitter.com/Master_Charts
💬 StockTwits: https://stocktwits.com/Mastercharts
📘 Facebook: https://www.facebook.com/MasterChartsTrading
🎥 YouTube: www.youtube.com/c/MasterChartsTradingcom
📊 TradingView: https://www.tradingview.com/u/mastercharts/#published-scripts
#Trading #Bitcoin #Gold #StockMarket #StockTrading #JapaneseYen #Dollar #MarketAnalysis #TechnicalAnalysis #BTC
We’re currently looking at the Dow Jones, but let me go back to the S&P 500 for a second before we get to the Dow.
Looking at the S&P 500, we’re basically next to record highs. The records are just another 1% away.
The action is very bullish. It can be better visualized on the four-hour chart, so let me show you that.
This is a four-hour chart of the S&P 500 futures.
Following the recent surge around the end of July and into August, we gapped higher. There’s still a small unfilled gap here from around August 26.
We surged, made new records, and have been trading sideways. We then pulled back to what I call logical support levels.
Now that my new 8.0 indicators are out, you can turn these blue arrows on or off. Every time we touch or move below the blue support/resistance line and then close back above it, we can get a potential buy signal.
For example, on this four-hour futures chart, you can see those arrows here. We made a low below the blue line and then closed above it. That’s a buy signal.
This is a trade you could have entered in early September. The unfilled gap still remains below us, but at this point we could simply make new records. It looks possible.
There is some resistance from the August 28 candle, but it’s not that significant, and I think a breakout to new records is quite likely.
Let’s look at some of the things that trouble me, although not dramatically yet.
We’re looking at the Dow Jones Industrial Average. It’s very similar to what I just showed you for the S&P 500. We surged, made a new record, and have since been trading sideways to slightly lower.
The problem is this chart.
This is transportation, symbol IYT. You can see that while the Dow Jones has been trading sideways, transports actually dropped significantly, especially from August 26 into September 1.
According to Dow Theory, the Dow Jones Industrial Average and the transportation sector should generally confirm one another.
In this case, however, transports have suddenly moved significantly lower. I’m not sure yet whether they’re going to lead the broader market lower or whether they’ll recover quickly.
I looked at the components of IYT, and most of the transportation stocks are moving to the downside.
What does this mean in terms of Dow Theory?
It’s not a huge warning yet. The main thing I can say is that the Dow Jones is more or less trading sideways while transports are moving down.
Theoretically, transports could be acting as a leading indicator. In other words, transports could lead the Dow Jones lower. By extension, if the Dow Jones drops, the S&P 500 would likely drop as well.
Could that happen? It’s possible.
Could the transportation sector recover instead? That’s very possible as well.
Let’s watch this into next week and see if we get any additional clues about the direction of the market.
The big news, I think, is Bitcoin.
Bitcoin has moved sharply higher. If you listened to my previous videos, I’ve been saying that since around June, when Bitcoin stopped making significant new lows, there was a strong chance of a rally.
We made a marginal new low in late June or early July, but after that we stopped making new lows.
I was saying there was a very strong chance of a Bitcoin rally because of the way the indicators were behaving.
You can see how the indicator lines were curving down and getting closer together. They became very close around July.
Usually, when the lines get closer together, it takes less energy for price to move from one level to another.
The bullish level is above the blue line, while below the yellow line we were clearly in a bear market.
Bitcoin did rally, and now we’re almost at the blue support/resistance line. We’re only about 4% away from what I would consider a new bull market in Bitcoin.
A bull market implies higher highs and higher lows.
Let me show you what a previous Bitcoin bull market looked like.
This is a relatively recent Bitcoin bull market, and it’s a very similar situation.
Notice that Bitcoin was below the yellow line in January 2023. It first moved above the red line and then broke out above the blue line.
That was the beginning of a new bull market for Bitcoin in early 2023.
From there, we started making higher highs and higher lows.
Notice again those buy arrows, where you could potentially look for buying opportunities. They’re now labeled using my new indicators.
You can get those indicators through MasterChartsTrading.com for use on TradingView.
Bitcoin remained in a very nice bull market for a long time, beginning in 2023 and continuing until November 2025, when it finally reversed back into a bear market.
That bear market proved pretty nasty because Bitcoin dropped from around $94,000 to as low as approximately $60,000.
If you were selling it short, there were opportunities there. I don’t normally sell short. Sometimes I do, but very rarely.
Now we’re seeing a similar situation again, where Bitcoin is approaching the blue support/resistance line.
A breakout above that blue line would mean a new bull market for Bitcoin according to this system.
How high can we go?
The first obvious area would be a return toward $100,000. That’s not an especially large move for Bitcoin. Beyond that, the sky is the limit.
In the past, Bitcoin bull-market runs have been tremendous—sometimes doubling, tripling, or even quadrupling.
I would consider going long Bitcoin once it breaks above approximately $82,000, around this blue support/resistance line.
The exact level on this chart is currently $82,871. This is Bitcoin versus the U.S. dollar on Coinbase.
Bitcoin looks bullish. It looks like it wants to go higher. I would be strongly considering a long position once we break above that blue line.
Let’s switch gears.
We’re going to look at USD/JPY: the U.S. dollar versus the Japanese yen.
Until very recently, the U.S. dollar was clearly winning. We reached approximately a multi-decade high for the U.S. dollar against the Japanese yen. By extension, that represented a multi-decade low for the Japanese yen against the dollar.
Here you can see the intervention that occurred around July 30 and 31.
USD/JPY dropped significantly to the blue support/resistance line, but then recovered.
I’ve been saying that moves this sharp generally don’t happen in a vacuum and simply disappear.
What I think may be happening now is that we could duplicate a similar move to the downside.
The previous decline was approximately 4%. Something similar could unfold in the near term as long as we remain below this red support/resistance line.
For currencies and Bitcoin, I use the blue and red lines as the primary markers for bullish and bearish trends. For stocks, I prefer to use the yellow line.
If this were the S&P 500, I would use the yellow line as the primary marker for determining whether we’re in a bull or bear market.
But USD/JPY is a currency pair. Once we drop below this red support/resistance line, we can consider the pair to be in a bear market.
It does look like this currency pair may be leading other dollar currency pairs lower.
We can see weakness in the U.S. Dollar Index as well.
The Dollar Index dropped pretty significantly on Thursday, September 3.
As of right now, however, I’m still thinking about the dollar as being in an uptrend because we previously closed above the blue support/resistance line and have not yet closed below the red support/resistance line.
If and when we close below the red support/resistance line, I will consider the dollar to be in a downtrend.
That hasn’t happened yet.
For now, I still consider the dollar bullish, but the way things are developing, there appears to be a potential reversal brewing, as I just showed you on the Japanese yen chart.
If we continue dropping and close below the red support/resistance line, that would confirm for me that the dollar is now in a downtrend.
Since we trade precious metals, this is important.
Again, this is gold divided by the U.S. dollar—XAU/USD—so gold is on top and the dollar is on the bottom.
The dollar, as I just showed you, appears to be weakening. If it closes below that red line, it could get significantly weaker very quickly.
If you look at this chart of gold, gold has closed below its red support/resistance line. Technically speaking, according to my system, that puts gold in a bear market.
But notice what happened next.
Gold rallied pretty strongly. We almost touched the blue support/resistance line. We got pretty close, but then closed below it again.
Right now, gold’s fate really rests on the dollar.
If the dollar continues lower, as I just showed you, gold will likely rally. Conversely, if the dollar holds support and rallies, gold will likely come under pressure.
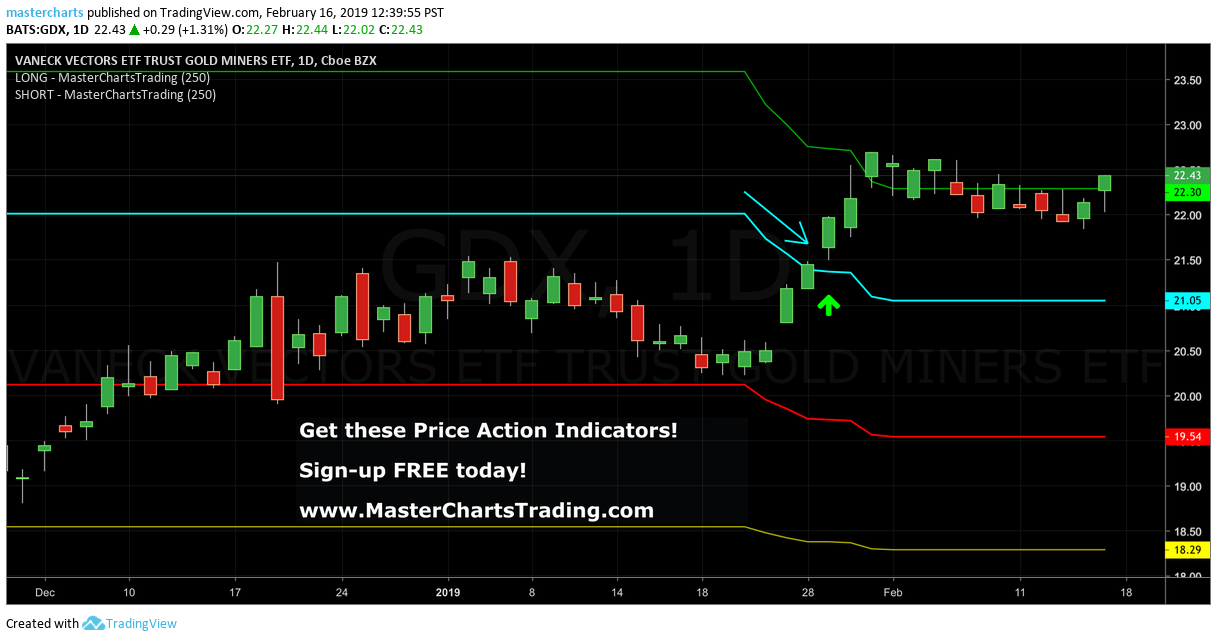
Gold miners are doing much better.
You can see gold miners here with these blue arrows, meaning we already have buy signals for the gold miners. This is GDX.
Because of the way the dollar is acting, however, I’m not 100% convinced yet about the miners or the fate of gold. I’m waiting for the dollar to resolve itself.
But if you’re impatient, I would be buying gold miners right now. GDX is currently on a buy signal, and this is a good area to consider buying it.
Silver is weaker than gold. It remains below the red line, so for now silver remains on a sell signal.
Again, however, if the dollar collapses, silver should benefit.
That’s it for this week’s recap.
Head over to MasterChartsTrading.com and click on Sign Up to choose one of the products.
I have these trading indicators—the green, blue, red, and yellow lines—which you can use to trade pretty much anything under the sun.
You can use them on TradingView.com, and you can have a free TradingView account.
Once you sign up for a TradingView account, come back to MasterChartsTrading.com and sign up for the indicators. I’ll give you access to the new 8.0 indicators.
The 8.0 indicators include projections into the future as well as signals showing potential buying areas, so there are some very useful new features.
If you subscribe to my newsletter, I send out daily alerts and weekly members-only videos.
For example, this week we’ll be covering ETFs, large-cap stocks, and various speculative securities that we’re considering buying.
The best deal is to get both the trading indicators and the newsletter. You can subscribe monthly or yearly. The yearly subscription gives you approximately two months free compared with paying monthly.
That’s it for this week’s recap.
Let me know if you have any questions. Thank you for watching, and have another great trading week.




 RSS Feed