Master Charts Trading - Stock Market Indicators & Trade Alerts
Connect To Us!
  • MasterChartsTrading
  • Blog
  • Sign-Up
  • Members
    • Elite Trading Blog
    • Stock Speculator Blog
    • Training Library >
      • Basics of Trading
      • Risk & Trading Psych
      • Trend Identification
  • Help
    • Hall of Fame
    • Social
    • About Us
    • Contact
    • FAQs
    • Disclaimer
    • Refund Policy
    • Privacy Policy
    • What We Trade
    • Newsletter samples

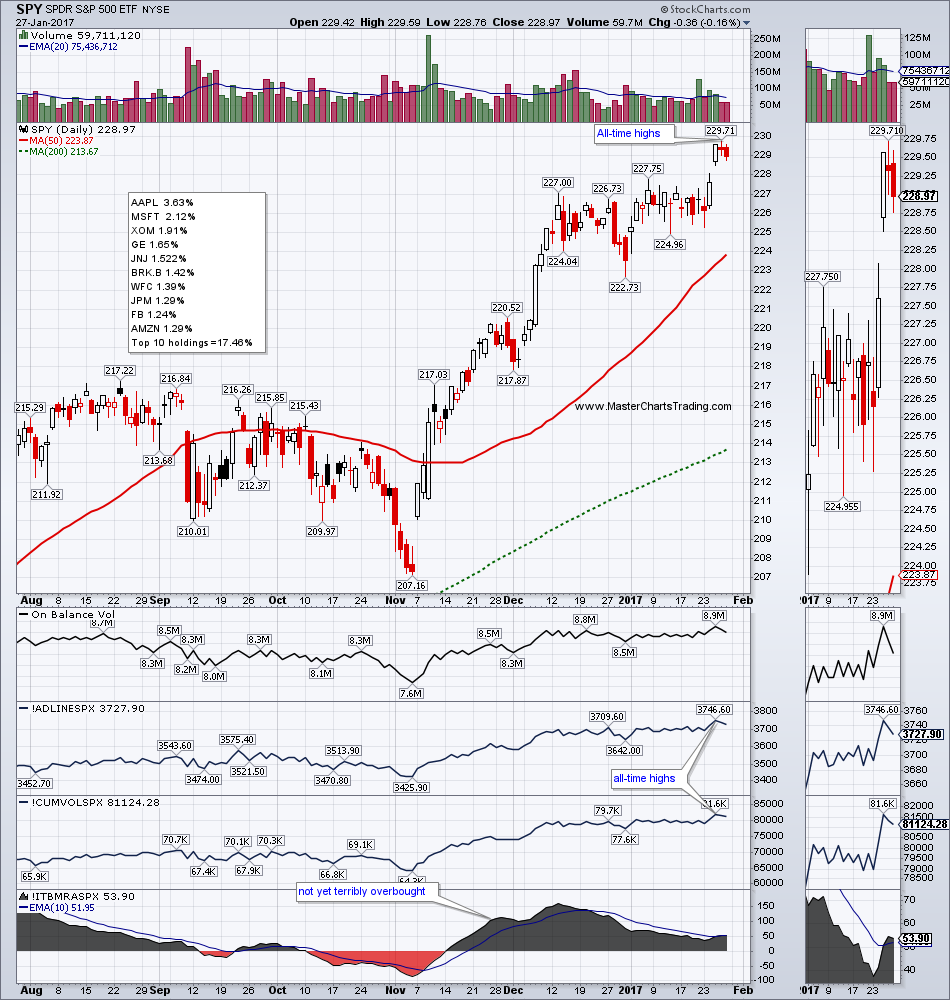
Market Recap: January 27, 2017 - SPY DIA QQQ IWM XLK XLV XLP XLF XLI XRT XLU IYR TLT LQD UUP GLD GDX USO XLE UNG

1/29/2017

1 Comment

 
​Dow Jones Industrial Average, S&P 500 and NASDAQ gap to all-time highs
Small Caps lag, but not far behind
QQQ and Technology (XLK) may be overextended after a strong move
Financials (XLF) and Industrials (XLI) at all-time highs
Consumer Cyclicals (XLY) at fresh all-time highs despite Retail ETF (XRT) lagging
Health Care (XLV), Staples (XLP), Real Estate (IYR) and Utilities (XLU) still lagging
Junk bonds (JNK, HYG) at fresh all-time highs = excellent for equities
Bonds may still have some upside left as Corporate (LQD) and Treasury (TLT) bonds attempt to bottom
Third attempt by the Dollar bulls might be the charm | USDSEK testing breakout | USDCAD testing long-term trend line | USDMXN reversing?
Gold has a possible Outside Reversal | Gold Breadth Index shows a mixed picture | GDX looking toppy
Oil in a narrow trading range with an Inside Week
NATGAS has a volatile (but positive) week

Charts mentioned in this video are located here.
View this video on YouTube
Picture
1 Comment

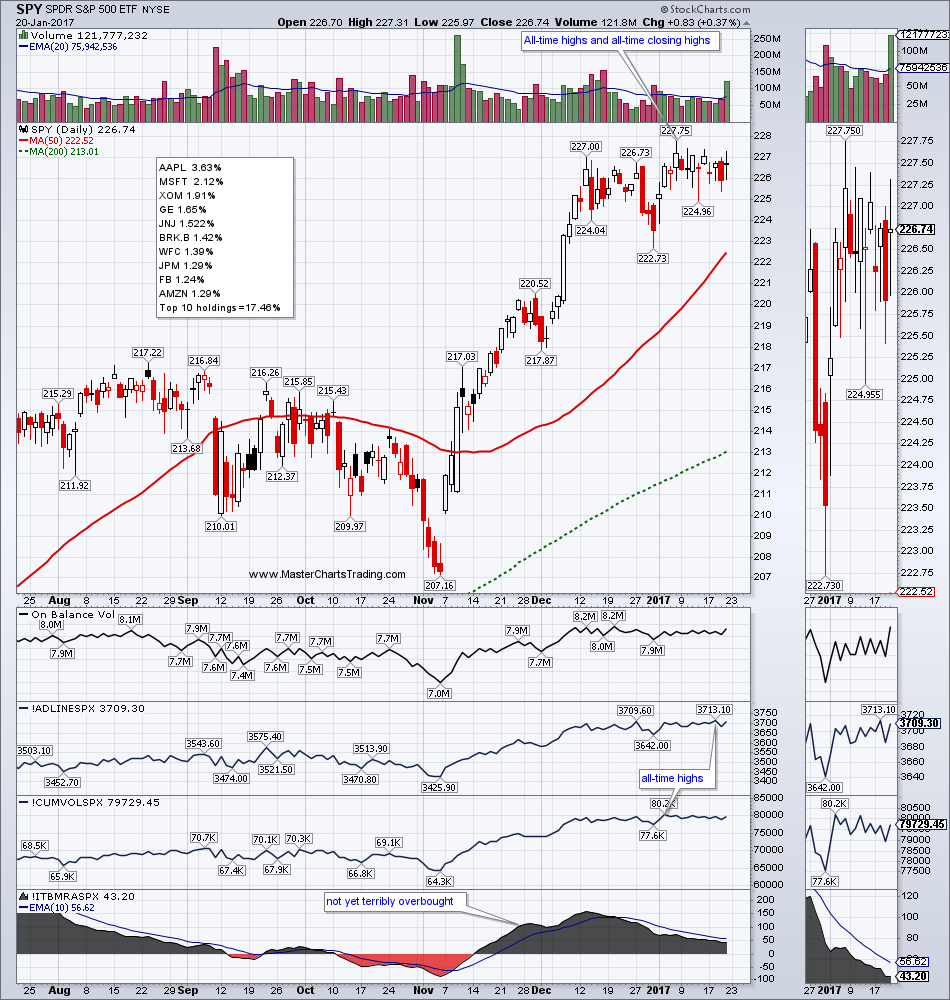
Market Recap: January 20, 2017 - SPY DIA QQQ IWM XLK XLV XLP XLF XLI IEF TLT LQD UUP GLD GDX USO UNG

1/21/2017

1 Comment

 
​Dow Jones Industrial Average and S&P 500 trading near all-time highs
 NASDAQ and Technology ETF at all-time highs
S&P 500 (SPY) with 3 Inside Weeks in a row
Small caps somewhat oversold and could easily break to fresh all-time highs
Financials (XLF) pull back slightly while Consumer Cyclicals and Industrials (XLI) push to all-time highs | Health Care (XLV) still with bullish divergence | Consumer Staples (XLP) break to 3-month high | Real Estate (IYR) and Utilities (XLU) still go nowhere, but are bullish |  Junk bonds (JNK) finally take a pause after 5 weeks of all-time highs
Questioning the downtrend in bonds (LQD, IEF, TLT)    
US Dollar slides for the 4th week in a row, but short-term oversold | Euro, Pound Sterling and Yen analyzed
Gold runs into resistance area and unable to penetrate for now | Gold miners (GDX) have minor bullish divergence
Energy SPDR (XLE) may indicate that oil has some more correcting to do
Natural gas (UNG) corrects within a bigger uptrend
Charts mentioned in this video are located here: stockcharts.com/public/1229503

View this video on YouTube
Picture
1 Comment
<<Previous
    Picture
    Picture
    Subscribe to our mailing list!
    Picture
    Picture

    Archives

    February 2023
    January 2023
    December 2022
    November 2022
    October 2022
    September 2022
    August 2022
    July 2022
    June 2022
    May 2022
    April 2022
    March 2022
    February 2022
    January 2022
    December 2021
    November 2021
    October 2021
    September 2021
    August 2021
    July 2021
    June 2021
    May 2021
    April 2021
    March 2021
    February 2021
    January 2021
    December 2020
    November 2020
    October 2020
    September 2020
    August 2020
    July 2020
    June 2020
    May 2020
    April 2020
    March 2020
    February 2020
    January 2020
    December 2019
    November 2019
    October 2019
    September 2019
    August 2019
    July 2019
    June 2019
    May 2019
    April 2019
    March 2019
    February 2019
    January 2019
    December 2018
    November 2018
    October 2018
    September 2018
    August 2018
    July 2018
    June 2018
    May 2018
    April 2018
    March 2018
    February 2018
    January 2018
    December 2017
    November 2017
    October 2017
    September 2017
    August 2017
    July 2017
    June 2017
    May 2017
    April 2017
    March 2017
    February 2017
    January 2017
    December 2016
    November 2016
    October 2016
    September 2016
    August 2016
    July 2016
    June 2016
    May 2016
    April 2016
    March 2016
    February 2016
    January 2016
    December 2015
    November 2015
    October 2015
    September 2015
    August 2015
    July 2015
    June 2015
    May 2015
    April 2015
    March 2015
    February 2015
    January 2015
    December 2014
    November 2014
    October 2014
    September 2014
    August 2014
    June 2014
    May 2014
    April 2014
    March 2014
    February 2014
    January 2014

    RSS Feed

  All information on MasterChartsTrading.com is for educational and entertainment purposes only, and should not be construed as a recommendation to buy, sell or sell-short said securities. Read full disclaimer.