Master Charts Trading - Stock Market Indicators & Trade Alerts
Connect To Us!
  • MasterChartsTrading
  • Blog
  • Sign-Up
  • Members
    • Elite Trading Blog
    • Stock Speculator Blog
    • Training Library >
      • Basics of Trading
      • Risk & Trading Psych
      • Trend Identification
  • Help
    • Hall of Fame
    • Social
    • About Us
    • Contact
    • FAQs
    • Disclaimer
    • Refund Policy
    • Privacy Policy
    • What We Trade
    • Newsletter samples

Market recap: December 23, 2016 - SPY QQQ XLK SMH IYT XLU IYR JNK TLT AGG MUB GLD GDX UUP USO UNG

12/24/2016

0 Comments

 
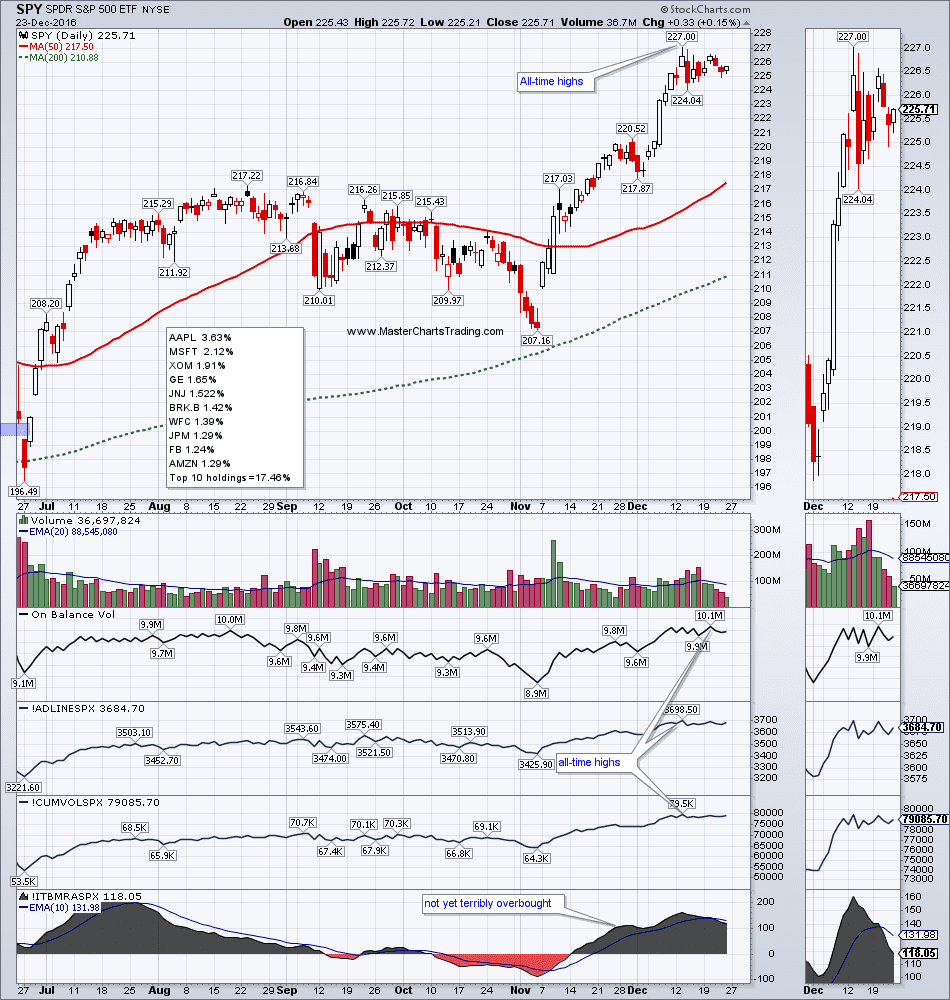
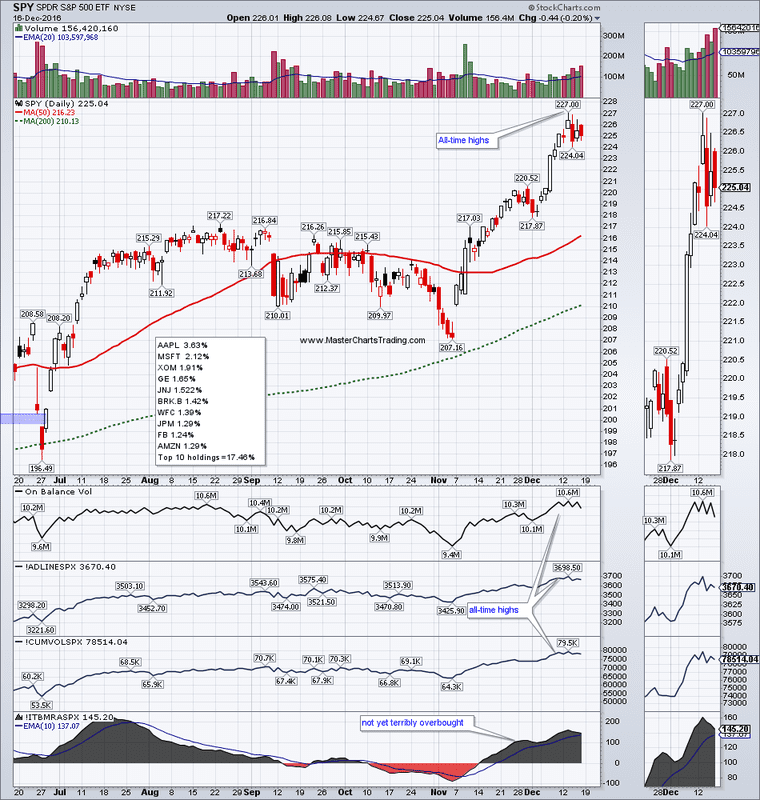
Major stock indices trading near all-time highs
Dow Jones Industrial Average and NASDAQ 100 hit all-time highs again
Technology, Semiconductors and Telecom lead
Junk bonds also at all-time highs – this is very good news for stocks
Utilities, Real Estate are setting up for a bounce
Bond funds have started their rebound
Marking the failure levels for bonds
The Dollar continues with its breakout to multi-highs
This is weighing on gold
The coming bounce in gold and gold miners is likely to be the last in the bull market which started in mid-March of 2016
Oil goes nowhere again
Natural gas setting up for fresh 52-week highs

Charts mentioned in this video are located here: stockcharts.com/public/1229503
Watch this video on YouTube
Picture
0 Comments

Market Recap: December 17, 2016 - SPY QQQ XLK XSD XLF SMH XLY XLB XLE XLU IYR TLT AGG HYD JNK MUB UUP FXE FXY FXB GLD GDX USO UNG JJC 

12/17/2016

0 Comments

 
Parade of all-time highs in major indices and many stock funds continues
The market is definitely overextended to the upside, but by no means weak
QQQ, Technology, Semiconductors, Financials, Discretionary, Energy, Materials – all hit fresh highs
Utilities and Real Estate are also moving higher, possibly due to an expected bounce in bonds
Lower quality credit is leading, while investment-grade bonds are lagging
The Dollar closes at multi-year highs for the 5th week in a row confirming a breakout
Euro at levels no seen since 2003 USDJPY may need a pause soon
Gold and gold miners continue lower and may be headed for a retest of multi-year lows
Oil at 52-week highs
NATGAS pauses its rally
Where is copper headed?
Charts mentioned in this video are located here: stockcharts.com/public/1229503
Watch this video on YouTube
Picture
0 Comments
<<Previous
    Picture
    Picture
    Subscribe to our mailing list!
    Picture
    Picture

    Archives

    February 2023
    January 2023
    December 2022
    November 2022
    October 2022
    September 2022
    August 2022
    July 2022
    June 2022
    May 2022
    April 2022
    March 2022
    February 2022
    January 2022
    December 2021
    November 2021
    October 2021
    September 2021
    August 2021
    July 2021
    June 2021
    May 2021
    April 2021
    March 2021
    February 2021
    January 2021
    December 2020
    November 2020
    October 2020
    September 2020
    August 2020
    July 2020
    June 2020
    May 2020
    April 2020
    March 2020
    February 2020
    January 2020
    December 2019
    November 2019
    October 2019
    September 2019
    August 2019
    July 2019
    June 2019
    May 2019
    April 2019
    March 2019
    February 2019
    January 2019
    December 2018
    November 2018
    October 2018
    September 2018
    August 2018
    July 2018
    June 2018
    May 2018
    April 2018
    March 2018
    February 2018
    January 2018
    December 2017
    November 2017
    October 2017
    September 2017
    August 2017
    July 2017
    June 2017
    May 2017
    April 2017
    March 2017
    February 2017
    January 2017
    December 2016
    November 2016
    October 2016
    September 2016
    August 2016
    July 2016
    June 2016
    May 2016
    April 2016
    March 2016
    February 2016
    January 2016
    December 2015
    November 2015
    October 2015
    September 2015
    August 2015
    July 2015
    June 2015
    May 2015
    April 2015
    March 2015
    February 2015
    January 2015
    December 2014
    November 2014
    October 2014
    September 2014
    August 2014
    June 2014
    May 2014
    April 2014
    March 2014
    February 2014
    January 2014

    RSS Feed

  All information on MasterChartsTrading.com is for educational and entertainment purposes only, and should not be construed as a recommendation to buy, sell or sell-short said securities. Read full disclaimer.