Master Charts Trading - Stock Market Indicators & Trade Alerts
Connect To Us!
  • MasterChartsTrading
  • Blog
  • Sign-Up
  • Members
    • Elite Trading Blog
    • Stock Speculator Blog
    • Training Library >
      • Basics of Trading
      • Risk & Trading Psych
      • Trend Identification
  • Help
    • Hall of Fame
    • Social
    • About Us
    • Contact
    • FAQs
    • Disclaimer
    • Refund Policy
    • Privacy Policy
    • What We Trade
    • Newsletter samples

Stock Market Recap: May 26, 2017 - SPY QQQ IWM DIA XLF XLY XLK XLU XLP XRT XLE XOM TGT UUP GLD GDX USO

5/28/2017

0 Comments

 
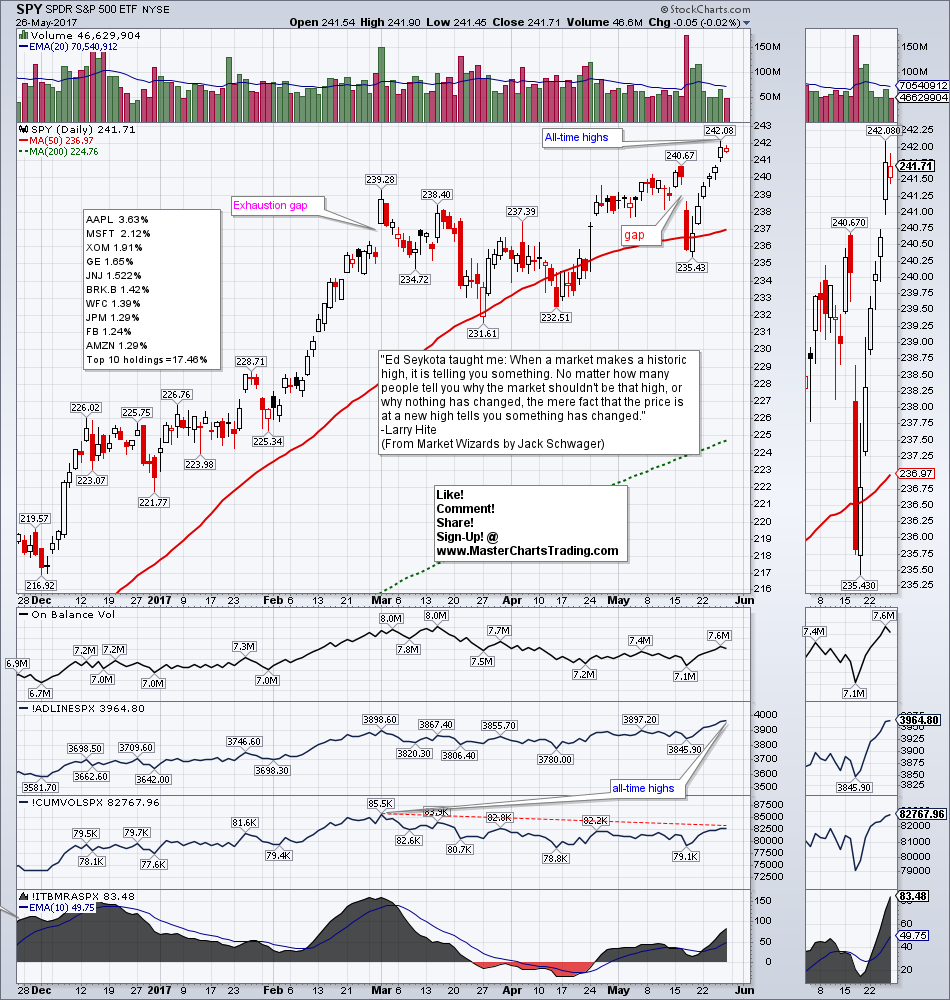
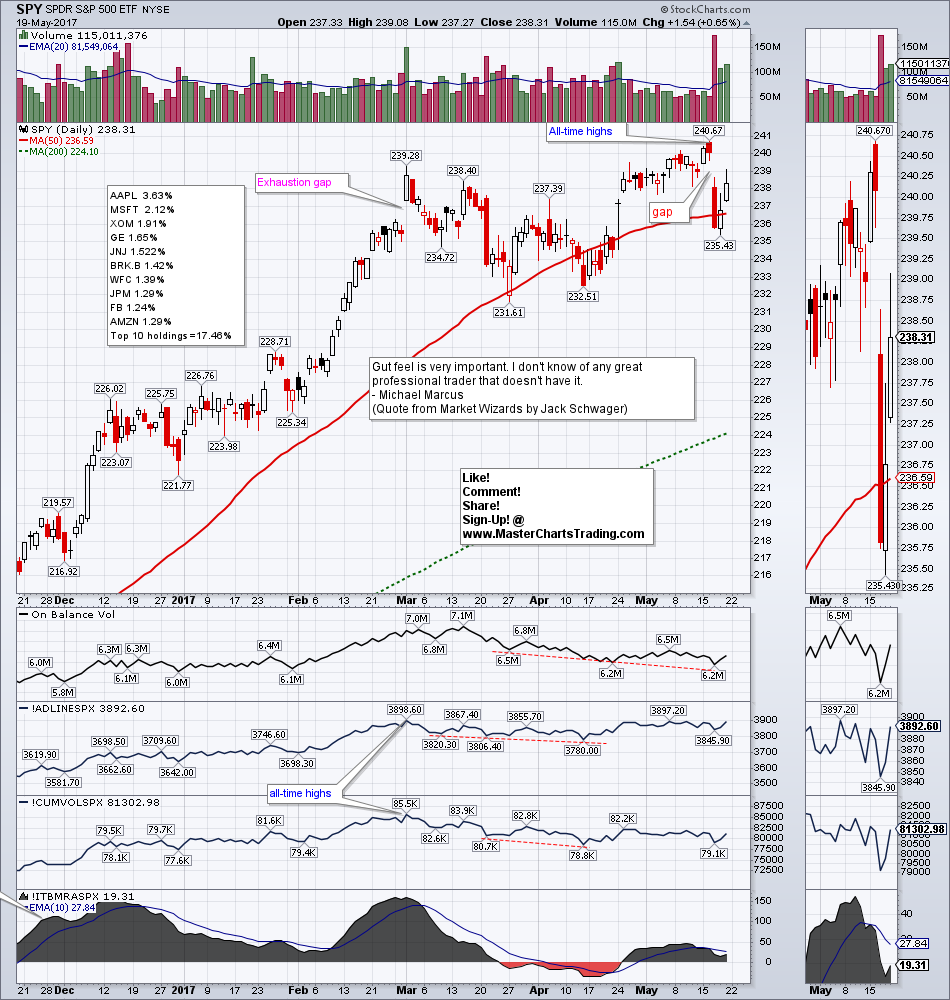
​•Stocks set fresh highs on relatively thin volume | Breadth divergences still remain | Technology, Industrials, Utilities and Staples break to fresh all-time highs | Retail lags | Financials (XLF) may not yet be done correcting | S&P 500 closes above R1 Pivot | QQQ closes above R2 Pivot | Fresh highs are bullish for stocks

•Resilience in junk bonds confirms bullish posture for stocks

•TLT maintains the gap from last week | AGG and LQD may be headed for a retest of all-time highs | This is concerning for the stock market

•US Dollar broke support last week, but is attempting to bottom | Retest of November lows still in the cards | Major currencies trade flat for the week

•Gold has another good week and could be headed for a retest of 2017 highs | Bullish divergence on GDX suggests a continuation of the move up

•Oil recovers some of the losses from Thursday’s plunge | The bigger trend is down for oil | XLE has another bad week | Bearish divergences on XLE suggest further downside | XES already at 52-week lows

•Peak Oil Demand may come as soon as 2020
​
•BlackRock and Vanguard may “push [XOM] for a climate ”stress test” gauging impact of green tech on its assets”
Watch this video on YouTube
Picture
0 Comments

Stock Market Recap: May 19, 2017 - SPY QQQ IWM NYA XLF IYR XLU XLP XLF XRT JNK UUP GLD GDX USO UNG JJC

5/20/2017

0 Comments

 
•Stocks set fresh highs on May 16th, but gap and run lower next day | More and more evidence points towards a correction | Breadth divergences present on many charts | QQQ is still the strongest of the major ETFs, but it is not immune from selling | Both QQQ and SPY are stalling at a yearly Resistance Pivot | IWM continues to chop around | Volume patterns for NYA are also suggesting a corrective pattern | Financials (XLF) retesting April lows and may not hold | XLF could be the leading indicator of a correction | Real Estate, Staples (XLP) and Utilities (XLU) have the strongest weekly gains and indicate a “flight to safety” scenario | Retail (XRT) very weak and could hit 52-week lows
•Junk bonds follow the stocks, but show more resilience to selling | Investment-grade corporate bonds and Treasuries have an excellent second week in a row reinforcing a risk-off posture
•Dollar index breaks support and likely headed for a retest of November lows
•Weakness in the Dollar is excellent news for precious metals | Gold has a Golden Cross | GDX consolidates gains | GDX has a bullish divergence
•Getting ready to short oil as it surges higher
•Natural gas chops sideways
•Copper could retest 52-week highs
Charts mentioned in this video are located here: stockcharts.com/public/1229503
Watch this video on YouTube
Picture
0 Comments
<<Previous
    Picture
    Picture

    Subscribe to our mailing list!

    * indicates required
    /* real people should not fill this in and expect good things - do not remove this or risk form bot signups */

    Intuit Mailchimp

    Click to set custom HTML
    Picture
    Picture

    Archives

    January 2025
    December 2024
    November 2024
    October 2024
    September 2024
    August 2024
    July 2024
    June 2024
    May 2024
    April 2024
    March 2024
    February 2024
    January 2024
    December 2023
    November 2023
    October 2023
    September 2023
    August 2023
    July 2023
    June 2023
    May 2023
    April 2023
    March 2023
    February 2023
    January 2023
    December 2022
    November 2022
    October 2022
    September 2022
    August 2022
    July 2022
    June 2022
    May 2022
    April 2022
    March 2022
    February 2022
    January 2022
    December 2021
    November 2021
    October 2021
    September 2021
    August 2021
    July 2021
    June 2021
    May 2021
    April 2021
    March 2021
    February 2021
    January 2021
    December 2020
    November 2020
    October 2020
    September 2020
    August 2020
    July 2020
    June 2020
    May 2020
    April 2020
    March 2020
    February 2020
    January 2020
    December 2019
    November 2019
    October 2019
    September 2019
    August 2019
    July 2019
    June 2019
    May 2019
    April 2019
    March 2019
    February 2019
    January 2019
    December 2018
    November 2018
    October 2018
    September 2018
    August 2018
    July 2018
    June 2018
    May 2018
    April 2018
    March 2018
    February 2018
    January 2018
    December 2017
    November 2017
    October 2017
    September 2017
    August 2017
    July 2017
    June 2017
    May 2017
    April 2017
    March 2017
    February 2017
    January 2017
    December 2016
    November 2016
    October 2016
    September 2016
    August 2016
    July 2016
    June 2016
    May 2016
    April 2016
    March 2016
    February 2016
    January 2016
    December 2015
    November 2015
    October 2015
    September 2015
    August 2015
    July 2015
    June 2015
    May 2015
    April 2015
    March 2015
    February 2015
    January 2015
    December 2014
    November 2014
    October 2014
    September 2014
    August 2014
    June 2014
    May 2014
    April 2014
    March 2014
    February 2014
    January 2014

    RSS Feed

  All information on MasterChartsTrading.com is for educational and entertainment purposes only, and should not be construed as a recommendation to buy, sell or sell-short said securities. Read full disclaimer.