Master Charts Trading - Stock Market Indicators & Trade Alerts
Connect To Us!
  • MasterChartsTrading
  • Blog
  • Sign-Up
  • Members
    • Elite Trading Blog
    • Stock Speculator Blog
    • Training Library >
      • Basics of Trading
      • Risk & Trading Psych
      • Trend Identification
  • Help
    • Hall of Fame
    • Social
    • About Us
    • Contact
    • FAQs
    • Disclaimer
    • Refund Policy
    • Privacy Policy
    • What We Trade
    • Newsletter samples

Stock Market Recap: May 19, 2017 - SPY QQQ IWM NYA XLF IYR XLU XLP XLF XRT JNK UUP GLD GDX USO UNG JJC

5/20/2017

1 Comment

 
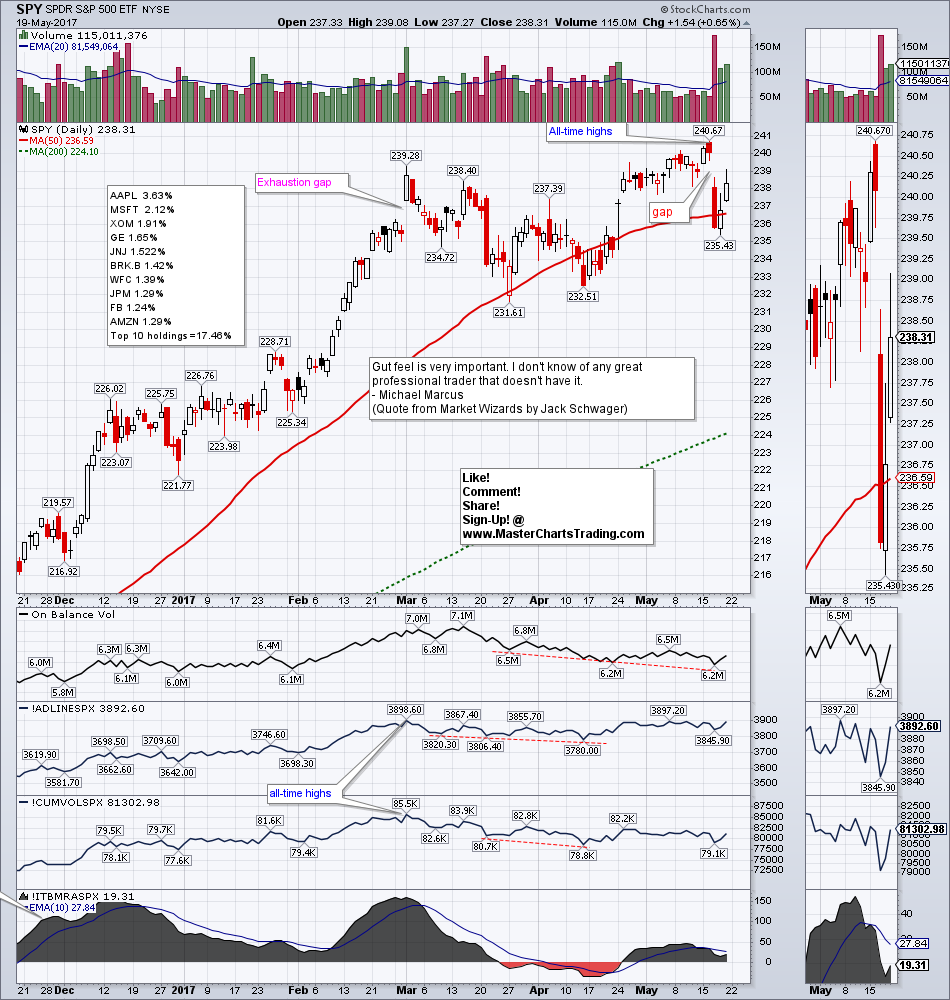
•Stocks set fresh highs on May 16th, but gap and run lower next day | More and more evidence points towards a correction | Breadth divergences present on many charts | QQQ is still the strongest of the major ETFs, but it is not immune from selling | Both QQQ and SPY are stalling at a yearly Resistance Pivot | IWM continues to chop around | Volume patterns for NYA are also suggesting a corrective pattern | Financials (XLF) retesting April lows and may not hold | XLF could be the leading indicator of a correction | Real Estate, Staples (XLP) and Utilities (XLU) have the strongest weekly gains and indicate a “flight to safety” scenario | Retail (XRT) very weak and could hit 52-week lows
•Junk bonds follow the stocks, but show more resilience to selling | Investment-grade corporate bonds and Treasuries have an excellent second week in a row reinforcing a risk-off posture
•Dollar index breaks support and likely headed for a retest of November lows
•Weakness in the Dollar is excellent news for precious metals | Gold has a Golden Cross | GDX consolidates gains | GDX has a bullish divergence
•Getting ready to short oil as it surges higher
•Natural gas chops sideways
•Copper could retest 52-week highs
Charts mentioned in this video are located here: stockcharts.com/public/1229503
Watch this video on YouTube
Picture
Ready to trade? Sign-up Today
1 Comment
indira
7/10/2020 04:57:07 am

Hi. Great comment. I don’t have all the answers. My thoughts are as follows:
1) If Feb or Dec 2018 caused massive losses then… you traded too big and too aggressively.
Many people (not me) actually made money in those months.
2) I don’t think there’s any other way to trade than to pick your spots and be patient.
You’re also reducing risk by being patient.
I trade much less frequently than I used to, yet my results are the same (and I have less stress).
If you’d like to discuss, you’re welcome to book a call https://beststockstrategy.thrivecart.com/30-minute-call/
or take the alerts at
https://beststockstrategy.com/memberships/

Reply


Leave a Reply.

    Picture
    Picture
    Subscribe to our mailing list!
    Picture
    Picture

    Archives

    February 2023
    January 2023
    December 2022
    November 2022
    October 2022
    September 2022
    August 2022
    July 2022
    June 2022
    May 2022
    April 2022
    March 2022
    February 2022
    January 2022
    December 2021
    November 2021
    October 2021
    September 2021
    August 2021
    July 2021
    June 2021
    May 2021
    April 2021
    March 2021
    February 2021
    January 2021
    December 2020
    November 2020
    October 2020
    September 2020
    August 2020
    July 2020
    June 2020
    May 2020
    April 2020
    March 2020
    February 2020
    January 2020
    December 2019
    November 2019
    October 2019
    September 2019
    August 2019
    July 2019
    June 2019
    May 2019
    April 2019
    March 2019
    February 2019
    January 2019
    December 2018
    November 2018
    October 2018
    September 2018
    August 2018
    July 2018
    June 2018
    May 2018
    April 2018
    March 2018
    February 2018
    January 2018
    December 2017
    November 2017
    October 2017
    September 2017
    August 2017
    July 2017
    June 2017
    May 2017
    April 2017
    March 2017
    February 2017
    January 2017
    December 2016
    November 2016
    October 2016
    September 2016
    August 2016
    July 2016
    June 2016
    May 2016
    April 2016
    March 2016
    February 2016
    January 2016
    December 2015
    November 2015
    October 2015
    September 2015
    August 2015
    July 2015
    June 2015
    May 2015
    April 2015
    March 2015
    February 2015
    January 2015
    December 2014
    November 2014
    October 2014
    September 2014
    August 2014
    June 2014
    May 2014
    April 2014
    March 2014
    February 2014
    January 2014

    RSS Feed

  All information on MasterChartsTrading.com is for educational and entertainment purposes only, and should not be construed as a recommendation to buy, sell or sell-short said securities. Read full disclaimer.