Friday, March 28, 2014 (Weekly Commentary)
A Cool-Off In Risk Appetite.
Major indices were mostly down for the week. Only the Dow has managed to gain 0.12 percent. Tech heavy NASDAQ and the high beta Small cap Russell 2000 were off by 2.83% and 3.51% respectively.
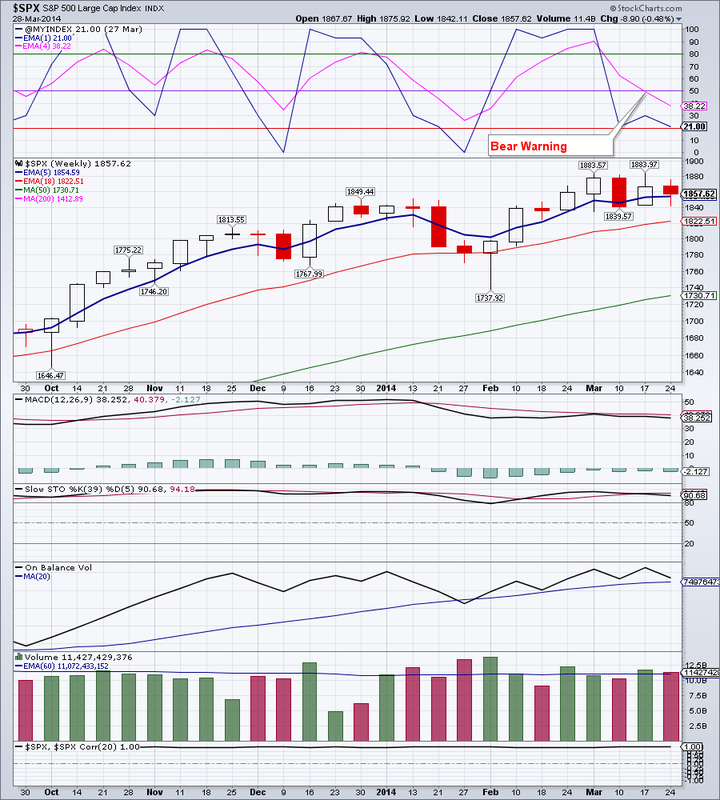
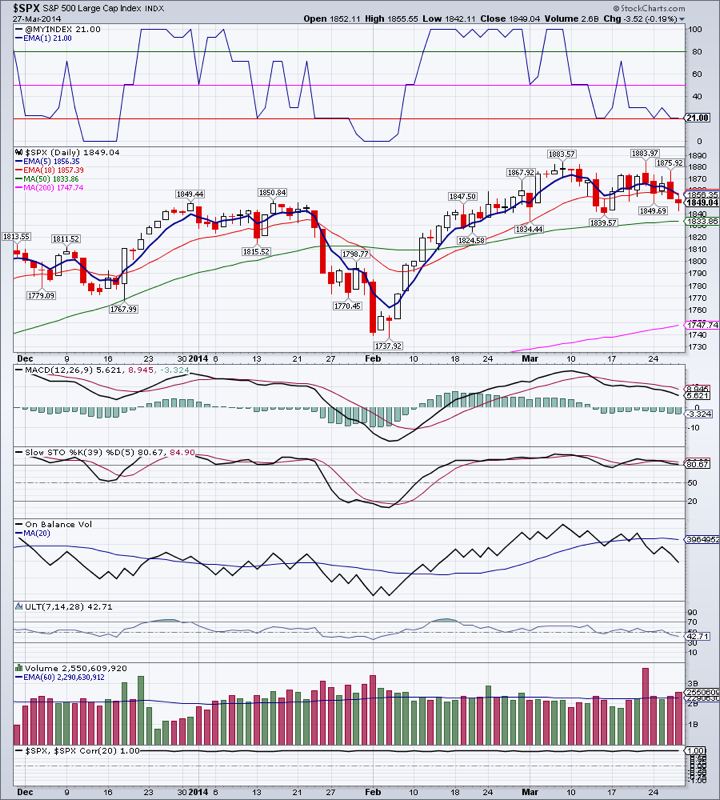
The large cap $SPX has been range-bound for the past month. A close above 1884 or below 1840 should clarify the medium-term direction of the general market.
Market Breadth Index, the $VMBI, has been in Bear Warning since last Friday (on the weekly charts). Market breadth improved somewhat on Friday, but as we mentioned before, even a small spike in VIX would send it into Bear Confirmation territory. We have reduced our equity allocation accordingly.
TLT appear to have broken out to the upside on both the daily and the weekly charts, with a close at $109.37. Strength in the Treasuries further signifies a decrease in risk appetite. We are targeting a move to the $115 area for TLT.
Gold had a second nasty week dropping as much as 3.5%, before rebounding slightly and closing at $1294.90. Gold has so far retraced about 50 percent of its advance that started at the beginning of this year. Daily charts are showing some support, but more downside is very much possible to around $1260.
Emerging markets was the big story from last week. EEM finally managed to close above resistance on both daily and weekly charts. We have opened a small position in EEM as a result and will add more should this outperformance continue.
IYR seems to have reaffirmed support in the $66 area. A breakout close above $68.54 or a breakdown close below $65.89 would clarify the medium-term trend.
Natural gas rebounded for the week on below-average volume. This rebound may possibly continue higher to the 50 Day Moving Average, currently at $4.81. We still think that the bigger trend is down and a retest of January low at around $4 is probable. Should, however Natural gas close above $4.81, especially on weekly basis, this downwards thesis could come into question.
Oil rebounded strongly and closed above the 200 DMA also on weak volume. Oil is at a critical junction. A failure here would likely mean that the current support at $97.55 will not hold and a re-test of January low would occur.
Bottom line: Money seems to be drawn to quality and risk-aversion.
Open positions: GDX (took profits), IYR(took profits), DVY(took profits), ETV(took profits), EEM (new small position), TLT(increased),
Hedging positions: TZA (closed-all profitable), SDOW, DGAZ
A Cool-Off In Risk Appetite.
Major indices were mostly down for the week. Only the Dow has managed to gain 0.12 percent. Tech heavy NASDAQ and the high beta Small cap Russell 2000 were off by 2.83% and 3.51% respectively.
The large cap $SPX has been range-bound for the past month. A close above 1884 or below 1840 should clarify the medium-term direction of the general market.
Market Breadth Index, the $VMBI, has been in Bear Warning since last Friday (on the weekly charts). Market breadth improved somewhat on Friday, but as we mentioned before, even a small spike in VIX would send it into Bear Confirmation territory. We have reduced our equity allocation accordingly.
TLT appear to have broken out to the upside on both the daily and the weekly charts, with a close at $109.37. Strength in the Treasuries further signifies a decrease in risk appetite. We are targeting a move to the $115 area for TLT.
Gold had a second nasty week dropping as much as 3.5%, before rebounding slightly and closing at $1294.90. Gold has so far retraced about 50 percent of its advance that started at the beginning of this year. Daily charts are showing some support, but more downside is very much possible to around $1260.
Emerging markets was the big story from last week. EEM finally managed to close above resistance on both daily and weekly charts. We have opened a small position in EEM as a result and will add more should this outperformance continue.
IYR seems to have reaffirmed support in the $66 area. A breakout close above $68.54 or a breakdown close below $65.89 would clarify the medium-term trend.
Natural gas rebounded for the week on below-average volume. This rebound may possibly continue higher to the 50 Day Moving Average, currently at $4.81. We still think that the bigger trend is down and a retest of January low at around $4 is probable. Should, however Natural gas close above $4.81, especially on weekly basis, this downwards thesis could come into question.
Oil rebounded strongly and closed above the 200 DMA also on weak volume. Oil is at a critical junction. A failure here would likely mean that the current support at $97.55 will not hold and a re-test of January low would occur.
Bottom line: Money seems to be drawn to quality and risk-aversion.
Open positions: GDX (took profits), IYR(took profits), DVY(took profits), ETV(took profits), EEM (new small position), TLT(increased),
Hedging positions: TZA (closed-all profitable), SDOW, DGAZ


 RSS Feed