Master Charts Trading - Stock Market Indicators & Trade Alerts
Connect To Us!
  • MasterChartsTrading
  • Products
  • Blog
  • Members
    • Elite Trading Blog
    • Stock Speculator Blog
    • Training Library >
      • Basics of Trading
      • Risk & Trading Psych
      • Trend Identification
  • Help
    • Hall of Fame
    • Social
    • About Us
    • Contact
    • FAQs
    • Disclaimer
    • Refund Policy
    • Privacy Policy
    • What We Trade
    • Scanner Sign-up
  • Affiliates

A Second Wind, or Will TLT Sink the Market?

3/27/2014

0 Comments


Thursday, March 27, 2014

A Second Wind, or Will Bonds Sink the Market?

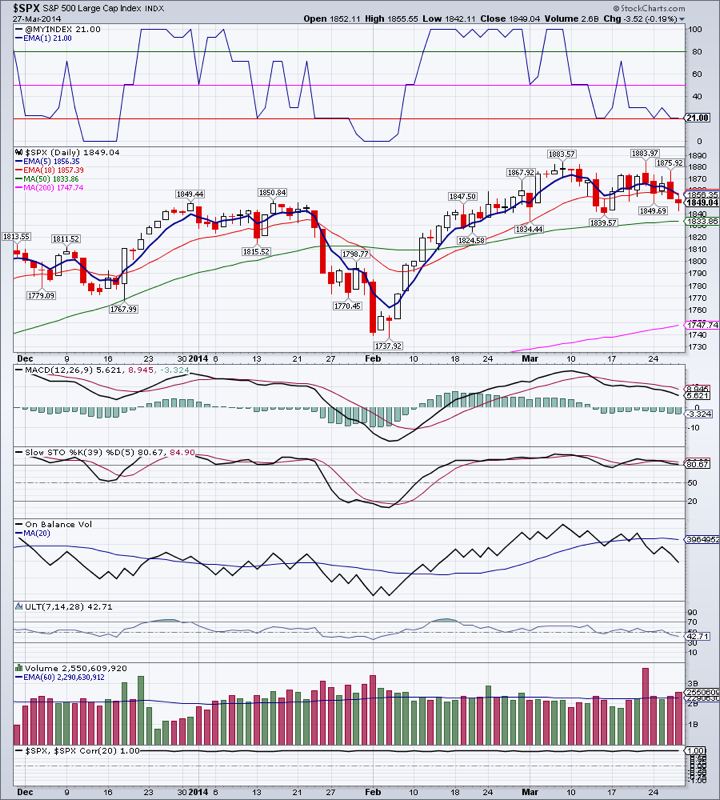
  The bulls are putting up a valiant fight. $SPX attempted to rally in the morning, but ultimately failed to do so and lost 0.19 percent. It and the Dow printed what looks like a hammer candlestick - indicating decent buying pressure. Looking beyond pure momentum, we see that volume was still greater then normal and the On Balance Volume (OBV) indicator is negative. In the past OBV negativity ultimately triumphed and the market rolled over.

  Market Breadth Index, the $VMBI, is hairbreadth away from confirming bearish posture. (We are currently in Bear Warning). Even a small spike in VIX to, lets say around 15.2, would likely trigger Bear Confirmation.

  EEM managed to close above critical resistance at $40.42 today. We have opened a very small position. Should this rally continue, we will add to it.

  TLT rallied further to $109.99 on good volume. TLT is short term overbought, so a pullback to $108-109 area is possible. This breakout in TLT is bearish for stocks since generally stocks and bonds are negatively correlated.

  If we assume that GDX is more sensitive to the future direction of gold price, then we could say that gold is about to make a turnaround. (GDX gained 1.4% today on good volume). We expect gold to find support in the $1260-1290 area and rally from here.

  IYR is likely to retest the 50 Day Moving average. Should that give, a fall to the $64 area is virtually guaranteed (200 DMA)

  Natural Gas is rebounding, as we predicted. It may continue to do so for a while up to the 50 DMA, currently at $4.80. Should it manage to close above the 50 DMA, we will need to reevaluate our bearish stance on natural gas.

  Oil may be staging a beginning of a rally. It managed to close above the 200 DMA today on a bullish candlestick and decent volume. Next resistance level is in the $102.90 area.

  Open positions: GDX, IYR, TLT (added), DVY, ETV, EEM (new small position)
  Hedging positions: TZA (took profits), SDOW, DGAZ (very small position)


Picture
Ready to trade? Sign-up Today
0 Comments


Leave a Reply.

    Picture
    Picture
    Subscribe to our mailing list!
    Picture
    Picture

    Archives

    February 2021
    January 2021
    December 2020
    November 2020
    October 2020
    September 2020
    August 2020
    July 2020
    June 2020
    May 2020
    April 2020
    March 2020
    February 2020
    January 2020
    December 2019
    November 2019
    October 2019
    September 2019
    August 2019
    July 2019
    June 2019
    May 2019
    April 2019
    March 2019
    February 2019
    January 2019
    December 2018
    November 2018
    October 2018
    September 2018
    August 2018
    July 2018
    June 2018
    May 2018
    April 2018
    March 2018
    February 2018
    January 2018
    December 2017
    November 2017
    October 2017
    September 2017
    August 2017
    July 2017
    June 2017
    May 2017
    April 2017
    March 2017
    February 2017
    January 2017
    December 2016
    November 2016
    October 2016
    September 2016
    August 2016
    July 2016
    June 2016
    May 2016
    April 2016
    March 2016
    February 2016
    January 2016
    December 2015
    November 2015
    October 2015
    September 2015
    August 2015
    July 2015
    June 2015
    May 2015
    April 2015
    March 2015
    February 2015
    January 2015
    December 2014
    November 2014
    October 2014
    September 2014
    August 2014
    June 2014
    May 2014
    April 2014
    March 2014
    February 2014
    January 2014

    RSS Feed

  All information on MasterChartsTrading.com is for educational and entertainment purposes only, and should not be construed as a recommendation to buy, sell or sell-short said securities. Read full disclaimer.