Master Charts Trading - Stock Market Indicators & Trade Alerts
Connect To Us!
  • MasterChartsTrading
  • Blog
  • Sign-Up
  • Members
    • Elite Trading Blog
    • Stock Speculator Blog
    • Training Library >
      • Basics of Trading
      • Risk & Trading Psych
      • Trend Identification
  • Help
    • Hall of Fame
    • Social
    • About Us
    • Contact
    • FAQs
    • Disclaimer
    • Refund Policy
    • Privacy Policy
    • What We Trade
    • Newsletter samples

Market Recap For Friday, July 24, 2015 - SPY QQQ xLV BIIB TLT GLD GDX GDXJ USO XLE EWZ UNG

7/25/2015

0 Comments

 
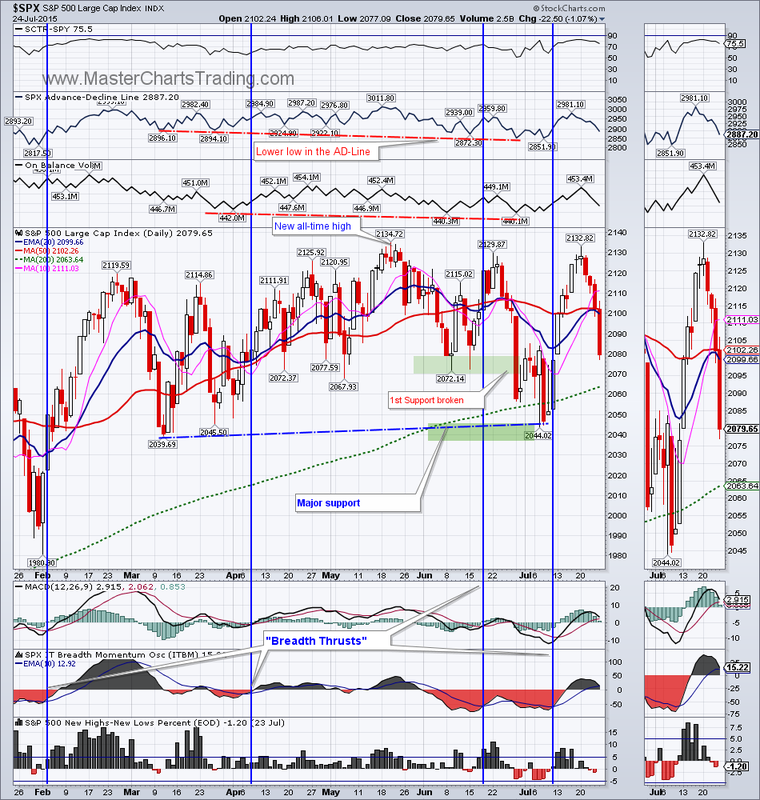
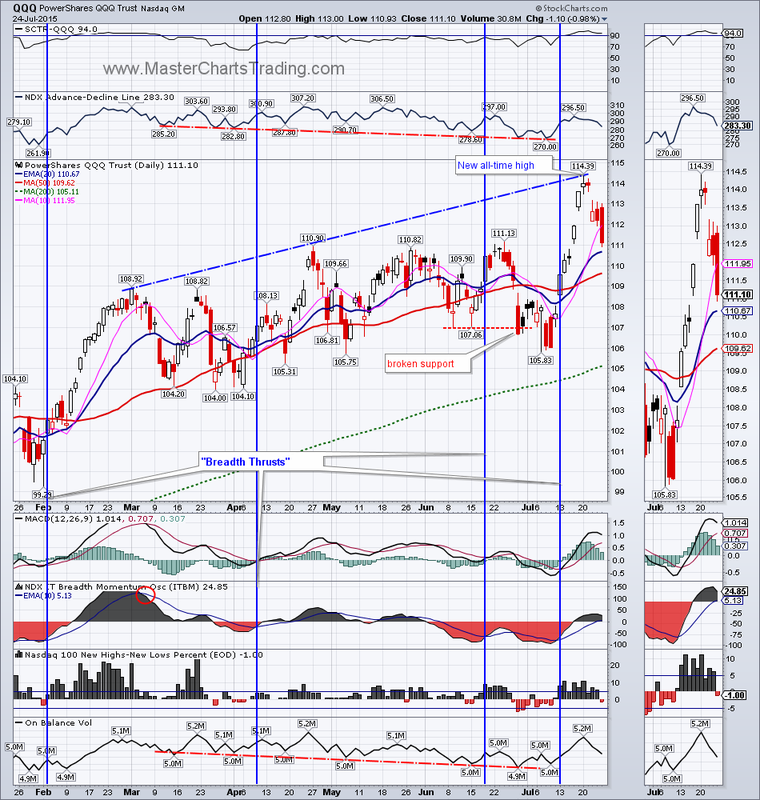
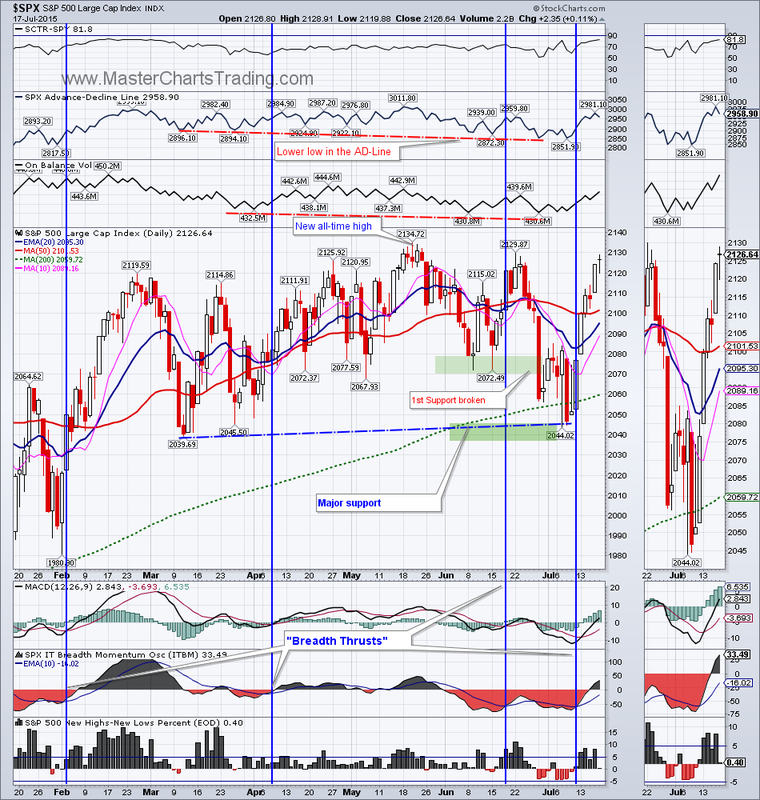
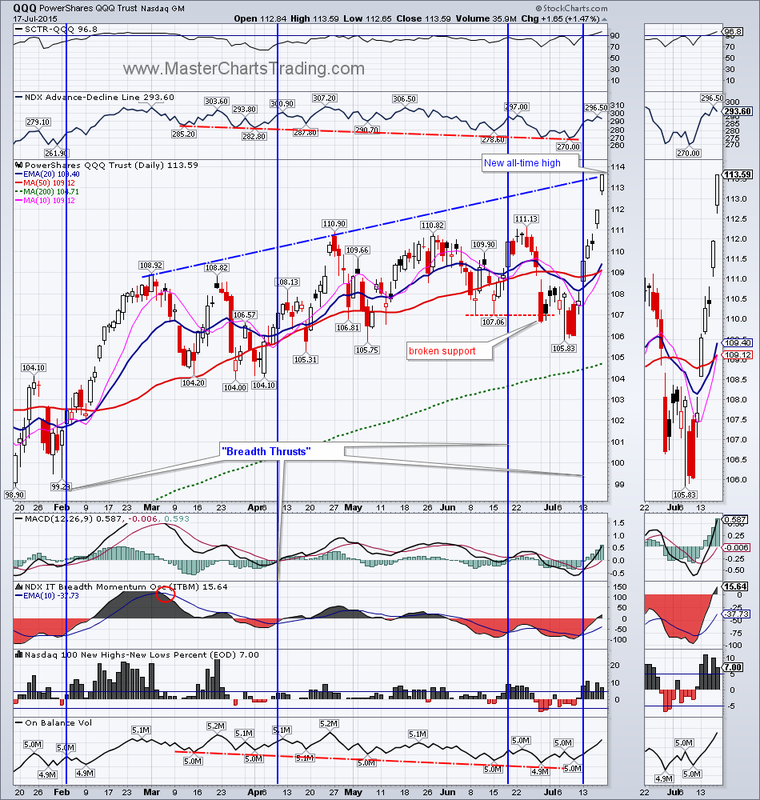
Just as many investors thought a breakout in the NASDAQ was for real, we got a wave after wave of selling throughout the week. Friday culminated with rather ominous looking candles on many indices and ETFs. $SPX lost over 2%, while QQQ fared better and closed at its breakout level. 

Market breadth was narrow on the last week’s advance. I was really hoping for the divergences to be worked off this week, but it did not happen. The AD-Lines and the On Balance volume for both $SPX and QQQ did not confirm new highs. Summer month are traditionally weak for stocks, perhaps more downside is coming?   

Live $SPX and QQQ charts
Picture
Picture
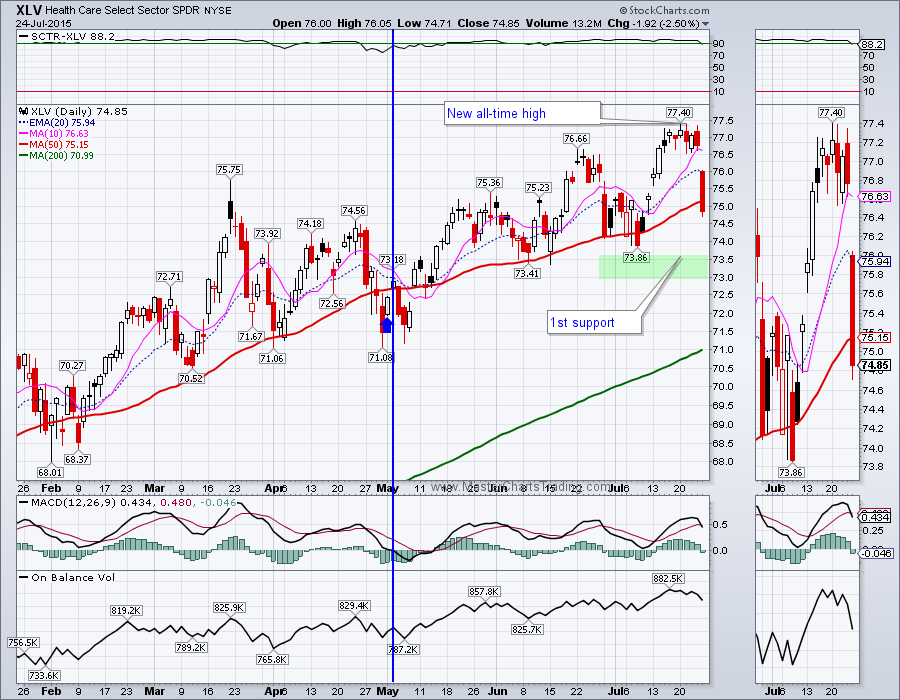
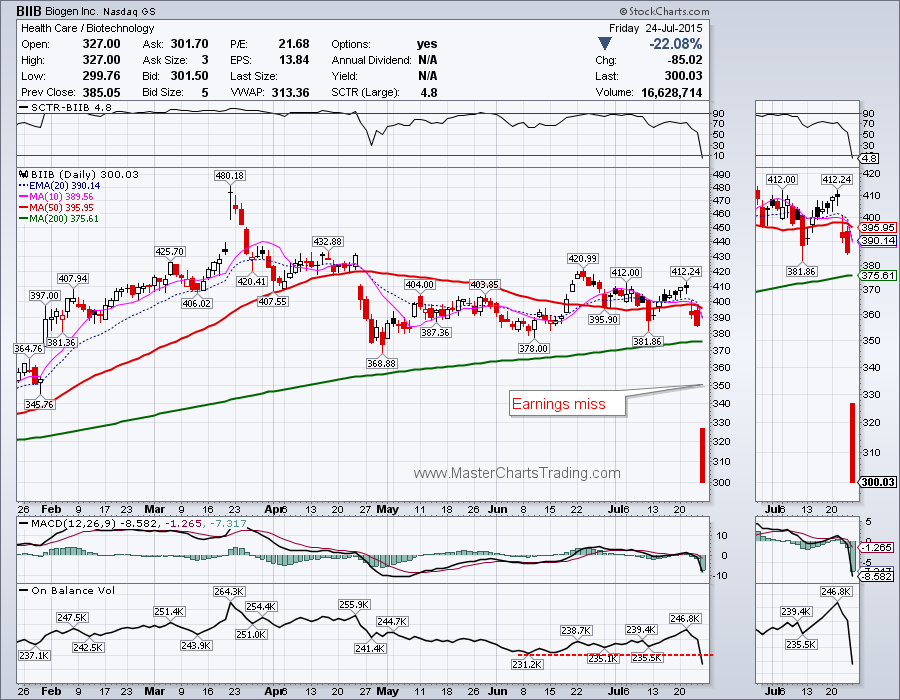
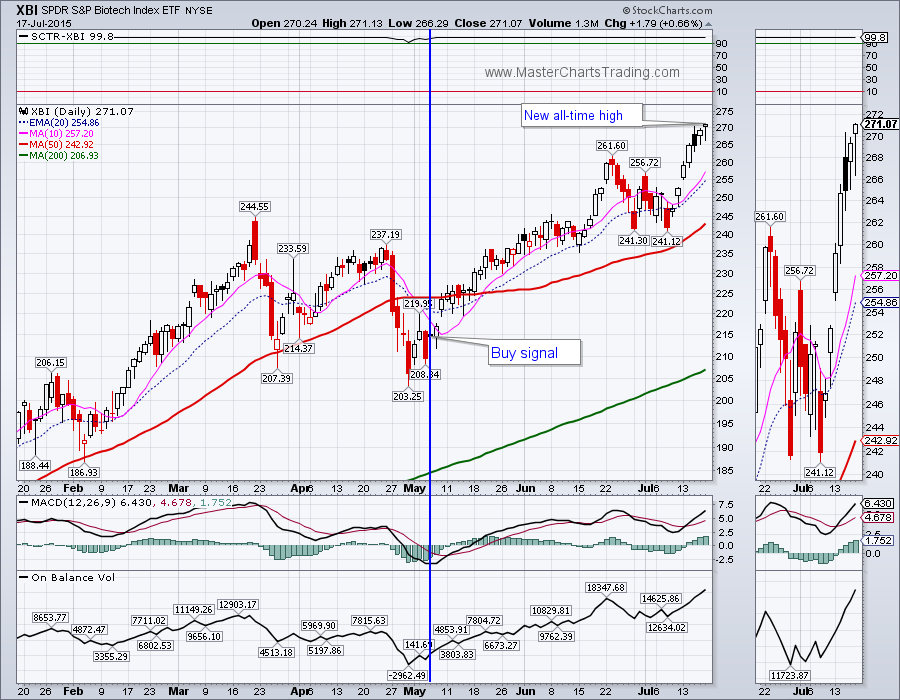
 Health care sector has been one of the market leaders, but Friday’s action raises an important question of whether sector rotation out of it has started. (BIIB dropped -22% on earnings report). Take a look at the chart of XLV. Friday morning the price gapped down over 1% and selling continued until the close forming a Marubozu candlestick. XLV ended the day below the 50-day average. There is decent support around the $73 area, but should that level give, XLV could easily correct another 4% or so down to the 200-day moving average. 

Picture
Picture
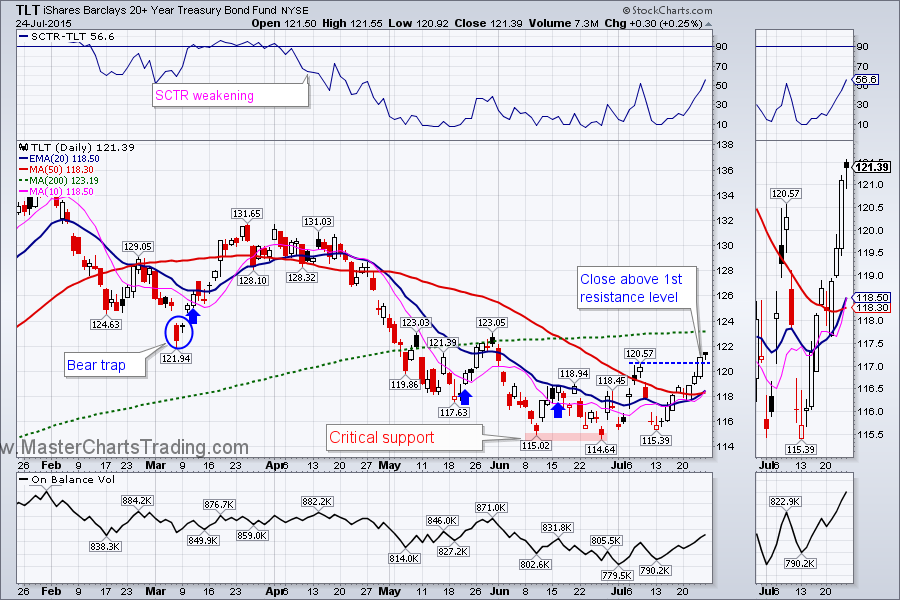
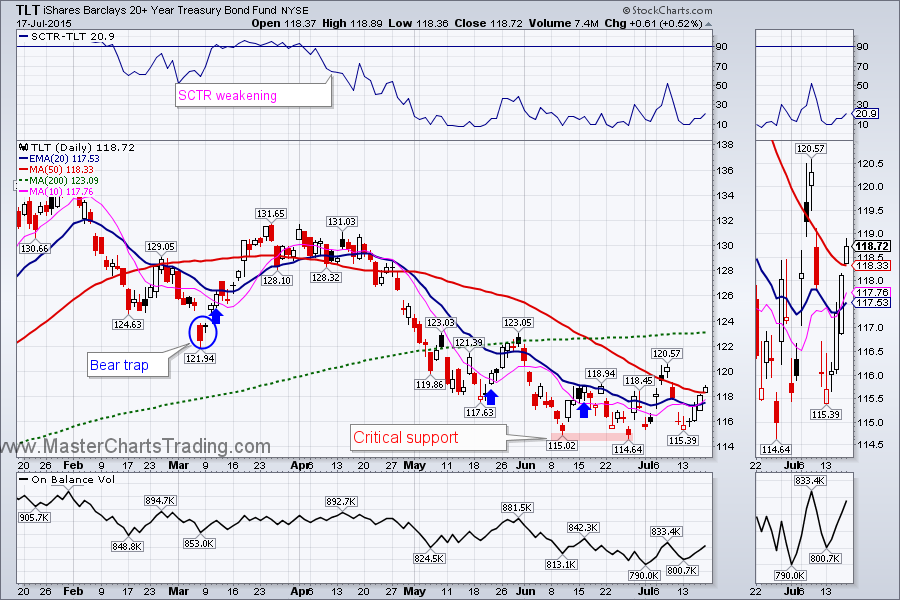
Bonds (TLT) traditionally do well during the summer month. Combined with a potential sell-off in stocks, it seems that money has been rotating into bonds. TLT gained 2.25% for the week. The important feature of its chart is that it broke out above initial resistance at $120.57. Next important level for TLT to close above would be the 200-day moving average – currently at $123. 
Picture
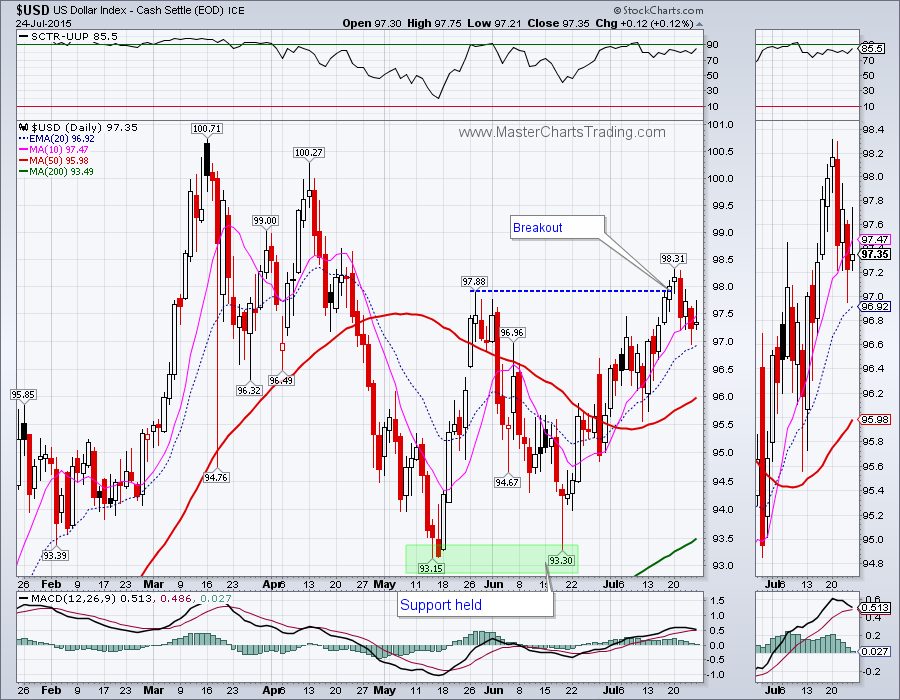
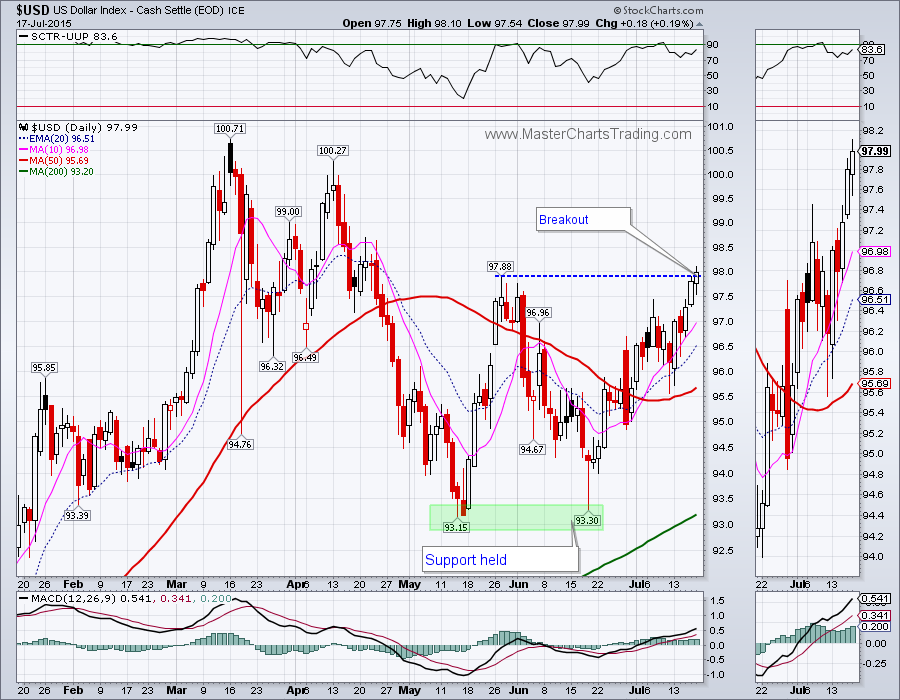
The dollar index ($USD) broke out above resistance last Friday. This week $USD spent time consolidating its gains with a slight pullback. This is very normal for an up-trending security. I think more upside is very likely for the dollar index. This will weigh on commodities of all sorts including precious metals.

Picture
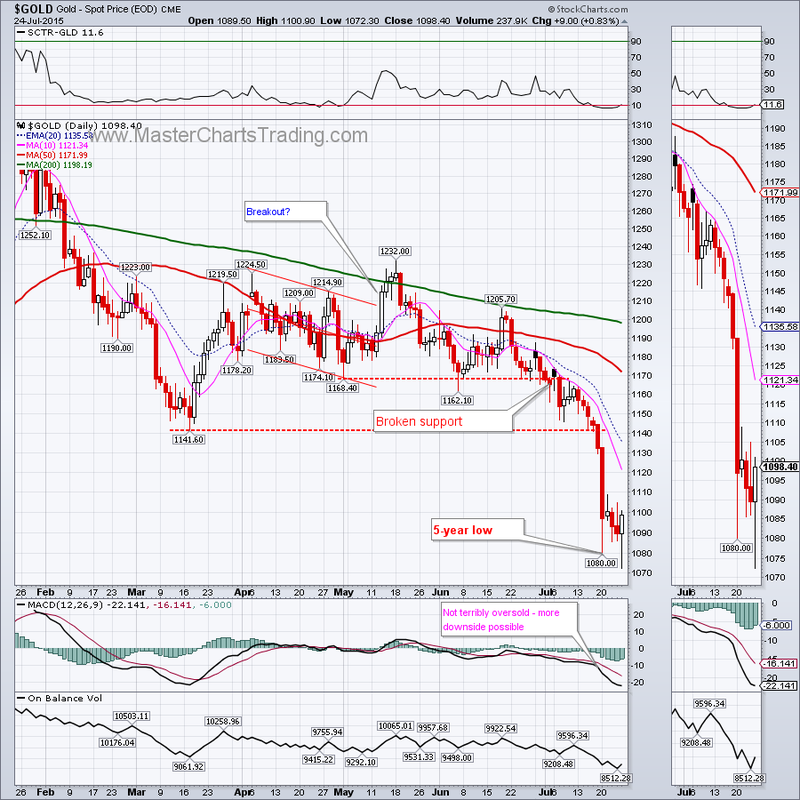
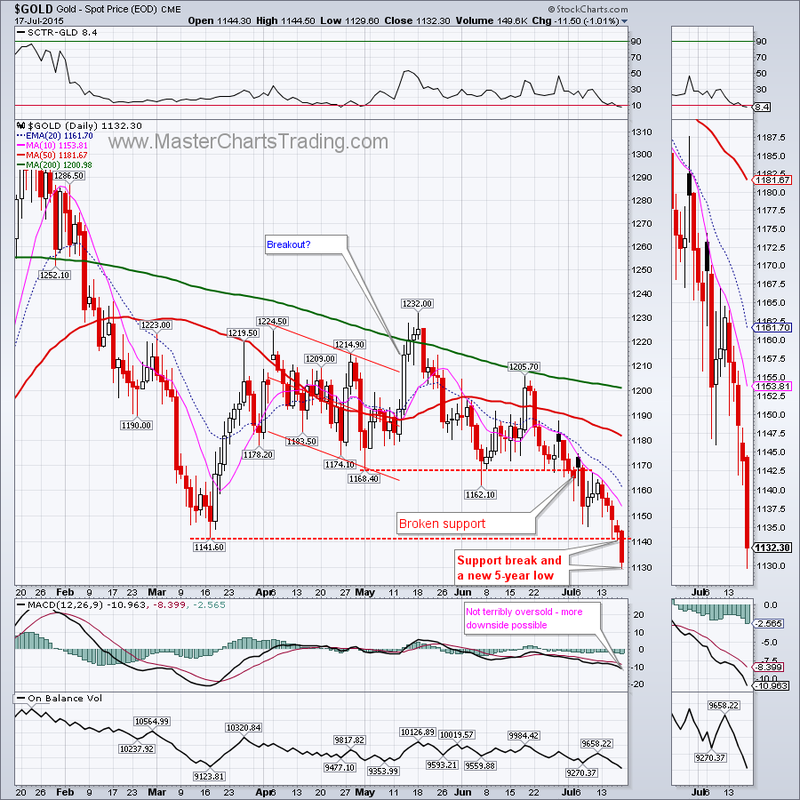
        Gold was down over 5% for the week before managing to find support on Friday. Gold is long-term bearish, but may be exhibiting signs of a short-term bottom. There were several hammer-like candlesticks this week and especially Friday’s candle looks like bottoming action is taking place. A rebound to broken support around $1140 is in the cards. 
Gold Chart

Picture
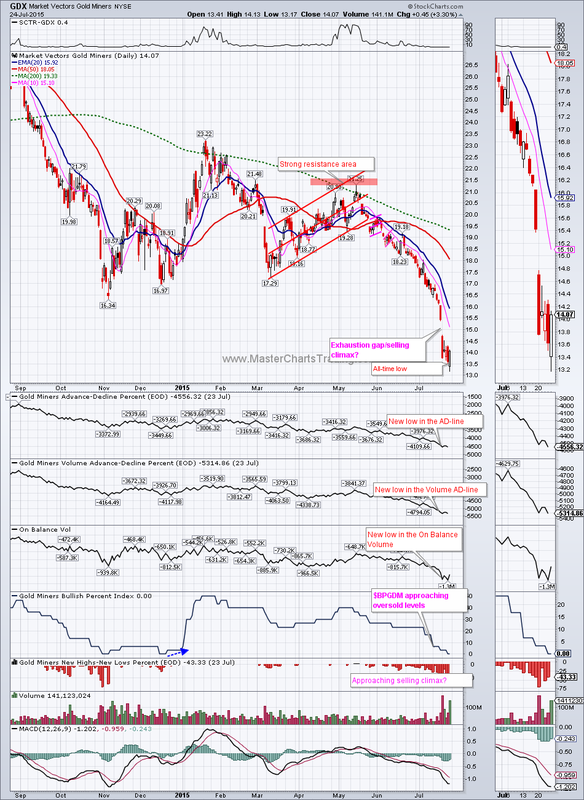
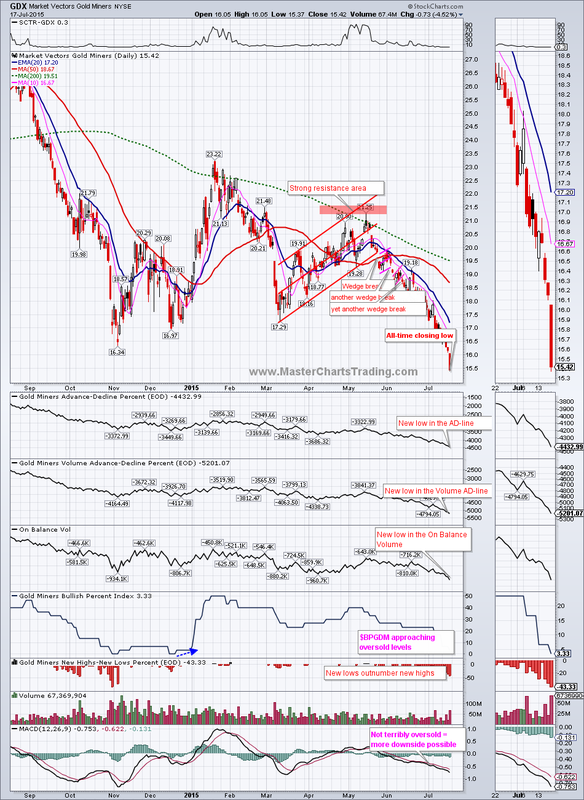
GDX was down over 14% for the week, but managed to pullback. GDX is a strongly bearish security, so bottom fishing is notoriously difficult (and fraught with unnecessary risks).

      ...  Having said that, GDX is very oversold on numerous parameters. Momentum oscillators, such as MACD, are at a level where previous rebounds took place. We had a gap down on Monday, which needs filling. Most importantly, however, is the fact that the Bullish Percent index for GDX was at zero today. That’s right, there is now not a single stock within GDX that is on a Point & Figure chart buy signal! During the previous lows in GDX this was one of the more reliable indicators of a bottoming action. 
Live GDX chart with market breadth

Picture
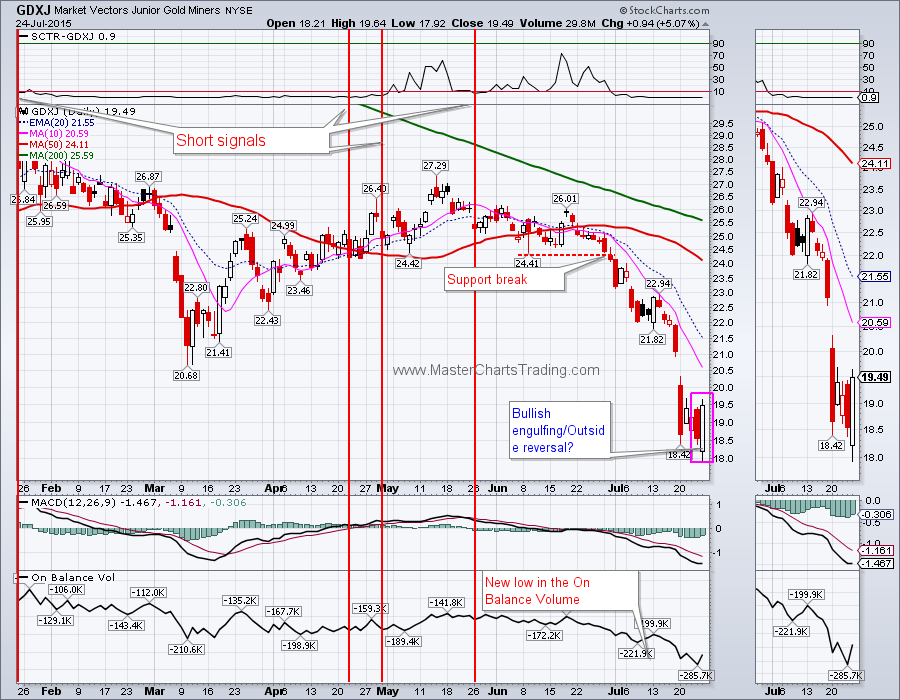
GDXJ – the Junior Gold Miners ETF – also had a possible Bullish Engulfing pattern on its chart today. I say possible, because it needs a confirmation soon with prices pushing higher.
Live GDXJ Chart
Picture
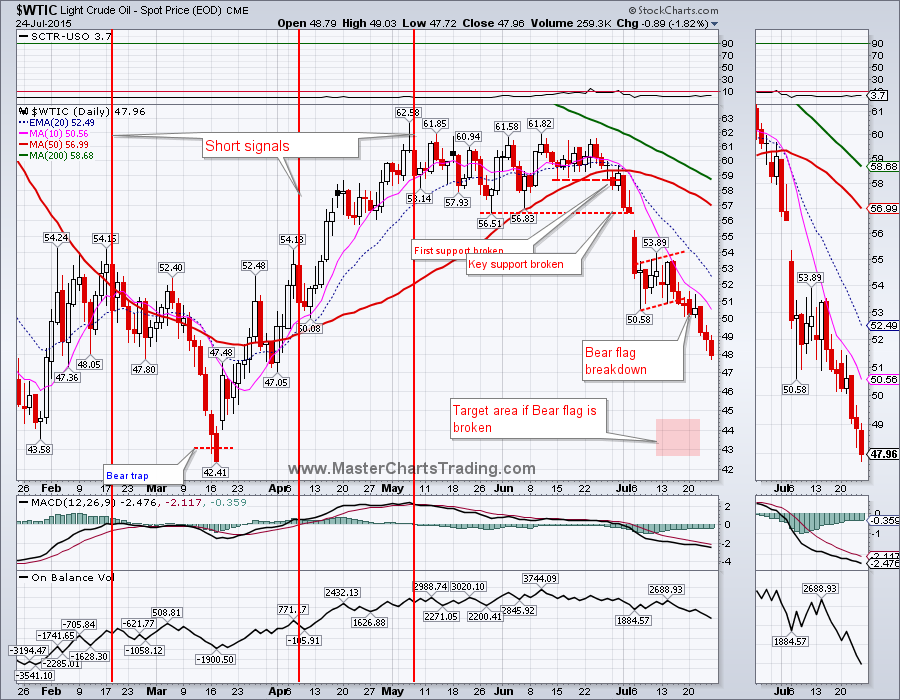
Strong dollar is weighing on oil as well. $WTIC broke down from a bear-flag formation last week and closed down 5.55% this week. I still have an open short in oil, but did book some profits in the inverse oil ETF (symbol SCO).
Picture
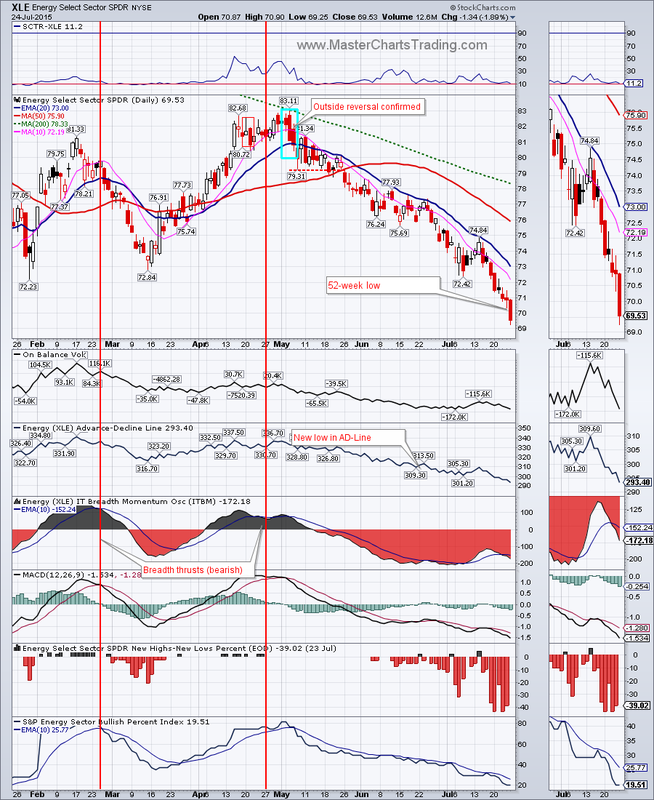
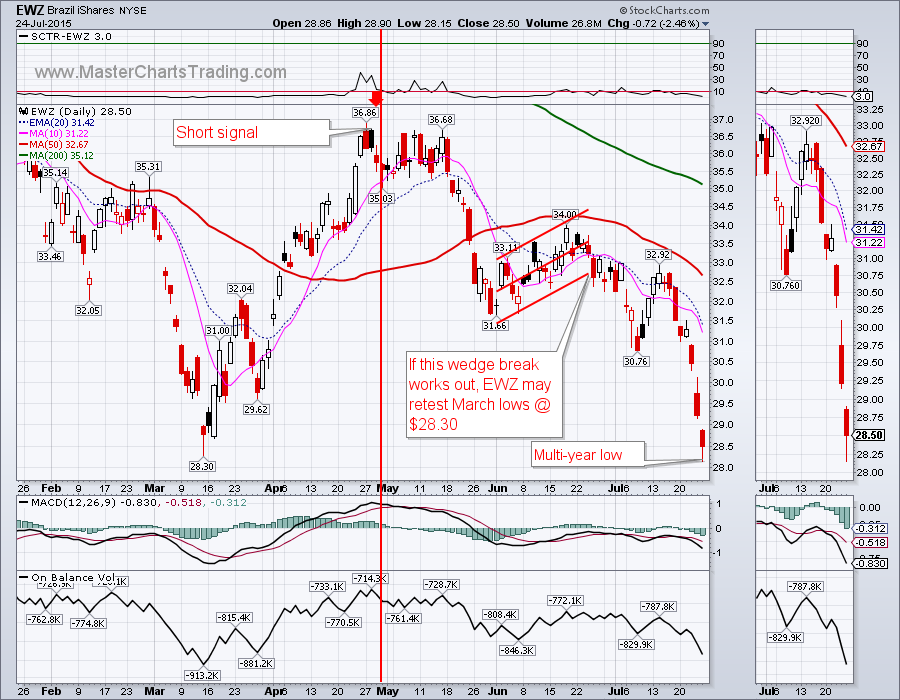
Unsurprisingly down trending oil is weighing on energy stocks and countries that export oil. XLE – the Energy ETF - had a bearish breadth momentum oscillator signal in late April and never looked back. XLE just hit a fresh 52-week low. While EWZ – the Brazil ETF – went on our short signal also at the end of April and today hit a multi-year low. 

Picture
Picture
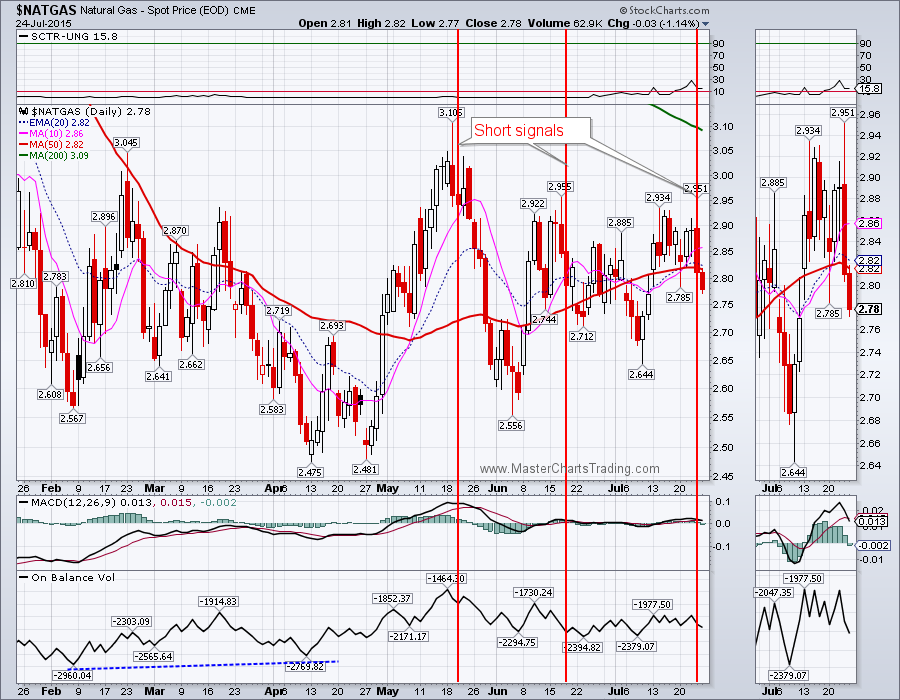
Finally, it seems that natural gas ($NATGAS) is at a point where another leg down in prices seems likely. On Thursday, we opened a position in DGAZ (inverse natural gas ETF). I am thinking $NATGAS may at least retest the mid-July lows @ $2.64.

Picture
That’s it for this week’s market recap,

Best Regards and have another great trading week!

** Special Announcement**

We are close to launching a stocks alert service. Please sign-up for our mailing list to be the first to take advantage of the discounted membership once it becomes available!


Alexander Berger (www.MasterChartsTrading.com)

0 Comments

Market Recap For Friday, July 17, 2015 - sPY QQQ XBI FDN XSD TLT UUP GLD GDX ABX JJG

7/18/2015

0 Comments

 
The markets again managed to surprise many observers this week. $SPX turned around from a close below the 200-day moving average and gained 2.41%, while QQQ closed at all time highs. The resilience of this bull market is undeniable and investors are exhibiting appetite for risk. 
Picture
Minor divergences in the market breadth for $SPX still are present on the charts, but with any more upside, I think these would be worked-off. Similar picture on QQQ: I would like to see the rest of the index catch up to Google, Amazon, Netflix and Facebook. It looks like the big names (FDN) and high momentum (XBI) are pushing higher, while there is some pronounced weakness in the semiconductors sector (XSD). 
Picture
Picture
Picture
Picture
After if was all said and done, bonds did not have such a bad week. TLT gained 2.4% for the week and held the critical support for the 3rd time. TLT managed to close above its 50-day moving average. There are still lots of overhead resistance levels, but this is a first step. Again, if the critical support level around $115 is breached, I will treat TLT as a bearish security. For now I still think TLT is weakly bullish.

         
Picture
The dollar index also had a very strong week. On Friday $USD managed to close above its mid-May high on a bullish looking candlestick. I think $USD is ready to challenge the recent March and April highs. Should this happen it will weigh on commodities that are already under significant pressure.

Picture
Precious metals of all flavors and their miners had some of the worse weeks in many years (Barrick Gold closed at a 24-year low). Gold broke below March low at $1141.60 and touched a 5-year low on Friday, but closed just shy of it at $1132.30. Gold is still not terribly oversold (as compared to other instances when it hit new lows) so more downside is very much possible. Did I mention gold is bearish? 
Picture
Picture
Not to be outdone, the gold miners ETF – GDX hit an all-time closing low on Friday. GDX broke below its November low to end the week at $15.42. In the past market recap videos I mentioned that the market breadth for GDX was registering new lows BEFORE the ETF itself did so. This was a classic case of a bearish divergence.
GDX is not that oversold according to MACD, but it does appear that the gold miners are approaching some sort of a selling climax (the Bullish Percent Index ($BPGDM) is at only 3.33%) so I would not rule out a short covering rally of some sort in the near term. Again, GDX is a bearish security, so I am not even going to try to pick bottoms, I would rather wait for a rebound to go short again. If/when GDX becomes bullish; I will reverse my thinking and start looking for buying opportunities.
live GDX chart

Picture
Several weeks ago we had what appeared to be a bona fide breakouts in the “soft” agricultural commodities. I wanted to see if these breakouts would hold or not. I think many commodities are showing signs of a failure. For example JJG – grains sub-index fund ETN that holds futures contracts for corn, wheat and soybeans – went on our short signal on Thursday. Grains and various agricultural commodities are still in a bear market, and since I generally follow trends and try not to pick bottoms or tops, it makes sense to short JJG at this stage of the game.
Picture
That’s it for this week’s market recap,

Best Regards and have another great trading week!

** Special Announcement**

We are close to launching a stocks alert service. Please sign-up for our mailing list to be the first to take advantage of the discounted membership once it becomes available!


Alexander Berger (www.MasterChartsTrading.com)

0 Comments
<<Previous
    Picture
    Picture
    Subscribe to our mailing list!
    Picture
    Picture

    Archives

    January 2023
    December 2022
    November 2022
    October 2022
    September 2022
    August 2022
    July 2022
    June 2022
    May 2022
    April 2022
    March 2022
    February 2022
    January 2022
    December 2021
    November 2021
    October 2021
    September 2021
    August 2021
    July 2021
    June 2021
    May 2021
    April 2021
    March 2021
    February 2021
    January 2021
    December 2020
    November 2020
    October 2020
    September 2020
    August 2020
    July 2020
    June 2020
    May 2020
    April 2020
    March 2020
    February 2020
    January 2020
    December 2019
    November 2019
    October 2019
    September 2019
    August 2019
    July 2019
    June 2019
    May 2019
    April 2019
    March 2019
    February 2019
    January 2019
    December 2018
    November 2018
    October 2018
    September 2018
    August 2018
    July 2018
    June 2018
    May 2018
    April 2018
    March 2018
    February 2018
    January 2018
    December 2017
    November 2017
    October 2017
    September 2017
    August 2017
    July 2017
    June 2017
    May 2017
    April 2017
    March 2017
    February 2017
    January 2017
    December 2016
    November 2016
    October 2016
    September 2016
    August 2016
    July 2016
    June 2016
    May 2016
    April 2016
    March 2016
    February 2016
    January 2016
    December 2015
    November 2015
    October 2015
    September 2015
    August 2015
    July 2015
    June 2015
    May 2015
    April 2015
    March 2015
    February 2015
    January 2015
    December 2014
    November 2014
    October 2014
    September 2014
    August 2014
    June 2014
    May 2014
    April 2014
    March 2014
    February 2014
    January 2014

    RSS Feed

  All information on MasterChartsTrading.com is for educational and entertainment purposes only, and should not be construed as a recommendation to buy, sell or sell-short said securities. Read full disclaimer.