|
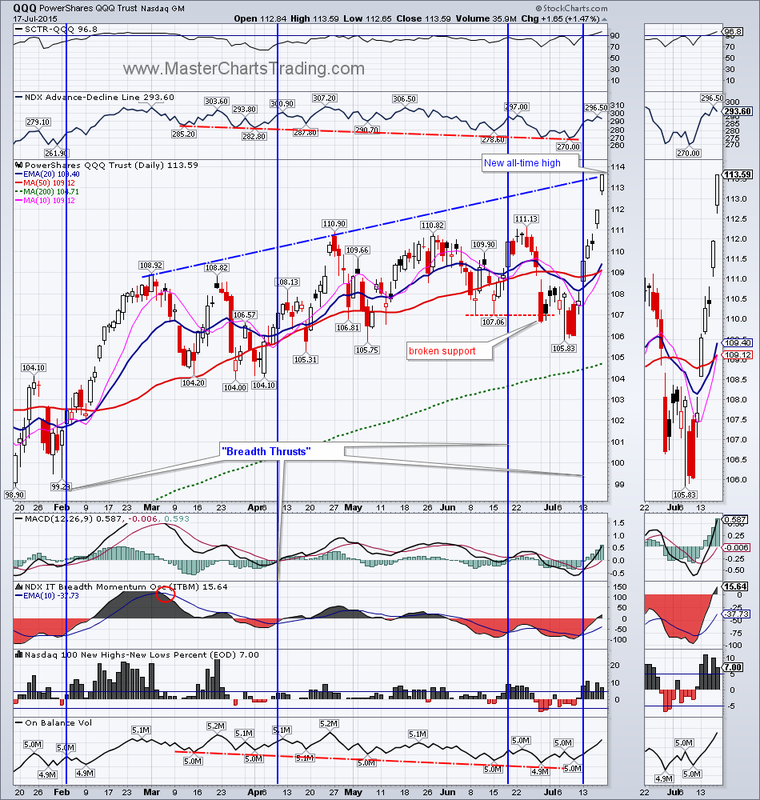
The markets again managed to surprise many observers this week. $SPX turned around from a close below the 200-day moving average and gained 2.41%, while QQQ closed at all time highs. The resilience of this bull market is undeniable and investors are exhibiting appetite for risk.
|
|
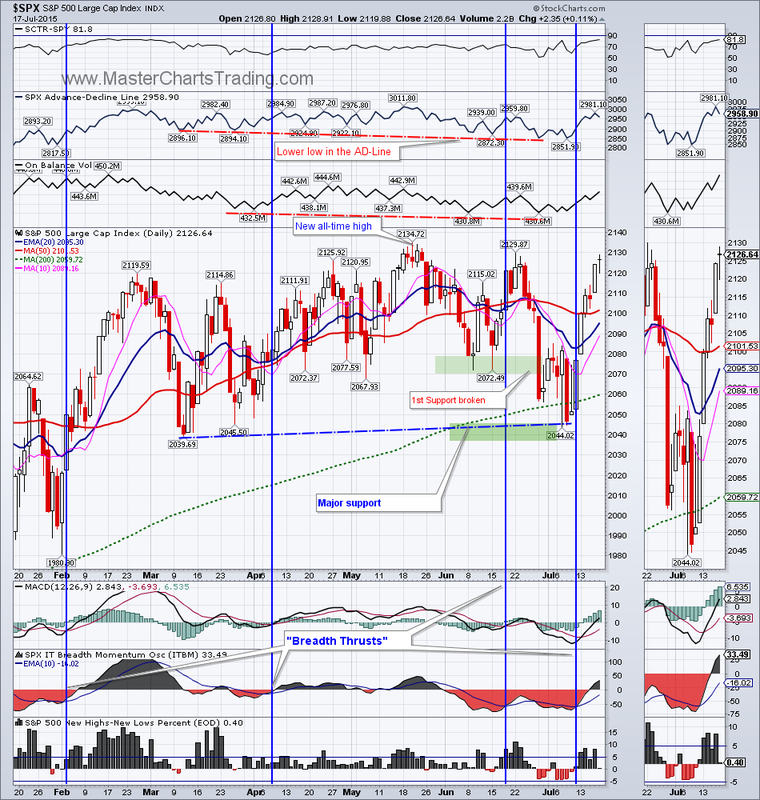
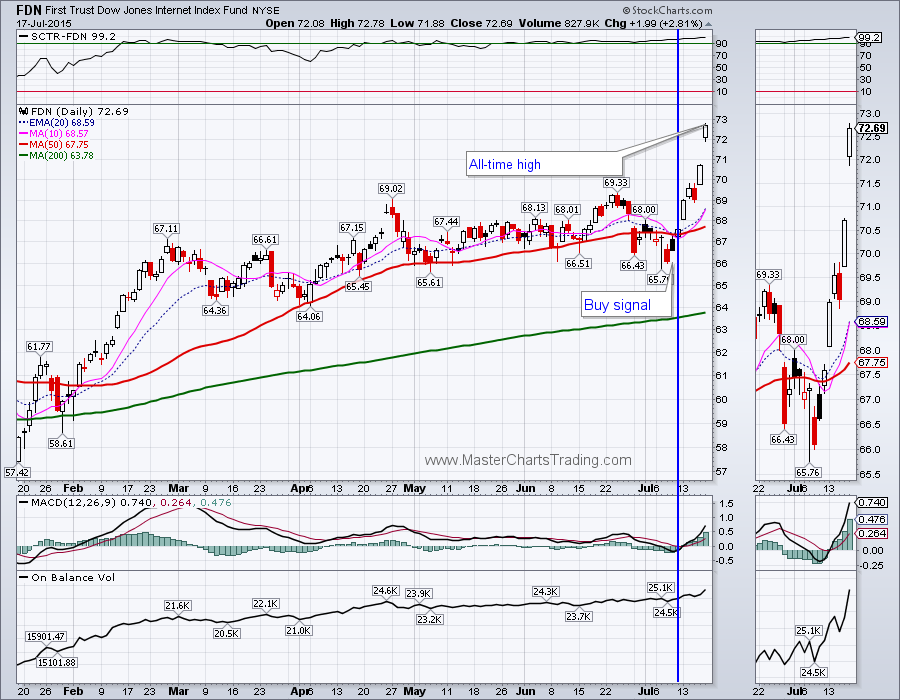
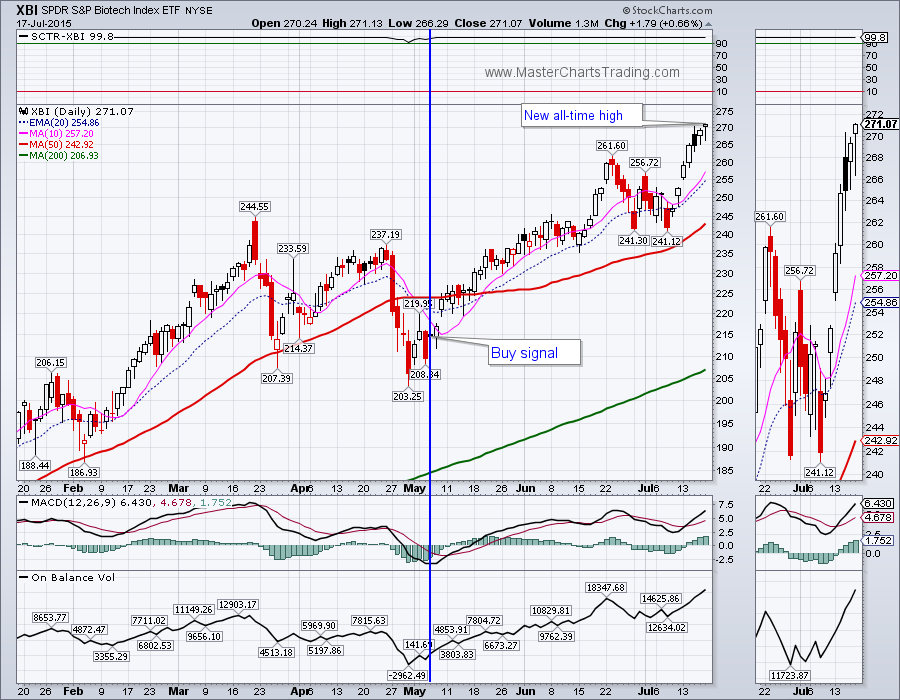
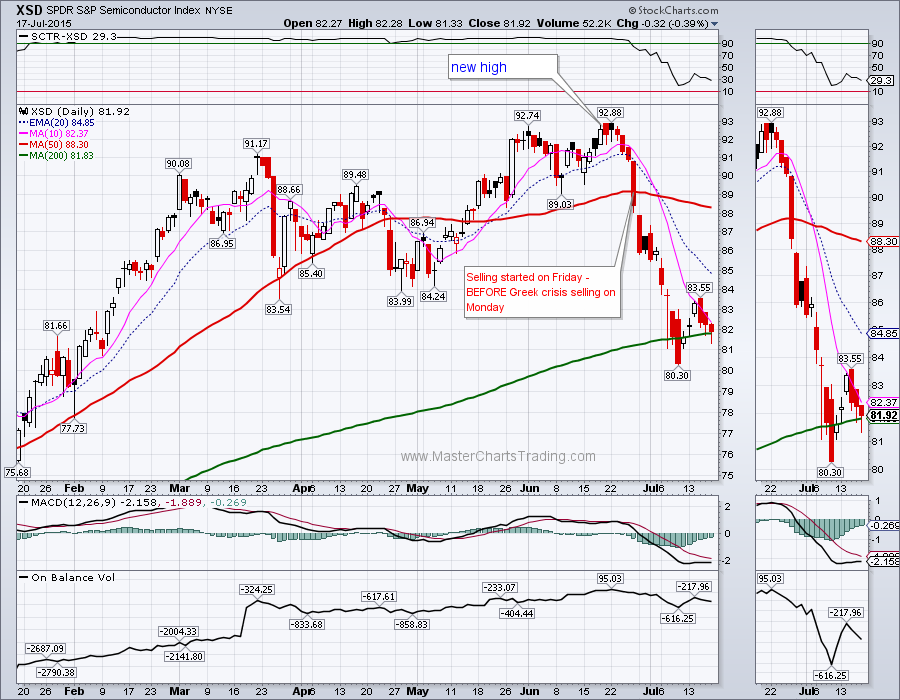
Minor divergences in the market breadth for $SPX still are present on the charts, but with any more upside, I think these would be worked-off. Similar picture on QQQ: I would like to see the rest of the index catch up to Google, Amazon, Netflix and Facebook. It looks like the big names (FDN) and high momentum (XBI) are pushing higher, while there is some pronounced weakness in the semiconductors sector (XSD).
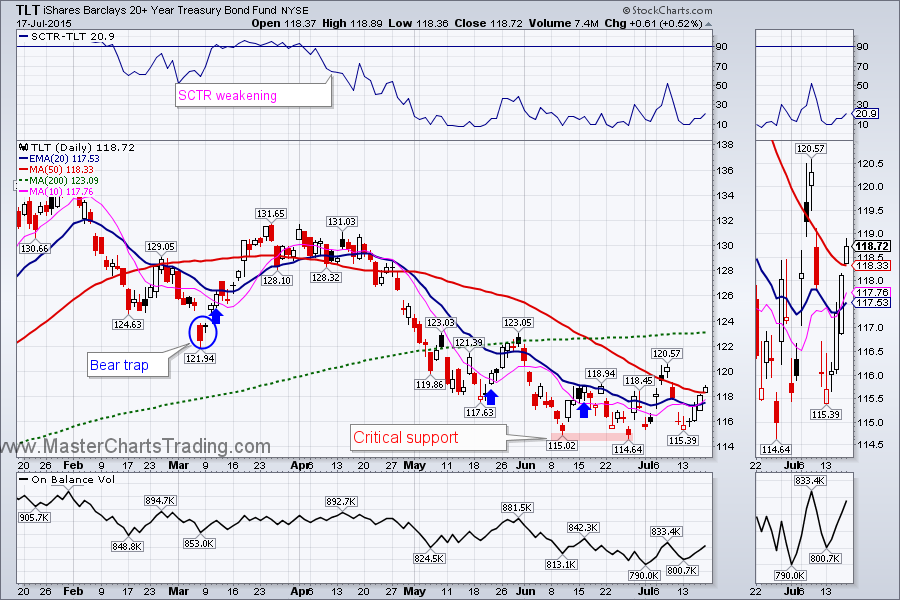
After if was all said and done, bonds did not have such a bad week. TLT gained 2.4% for the week and held the critical support for the 3rd time. TLT managed to close above its 50-day moving average. There are still lots of overhead resistance levels, but this is a first step. Again, if the critical support level around $115 is breached, I will treat TLT as a bearish security. For now I still think TLT is weakly bullish.
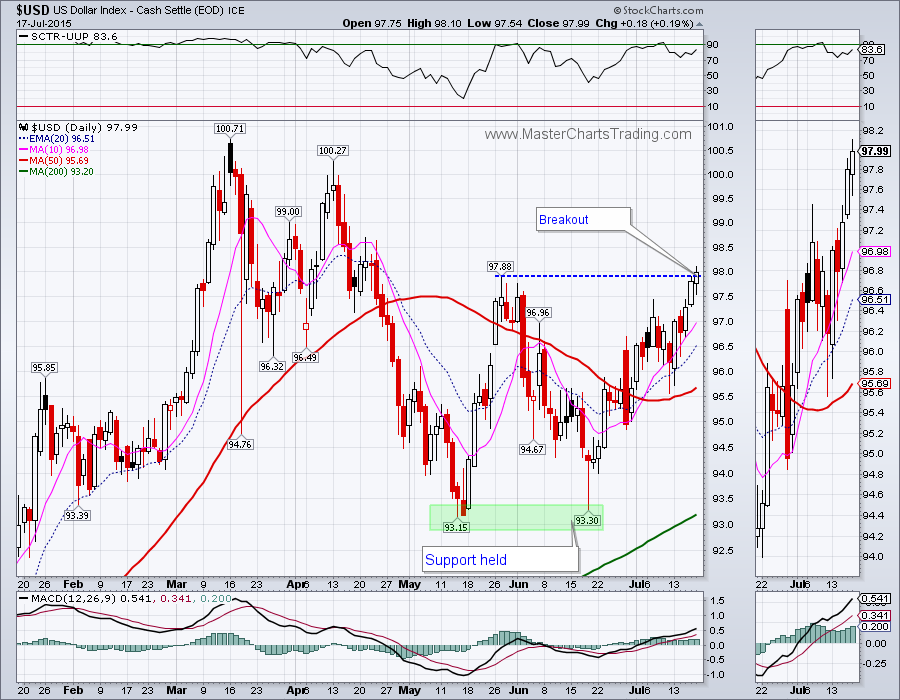
The dollar index also had a very strong week. On Friday $USD managed to close above its mid-May high on a bullish looking candlestick. I think $USD is ready to challenge the recent March and April highs. Should this happen it will weigh on commodities that are already under significant pressure.
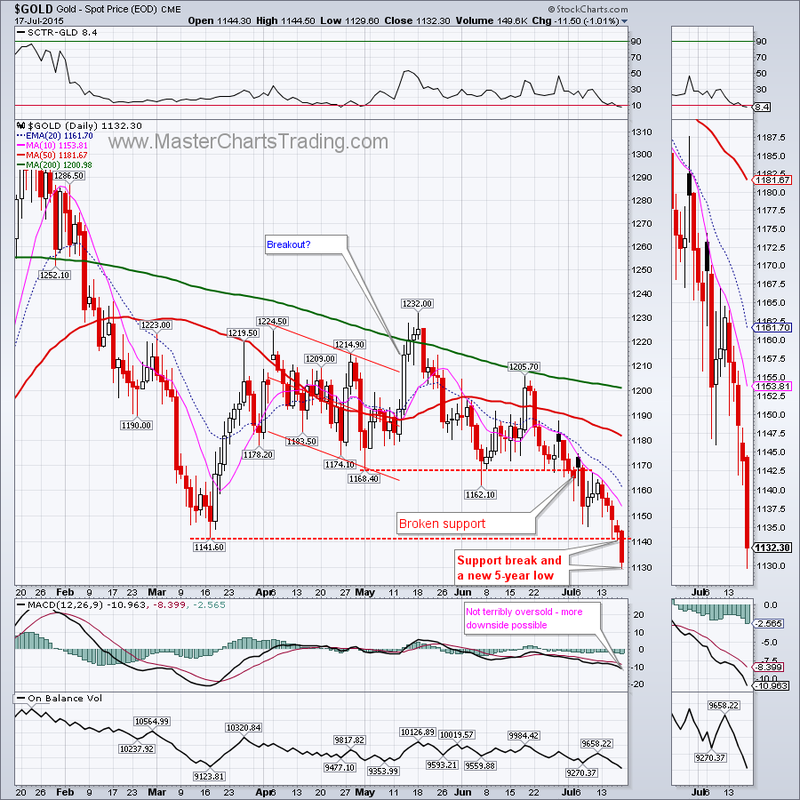
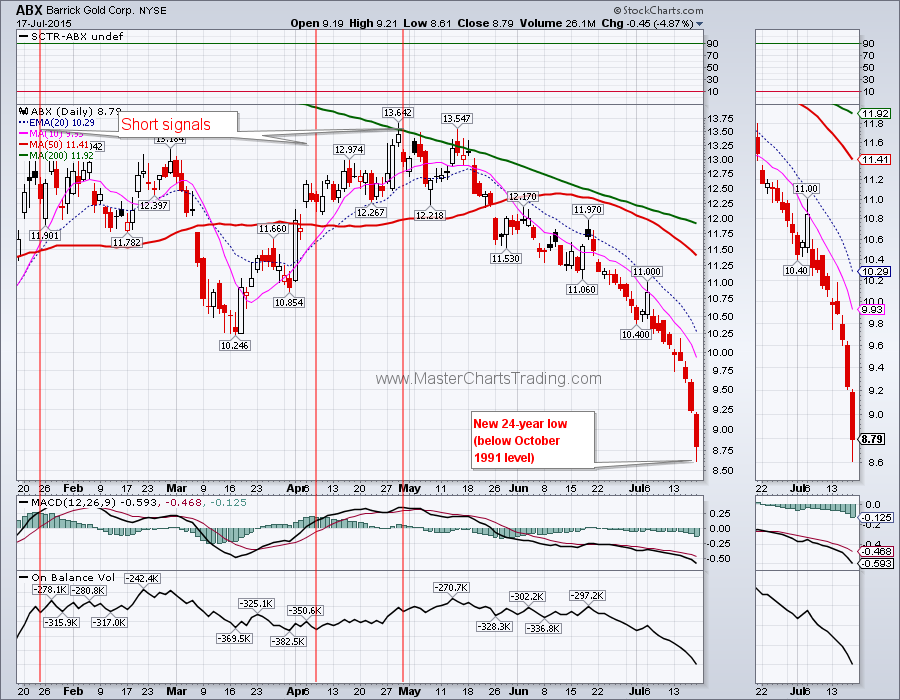
Precious metals of all flavors and their miners had some of the worse weeks in many years (Barrick Gold closed at a 24-year low). Gold broke below March low at $1141.60 and touched a 5-year low on Friday, but closed just shy of it at $1132.30. Gold is still not terribly oversold (as compared to other instances when it hit new lows) so more downside is very much possible. Did I mention gold is bearish?
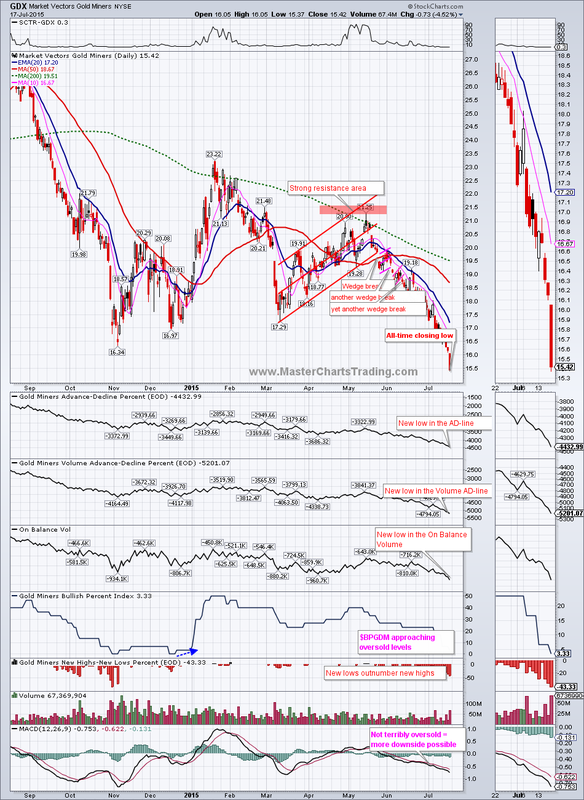
Not to be outdone, the gold miners ETF – GDX hit an all-time closing low on Friday. GDX broke below its November low to end the week at $15.42. In the past market recap videos I mentioned that the market breadth for GDX was registering new lows BEFORE the ETF itself did so. This was a classic case of a bearish divergence.
GDX is not that oversold according to MACD, but it does appear that the gold miners are approaching some sort of a selling climax (the Bullish Percent Index ($BPGDM) is at only 3.33%) so I would not rule out a short covering rally of some sort in the near term. Again, GDX is a bearish security, so I am not even going to try to pick bottoms, I would rather wait for a rebound to go short again. If/when GDX becomes bullish; I will reverse my thinking and start looking for buying opportunities.
live GDX chart
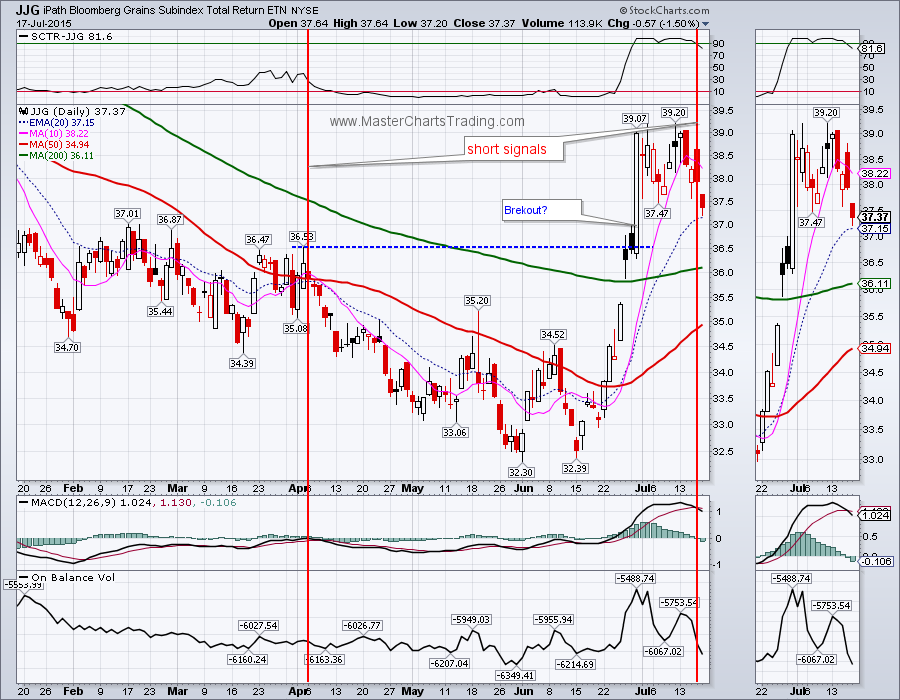
Several weeks ago we had what appeared to be a bona fide breakouts in the “soft” agricultural commodities. I wanted to see if these breakouts would hold or not. I think many commodities are showing signs of a failure. For example JJG – grains sub-index fund ETN that holds futures contracts for corn, wheat and soybeans – went on our short signal on Thursday. Grains and various agricultural commodities are still in a bear market, and since I generally follow trends and try not to pick bottoms or tops, it makes sense to short JJG at this stage of the game.
That’s it for this week’s market recap,
Best Regards and have another great trading week!
** Special Announcement**
We are close to launching a stocks alert service. Please sign-up for our mailing list to be the first to take advantage of the discounted membership once it becomes available!
Alexander Berger (www.MasterChartsTrading.com)
Best Regards and have another great trading week!
** Special Announcement**
We are close to launching a stocks alert service. Please sign-up for our mailing list to be the first to take advantage of the discounted membership once it becomes available!
Alexander Berger (www.MasterChartsTrading.com)


 RSS Feed