Master Charts Trading - Stock Market Indicators & Trade Alerts
Connect To Us!
  • MasterChartsTrading
  • Blog
  • Sign-Up
  • Members
    • Elite Trading Blog
    • Stock Speculator Blog
    • Training Library >
      • Basics of Trading
      • Risk & Trading Psych
      • Trend Identification
  • Help
    • Hall of Fame
    • Social
    • About Us
    • Contact
    • FAQs
    • Disclaimer
    • Refund Policy
    • Privacy Policy
    • What We Trade
    • Newsletter samples

Market recap friday, october 30, 2015 - SPY QQQ AGG GLD GDX GG USO UNG

10/30/2015

0 Comments

 
       The rally off of the September lows surprised many market observers, myself included. As we get closer and closer to the all-time highs, is my bearish posture still warranted or not? Let us examine the bulk of evidence. 

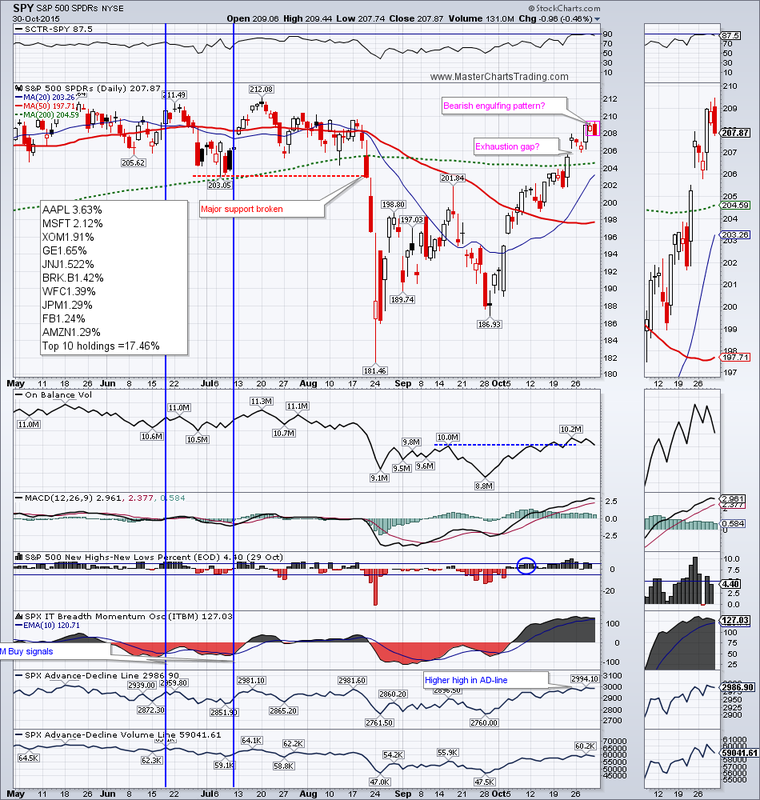
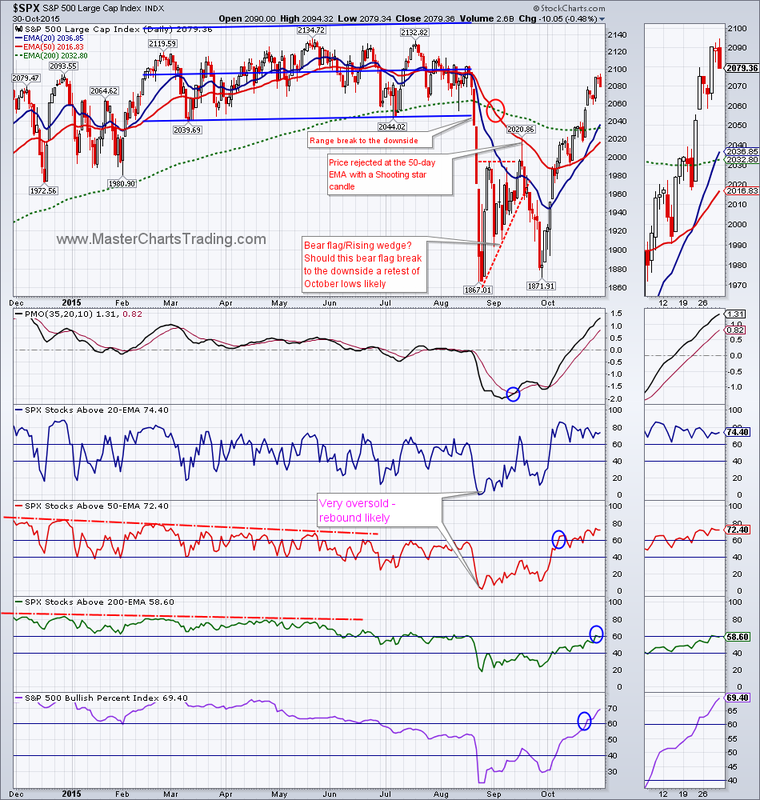
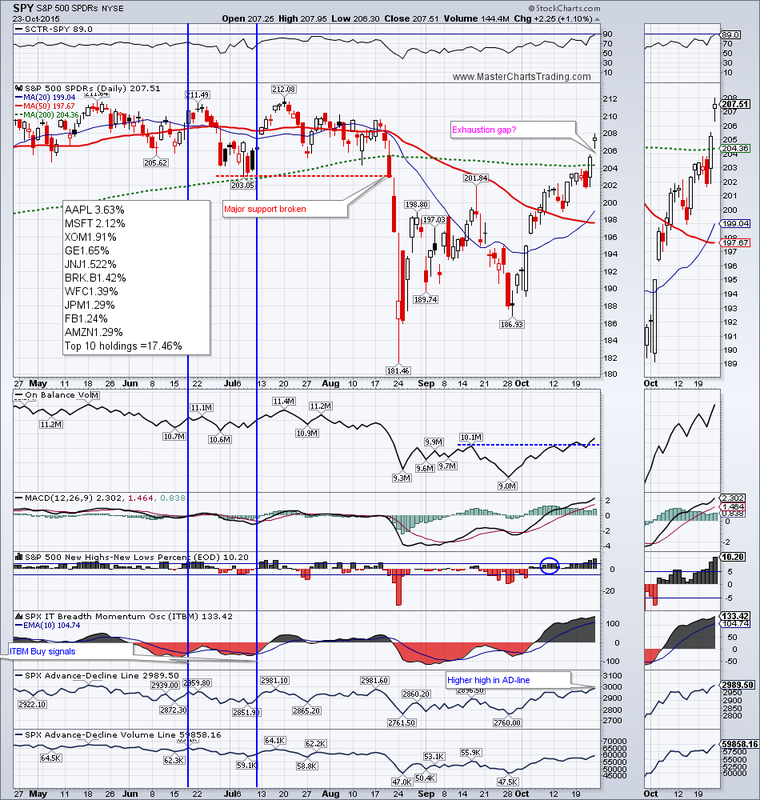
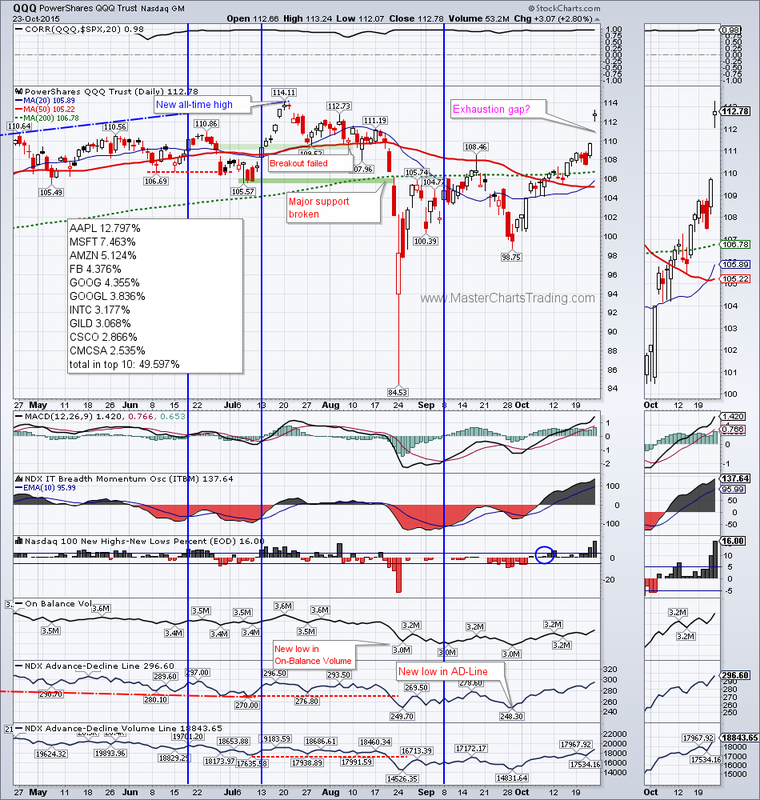
Trend indicators are still firmly in the bearish camp. If you look at the 50-day moving average, you will notice that it is still below the 200-day moving average. The same goes for 50-day and the 200-day exponential moving averages. These facts alone are enough to set a bearish bias. But as I will show, there are quite a bit of false signals with this system. 

Charts for SPY and $SPX
       What about the market breadth?
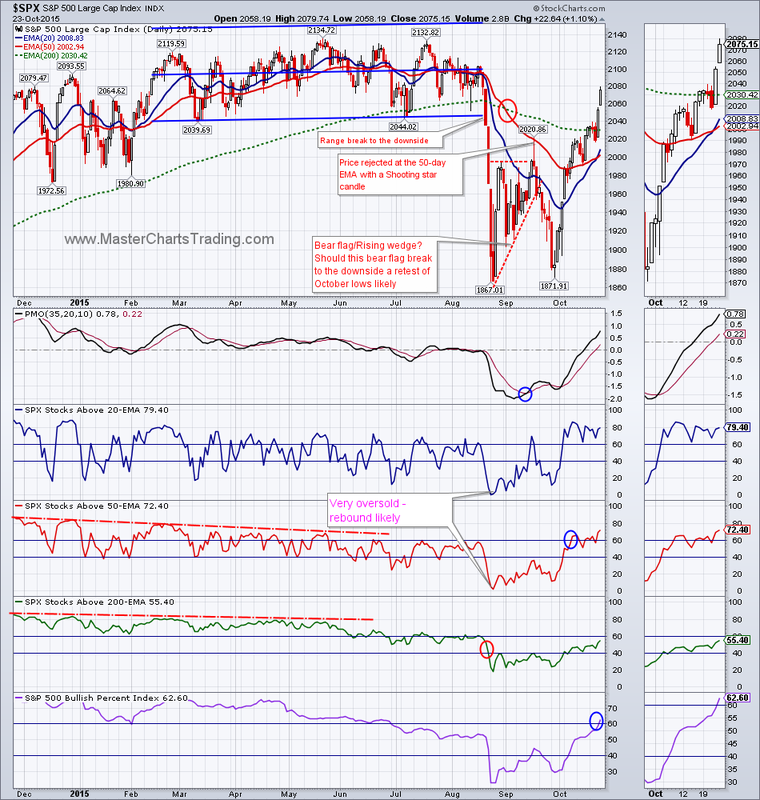
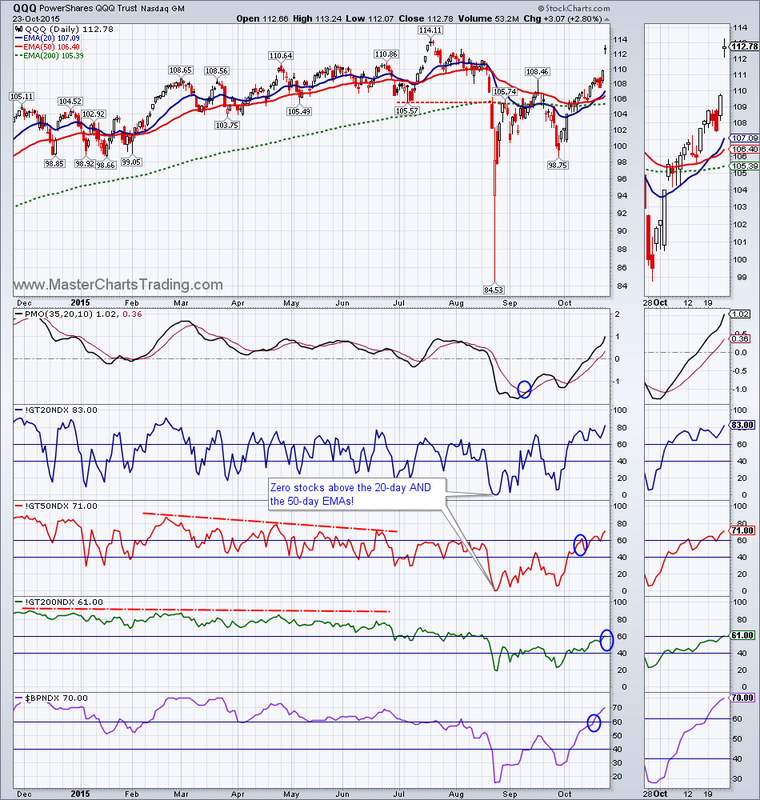
​ New highs-new lows indicator for $SPX has pushed above the 5% threshold – it is a positive sign. Percent of stocks above the 50 and the 200-day exponential moving averages also are now in the bullish camps with closes above the 60 percent. Even the bullish percent index for the $SPX was able the clear the 60% mark – pretty amazing feat since just a few month ago it was hovering around 20!
Picture
Picture
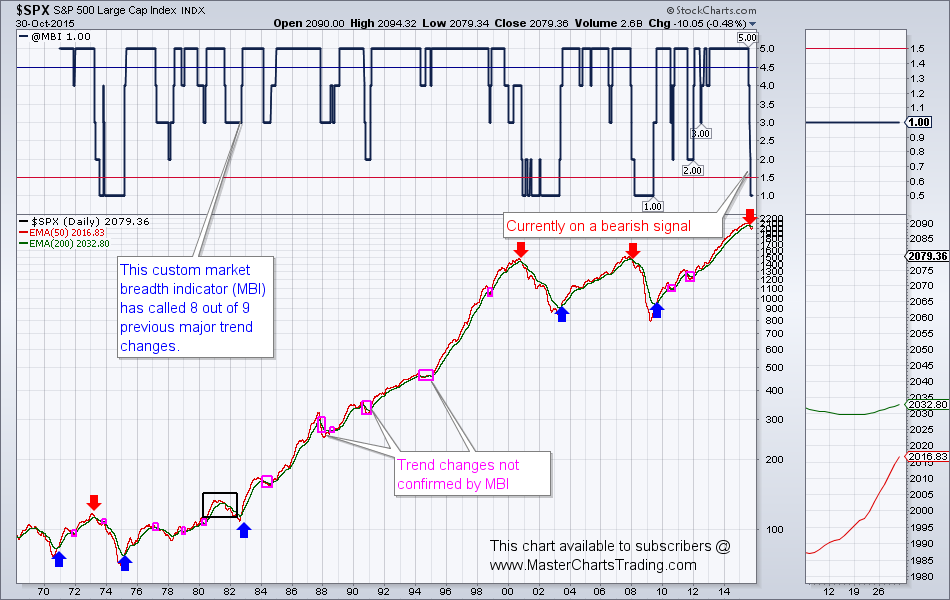
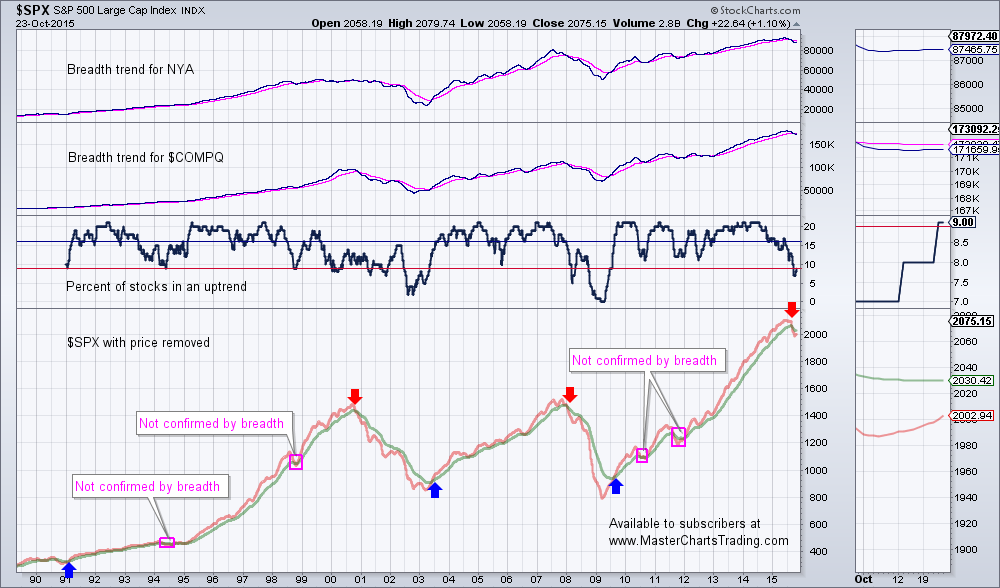
Last week I presented my custom market breadth indicator (MBI) and mentioned that it called all 5 major trend changes since the 1990. This week I was able to get even more data and tested the same indicator going all the way back to the 1970. The data still looks rather impressive: MBI called 8 out of 9 major trend changes for the S&P 500. This is an 89% success rate. There was one whipsaw during the 1981-1982 bear market that MBI failed to catch, but it was a rather mild bear market with peak to trough loss of about 27%. However MBI was able to exclude 13 false trend changes (as defined by 50-day EMA falling below the 200-day EMA) so that was quite helpful. Currently this same indicator is showing that we are in the beginning stages of a bear market. With an 89% success rate for my MBI, I will go with it until proven otherwise.
This chart available to subscribers at www.MasterChartsTrading.com
Picture
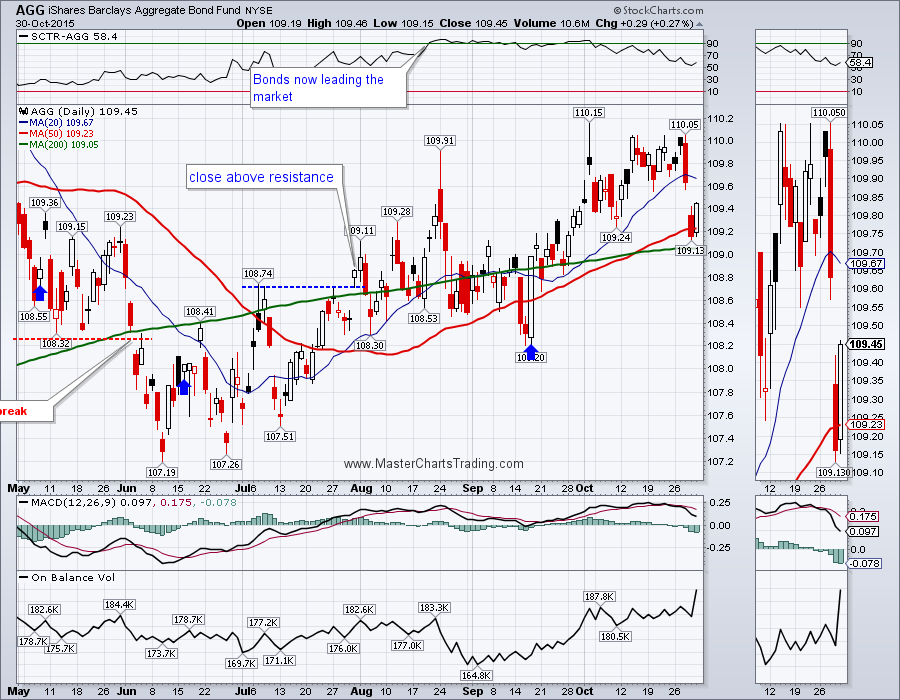
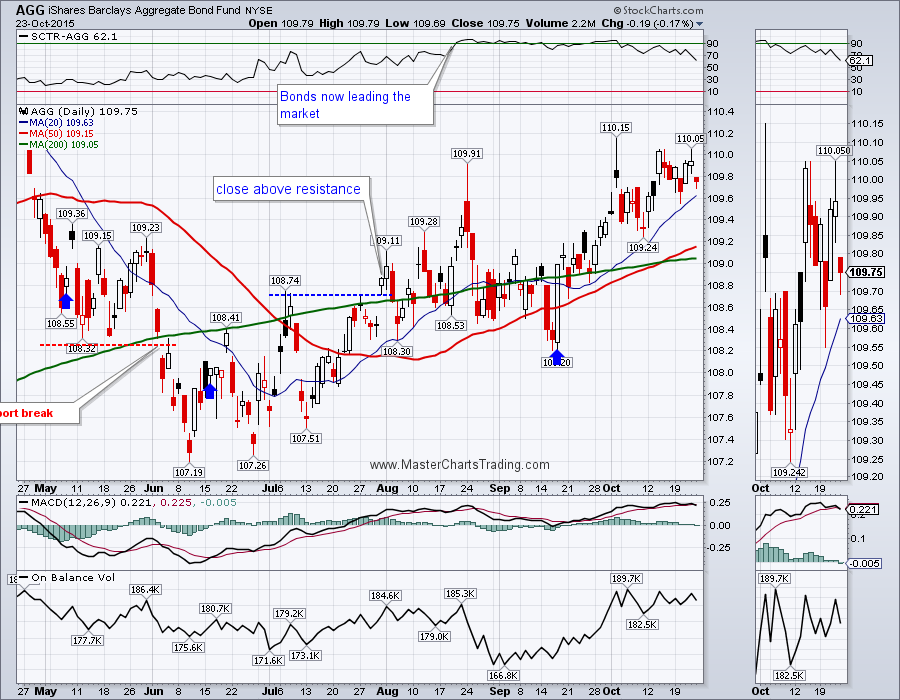
​       Have bonds reversed? Thursday AGG – the diversified bond fund had gapped down and found support just shy of the 200-day moving average. Today it seems to be going up again and attempting to fill Thursday’s gap. I think bonds are still bullish, so any significant price reduction would likely be met with more buying – especially if stocks decide to take a much needed breather. 
Chart of AGG
Picture
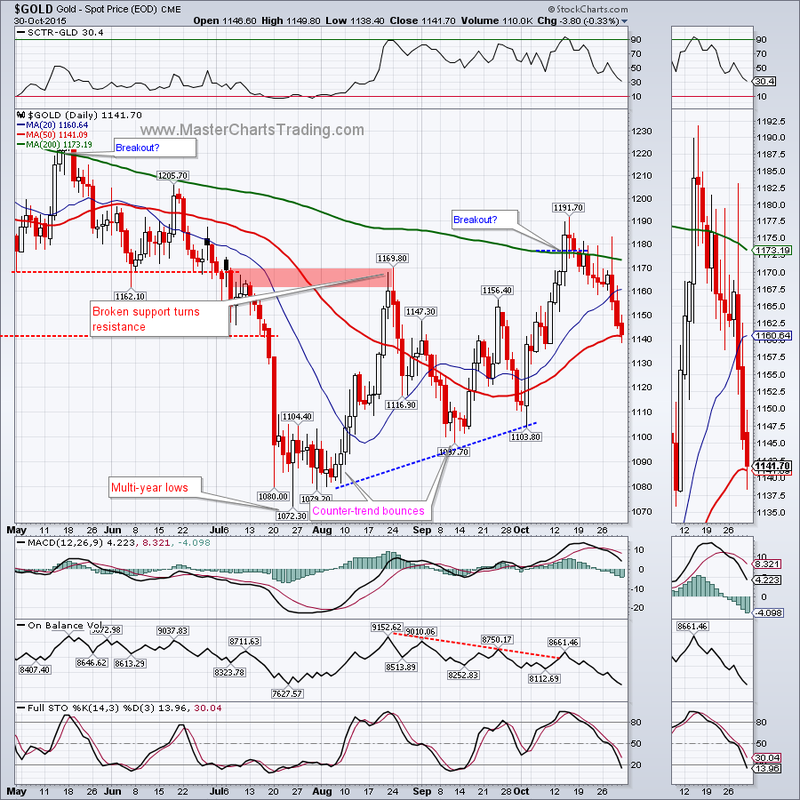
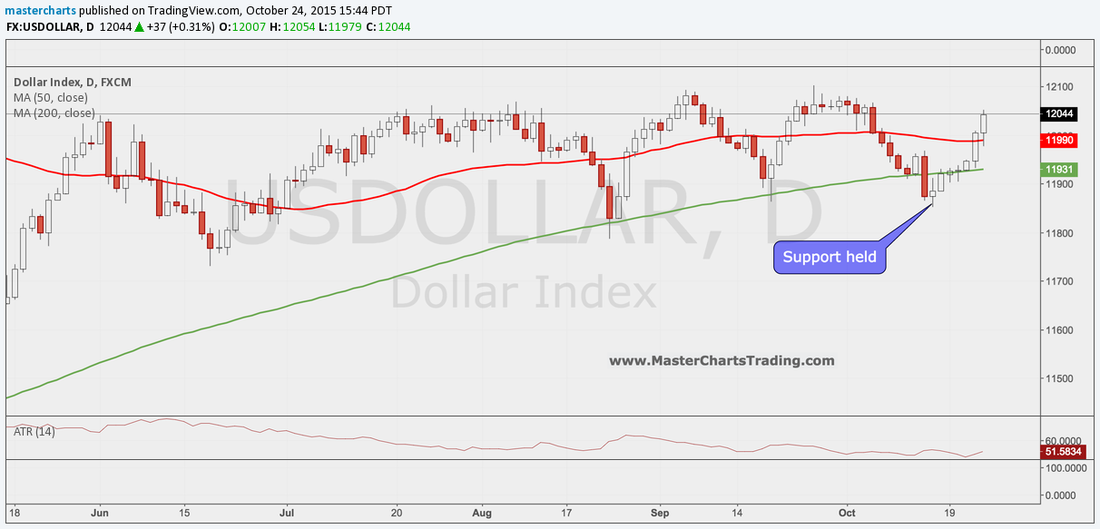
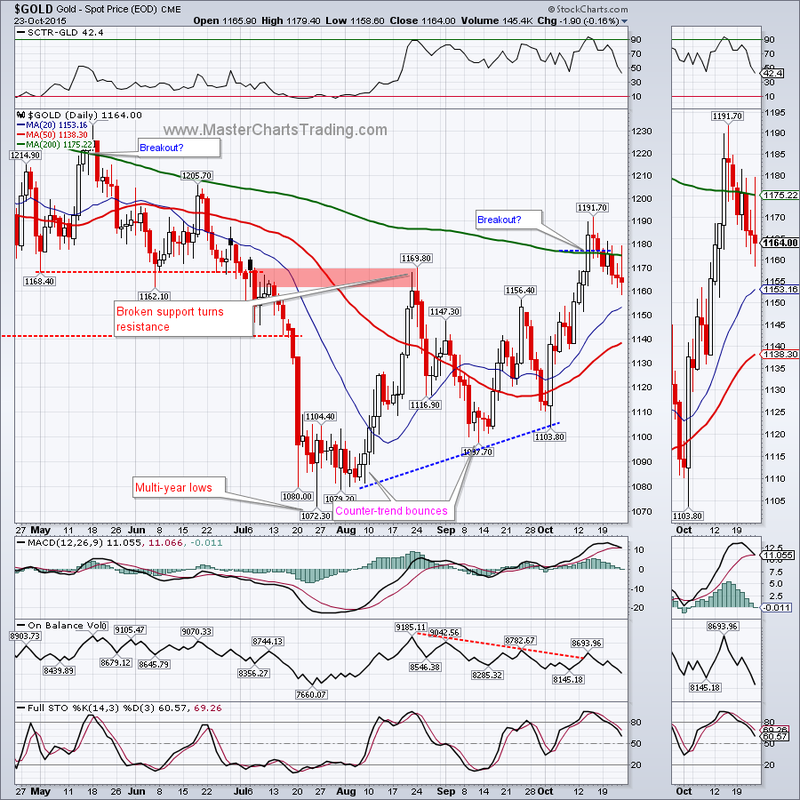
Gold had another bad week. At the beginning of October, gold managed to close above the downward-sloping 200-day moving average. At that point I questioned this possible breakout. A retest of purported support around $1160 clearly failed and gold sold-off hard on Thursday and Friday closing just above the 50-day moving average. All of this happened despite a somewhat weaker dollar. What if the dollar strengthens again and pushes to new 52-week highs? Gold will then likely come under further selling pressure.
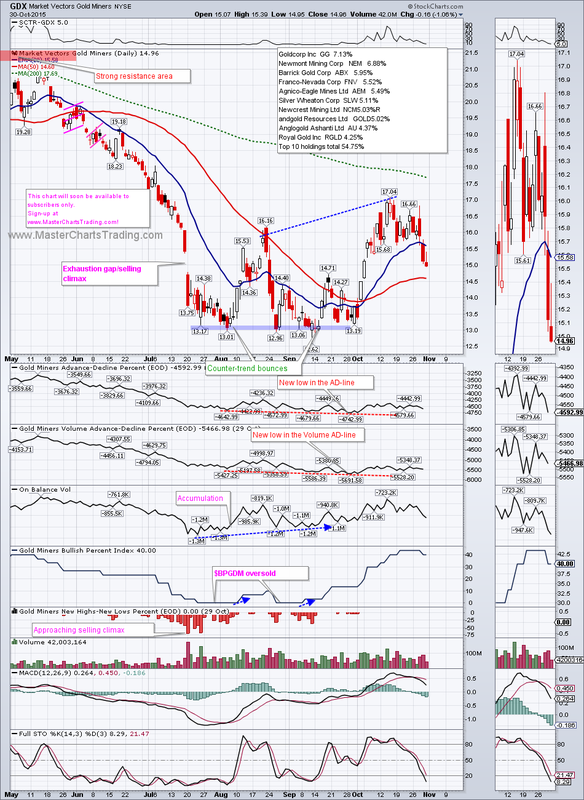
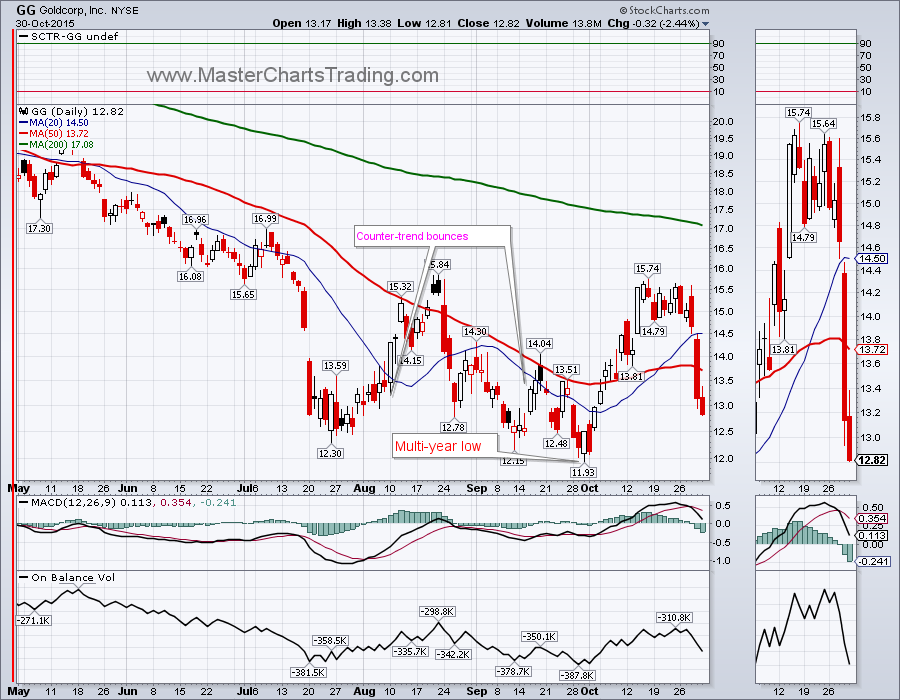
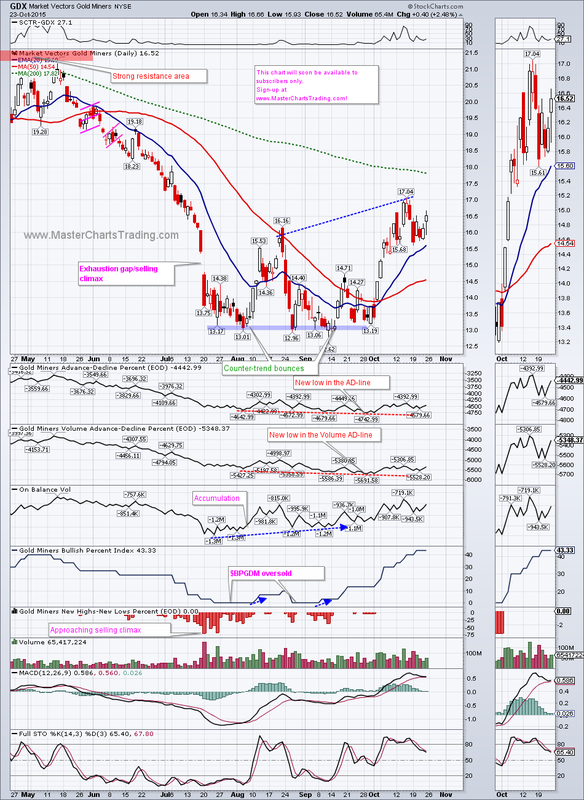
       From its peak in mid-October, gold is down around 4.5%, for the same time period GDX is down a bit over 12%. (GoldCorp, ticker GG, is down over 19% for the same period). The internals for GDX are still somewhat mixed, but seem to be rolling over to the downside. The bullish percent index is down to 40% from its peak at 43. The AD-lines for GDX continue to trend lower. Now the On-balance volume seems to be breaking its uptrend as well. There is some decent support at $14.50, but should that give we can see another retest of the $13 area.

Gold, precious metals and miners charts
Picture
Picture
Picture
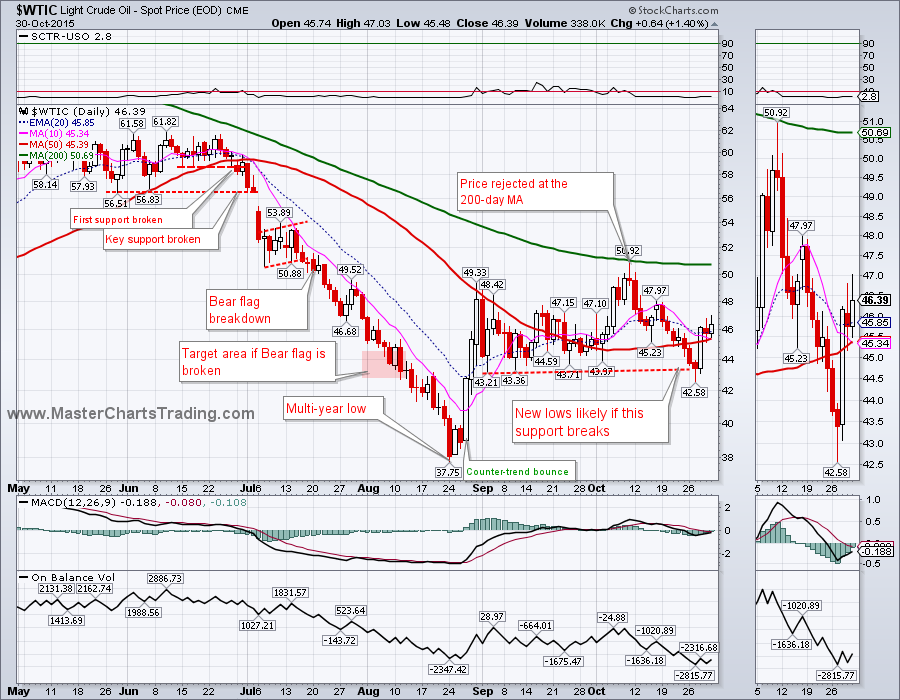
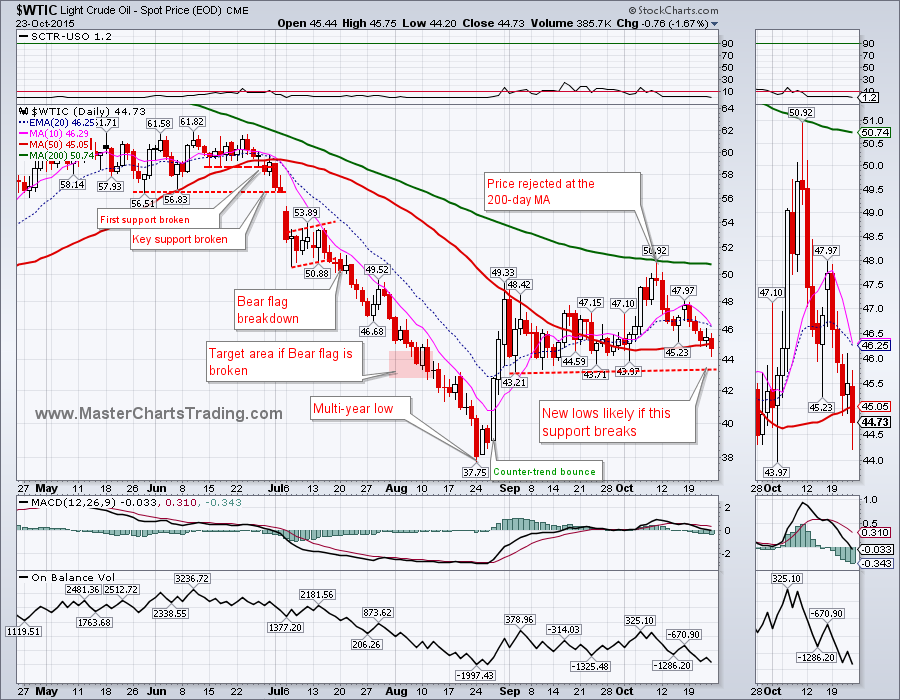
       This week oil ($WTIC) attempted a breakdown below the $43.21 mark, but the lower prices may have been rejected since we had a very strong rally on Wednesday. Will this rebound hold?

Chart of oil
Picture
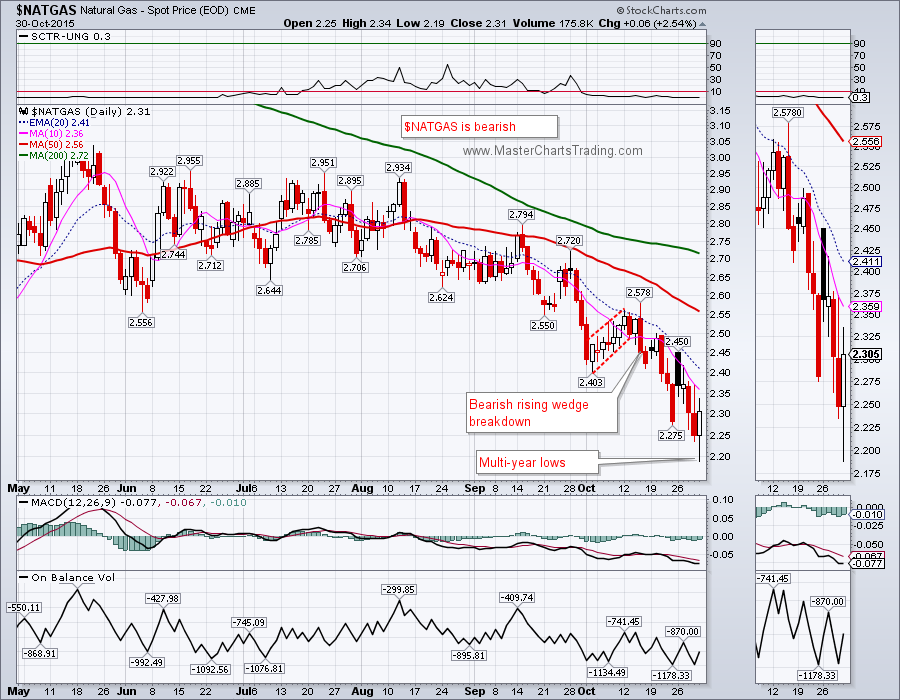
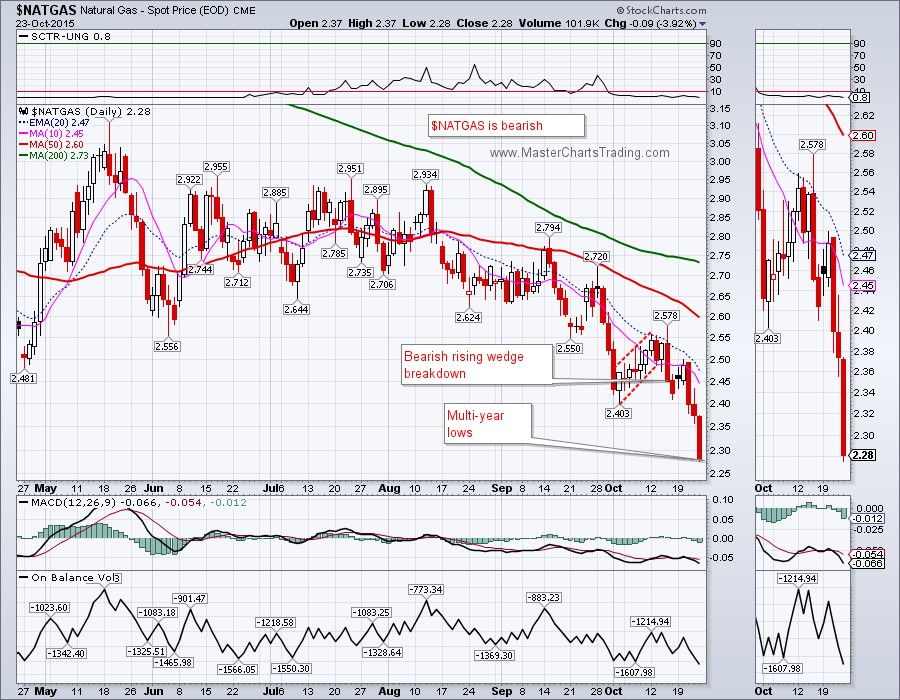
Natural gas ($NATGAS) hit multi-year lows on Friday. The sentiment for $NATGAS is quite negative and a rebound to at least $2.55 is not out of the ordinary at this point. I am not looking to bottom fish here, but should this rebound occur, would surely be on the lookout to get short again.
Chart of natural gas
Picture
That’s it for this week’s market recap,
Best Regards and have another great trading week!
 
Alexander Berger (www.MasterChartsTrading.com)
 
 
0 Comments

Market recap friday, october 23, 2015 - SPY QQQ AAPL AGG GLD GDX USO UNG

10/24/2015

0 Comments

 
In trend-following strategies, such as the one I adhere to, you have to have a bullish or bearish bias. Is the stock you are trading in a long-term uptrend, or a long-term downtrend? If in an uptrend, it makes sense to look for oversold conditions and time your entries on the long side. Vice versa: if you stock is in a long-term downtrend, it makes sense to short the rallies. 
Charts of SPY and SPX
Stocks broke down in August. As a result of this breakdown and further weakness in September, all of the indicators that I follow including those of the momentum, trend and breadth varieties turned decidedly bearish. This changed my bias from bullish to bearish. Although we had a strong rally off the September lows, and many of the market breadth indicators have indeed improved, the question is: what would it take to reverse my current bearish conviction and turn it bullish again?
Picture
Picture
What about the market breadth? Market breadth has indeed improved as more stocks are now above their 200-day exponential moving average (EMA) and the Bullish Percent indices for $SPX and QQQ are again above the 60% bullish thresholds. However these breadth indicators are not as reliable as some of the other once I use.
​
Below is a long-term daily chart of the S&P 500 ($SPX) going back all the way to 1990. During the past 25 years we had 3 bull markets and 2 bear markets. These are marked by up blue arrows and down red arrows, respectively. My 3 favorite indicators are the Breadth Trend for $NYA, Breadth Trend for $COMPQ and a third indicator that I created myself that I call – Percent of Stocks in an Uptrend. Notice that If I used only the moving average crossovers on the price chart of $SPX itself, I would have experienced 4 false signals (they are marked by pink squares). However, by using the breadth to confirm or deny my bias, as provided by moving average crossovers, I would have been able to avoid these false signals. Notice that currently breadth is confirming the signal provided by the moving average crossover and this bearish signal is yet to be negated.
Picture
​       Moving on to the higher beta QQQ. On Friday QQQ gapped up on the heels of positive reports from several large-cap technology companies and closed within 1.5% of its all-time high. As you may have heard me say in the past – stocks are highly correlated. So my previous comments about the general market still liable to a correcting action apply to QQQ. Apple accounts for over 12% of QQQ holdings and reports on October 27. Could this be the classic buy the rumor, sell the news setup?
Charts of QQQ (scroll down) and AAPL
Picture
Picture
Picture
General bonds (AGG) were literally unmoved by all the excitement of the stock market. AGG was basically unchanged for the week (down 0.02%). Why would bonds be holding up so well, if stocks were nearing all-time highs again? Usually this indicates that a healthy amount of fear is still present in the markets.

Chart of AGG
Picture
​       Last week I mentioned that the dollar may have held support, this week we saw a strong rally in the dollar. The dollar is not yet overbought, so we could easily see a breakout above the recent highs.
Picture
Strength in the dollar is again putting pressure on commodities. On October 14, gold broke above the 200-day moving average for the first time since May of this year. Since then gold was sliding down and is currently in the process of retesting the resistance level (now turned support). Should this support around $1160 give, we could easily see a pullback to the $1100 area, or even lower.
         GDX was choppy and volatile, as various market forces pulled the gold miners up or down. The Chinese rate cut is bullish for gold, while strong dollar is bearish. GDX along with gold is long-term bearish and currently overbought – a recipe for a drop lower.
Charts of gold, gold miners and precious metals
Picture
Picture
 Strong dollar is not helping oil ($WTIC) either. Several weeks ago an attempted rally was stopped in its tracks by the 200-day moving average at around $50. Today oil closed below the 50-day moving average again. This is an ominous sign. It seems very likely that a retest of the breakout is at hand. A close below $43 would cause a flood of sell orders to execute and new lows would be likely thereafter.
Chart of oil
Picture
Several weeks ago I pointed out a bear wedge on the chart of natural gas ($NATGAS). We had a clear breakdown of that wedge last week, a small rebound and another plunge – to new multi-year lows. Multi-year lows are very bearish. However, a rebound of some sort is now likely, since $NATGAS is quite oversold following an over 20% drop since mid-August. 

Chart of natural gas
Picture
​That’s it for this week’s market recap,
Best Regards and have another great trading week!
 
Alexander Berger (www.MasterChartsTrading.com)
0 Comments
<<Previous
    Picture
    Picture
    Subscribe to our mailing list!
    Picture
    Picture

    Archives

    February 2023
    January 2023
    December 2022
    November 2022
    October 2022
    September 2022
    August 2022
    July 2022
    June 2022
    May 2022
    April 2022
    March 2022
    February 2022
    January 2022
    December 2021
    November 2021
    October 2021
    September 2021
    August 2021
    July 2021
    June 2021
    May 2021
    April 2021
    March 2021
    February 2021
    January 2021
    December 2020
    November 2020
    October 2020
    September 2020
    August 2020
    July 2020
    June 2020
    May 2020
    April 2020
    March 2020
    February 2020
    January 2020
    December 2019
    November 2019
    October 2019
    September 2019
    August 2019
    July 2019
    June 2019
    May 2019
    April 2019
    March 2019
    February 2019
    January 2019
    December 2018
    November 2018
    October 2018
    September 2018
    August 2018
    July 2018
    June 2018
    May 2018
    April 2018
    March 2018
    February 2018
    January 2018
    December 2017
    November 2017
    October 2017
    September 2017
    August 2017
    July 2017
    June 2017
    May 2017
    April 2017
    March 2017
    February 2017
    January 2017
    December 2016
    November 2016
    October 2016
    September 2016
    August 2016
    July 2016
    June 2016
    May 2016
    April 2016
    March 2016
    February 2016
    January 2016
    December 2015
    November 2015
    October 2015
    September 2015
    August 2015
    July 2015
    June 2015
    May 2015
    April 2015
    March 2015
    February 2015
    January 2015
    December 2014
    November 2014
    October 2014
    September 2014
    August 2014
    June 2014
    May 2014
    April 2014
    March 2014
    February 2014
    January 2014

    RSS Feed

  All information on MasterChartsTrading.com is for educational and entertainment purposes only, and should not be construed as a recommendation to buy, sell or sell-short said securities. Read full disclaimer.