Master Charts Trading - Stock Market Indicators & Trade Alerts
Connect To Us!
  • MasterChartsTrading
  • Blog
  • Sign-Up
  • Members
    • Elite Trading Blog
    • Stock Speculator Blog
    • Training Library >
      • Basics of Trading
      • Risk & Trading Psych
      • Trend Identification
  • Help
    • Hall of Fame
    • Social
    • About Us
    • Contact
    • FAQs
    • Disclaimer
    • Refund Policy
    • Privacy Policy
    • What We Trade
    • Newsletter samples

Market Recap Friday, December 24, 2015 - SPY tLT MUB PFF UUP GLD GDX USO UNG

12/26/2015

0 Comments

 
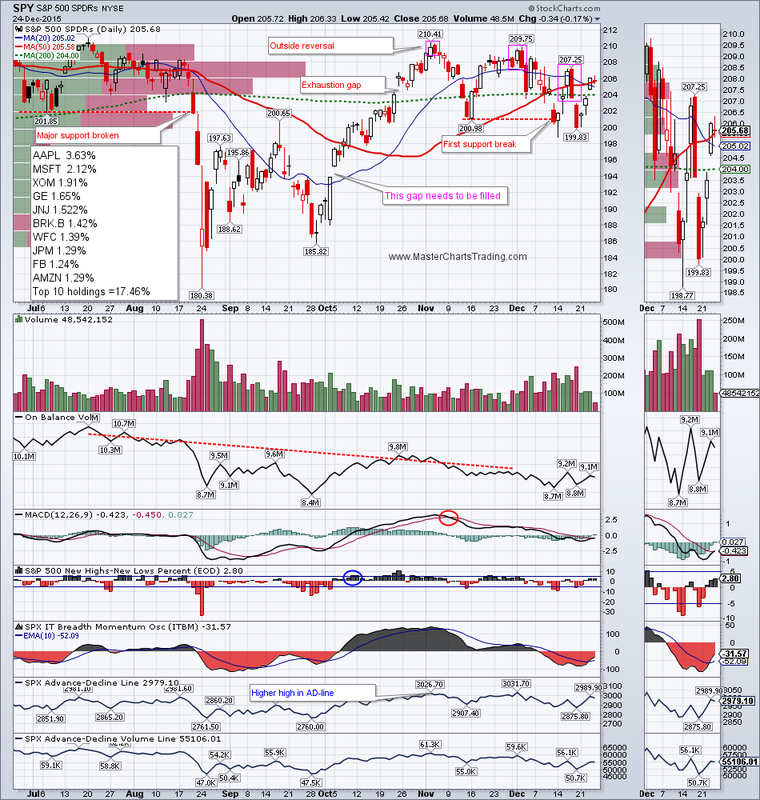
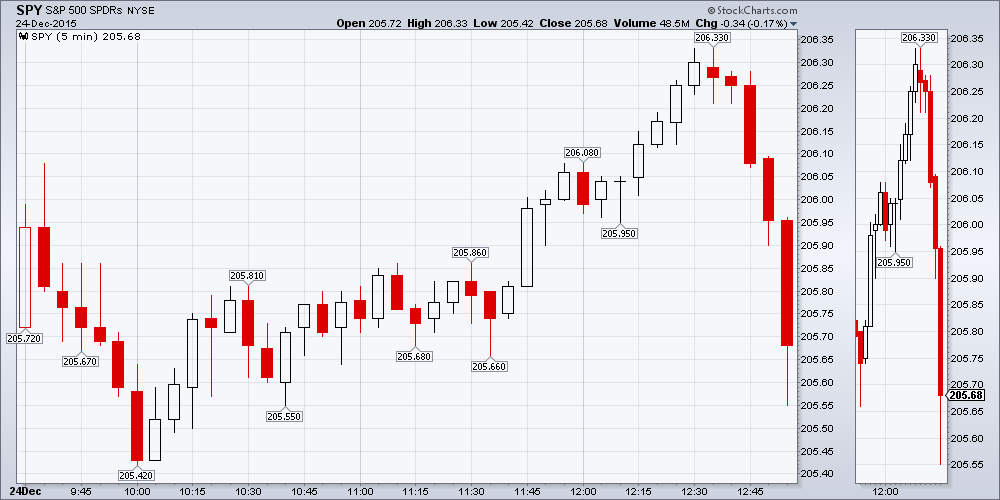
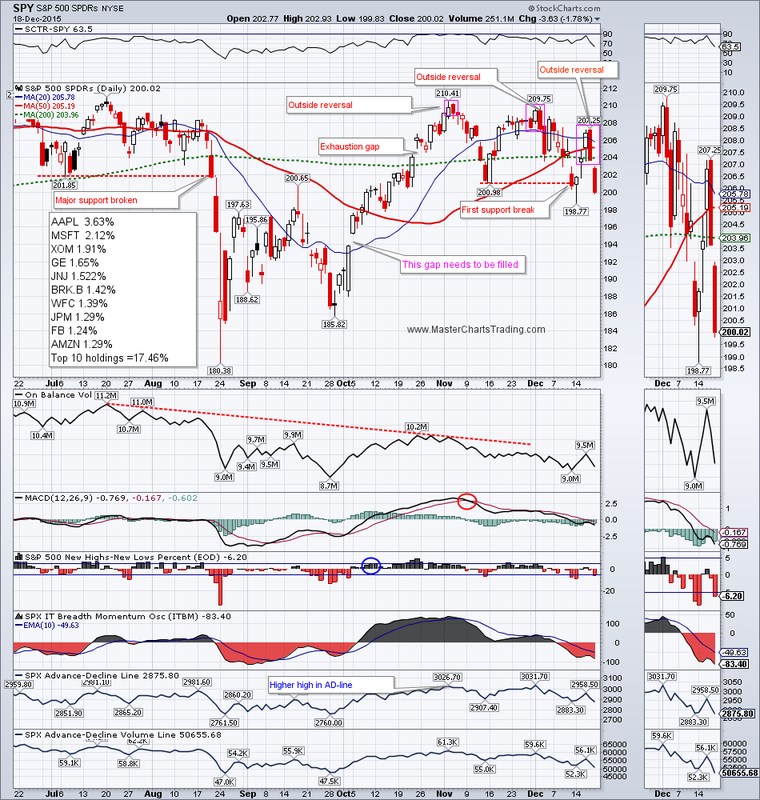
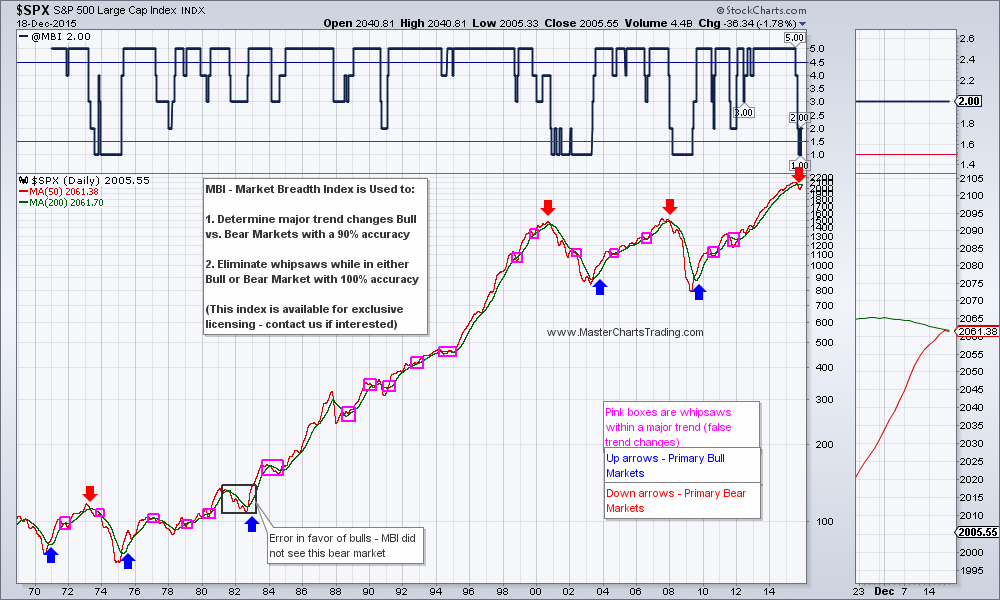
The bulls were able to make some progress during this short trading week. SPY gained almost 3% to close at $205.68. If you have been reading my writing for the past few months, you would have noticed that I have been bearish on stocks. For now the long-term bearish case remains alive and well. There is plenty of resistance in the $206-$208 area. This Christmas Eve’s action was notable for the fact that markets sold-off literally in the last 5 minutes of trading to close in the negative territory for the day. One could argue that a shooting star candlestick was printed on Friday. This was all on holiday volume though, so I would like to see more confirmation of resistance next week.
CHART OF SPY
Picture
Picture
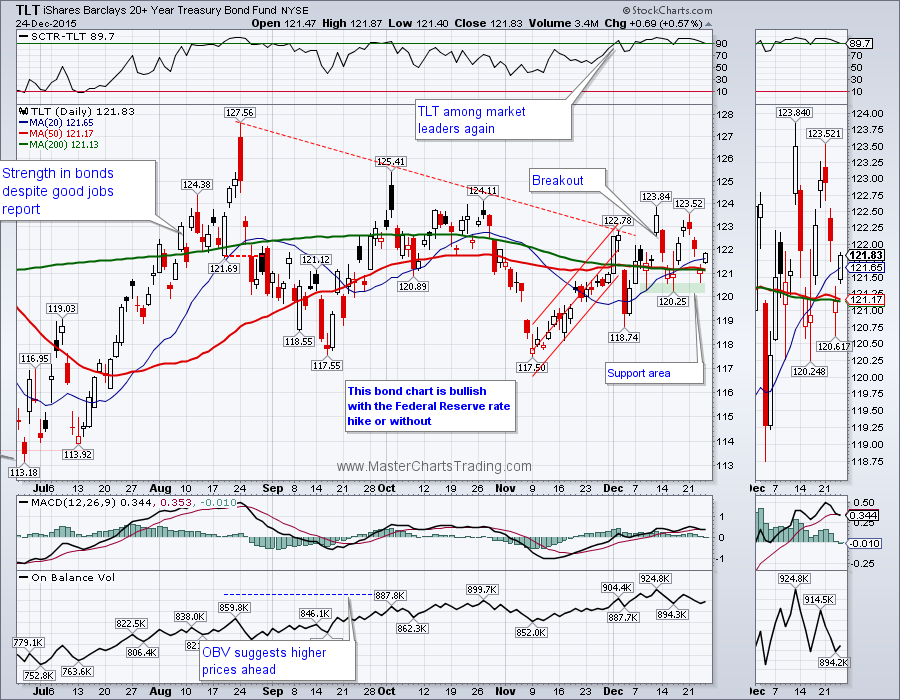
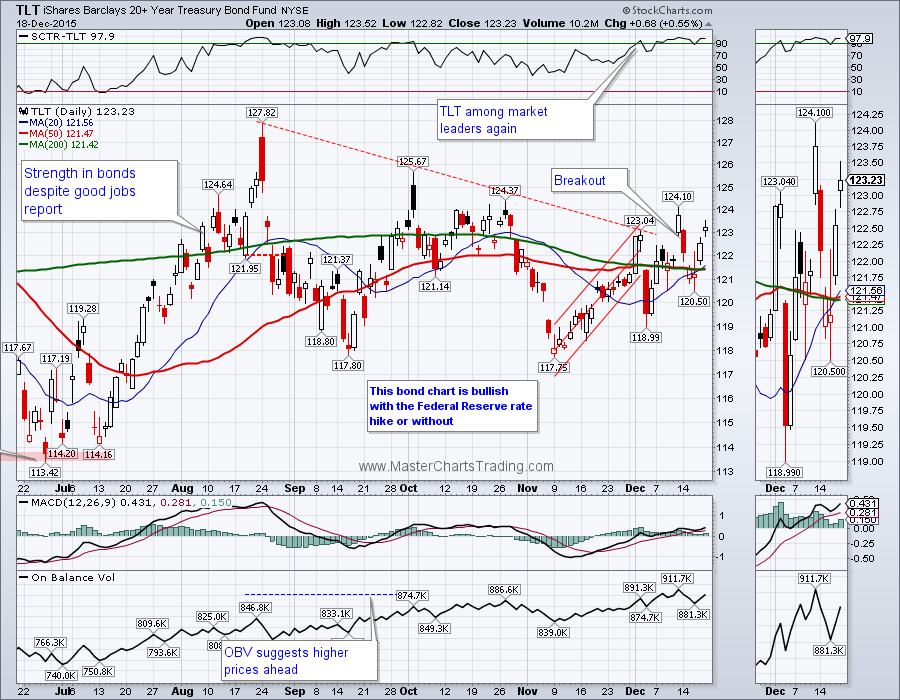
Bonds lost for the week, but I think TLT has held support for now in the $120 area and bounced back on Friday. As I mentioned last week, TLT seems to be less affected by the short-term interest rates rise, then by the general amount of fear and unease in the markets. If stocks sell-off in a more meaningful way bonds are almost guaranteed to benefit.
TLT CHART
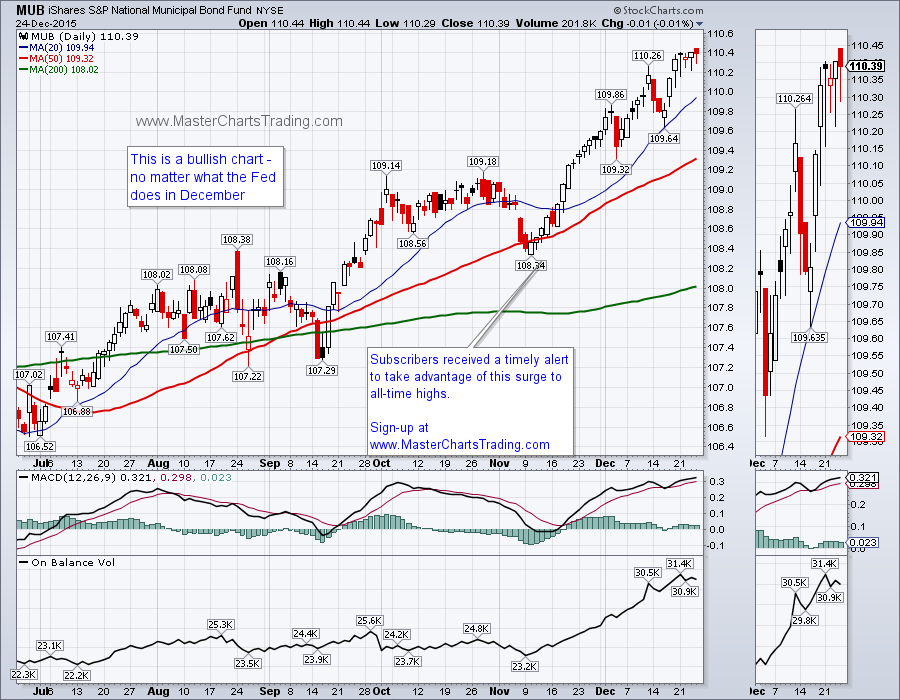
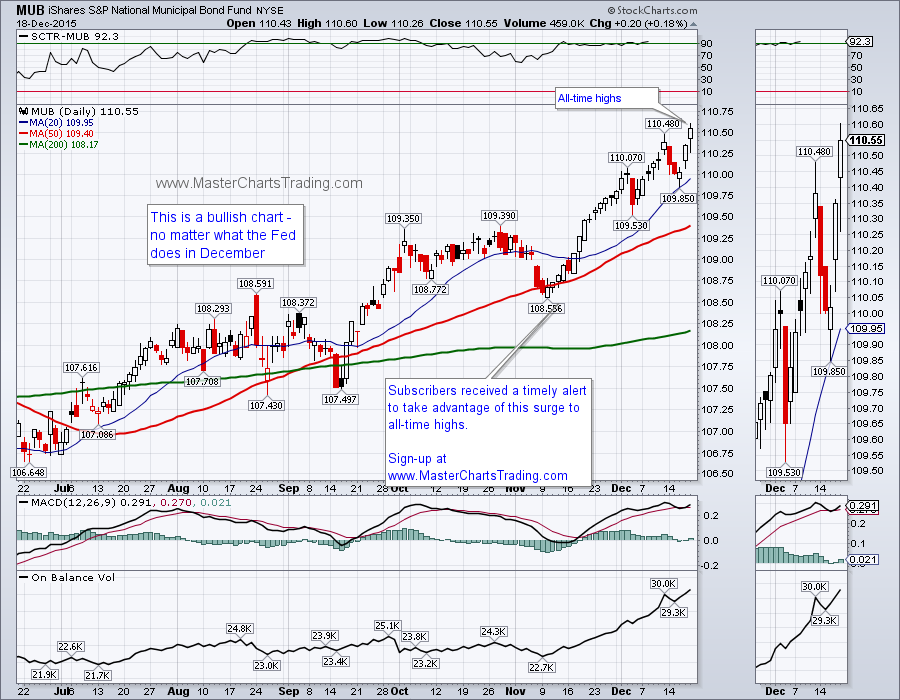
Municipal bonds pushed ever higher and made another all-time high, albeit, I think munis are now somewhat overbought and may pullback to around $109.30 or so.
MUB CHART
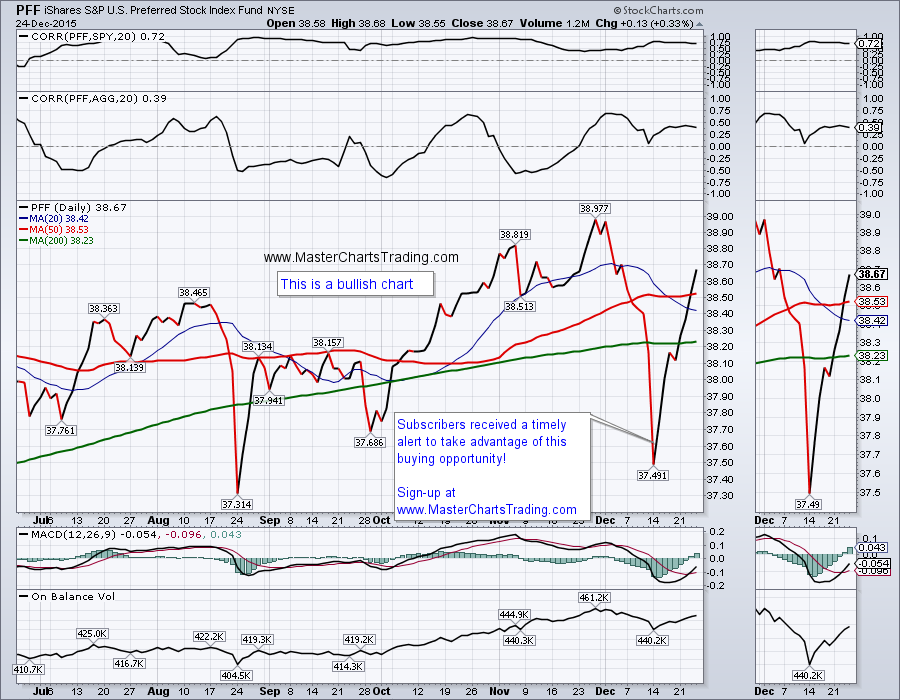
​Preferred stock fund (PFF) offered a good setup several weeks ago and here at www.MasterChartsTrading.com we went ahead and took this buying opportunity. Correlation-vise, preferred stock occupies a sort of middle ground between stocks and bonds. Owning some preferred stock could be viewed as a nice diversification tactic away from regular stocks and bonds.
CHART OF PFF

Picture
Picture
Picture
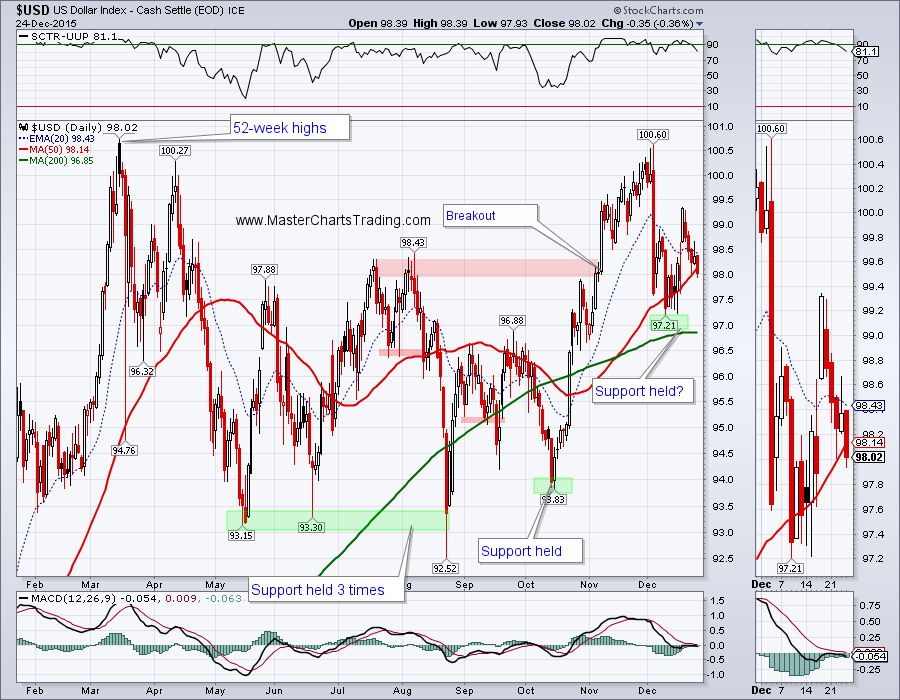
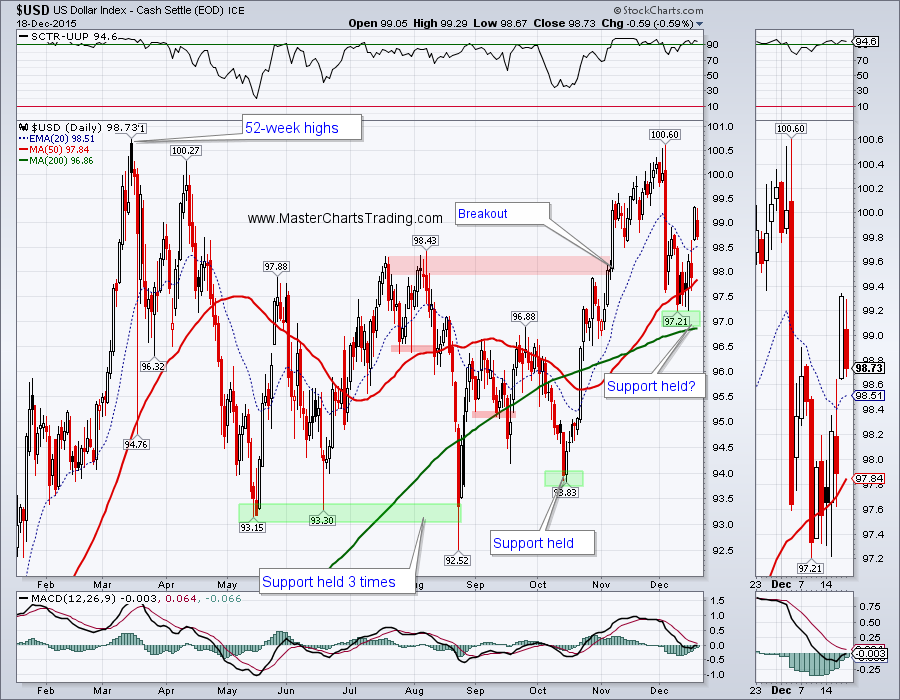
The Dollar weakened and closed below its 50-day moving average. It is looking like $USD (DXY) is headed for another retest of a support level around $97. Long-term $USD is still very much bullish, so if you trade currencies, this could be a buying opportunity once support is held. In any case, for now weaker dollar is relieving pressure on the various commodities.
CHART OF $USD (DXY)
Picture
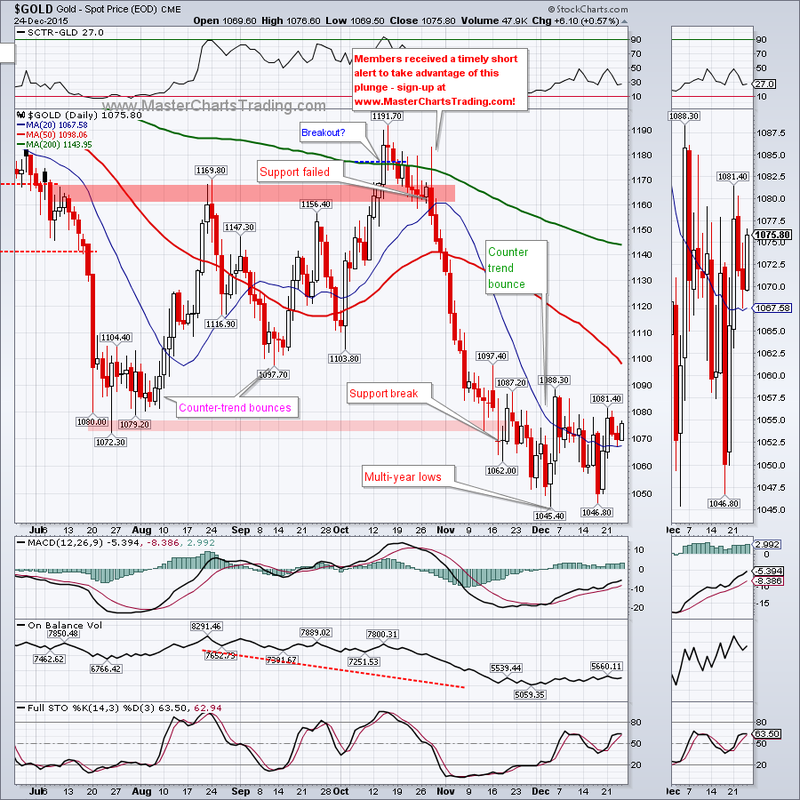
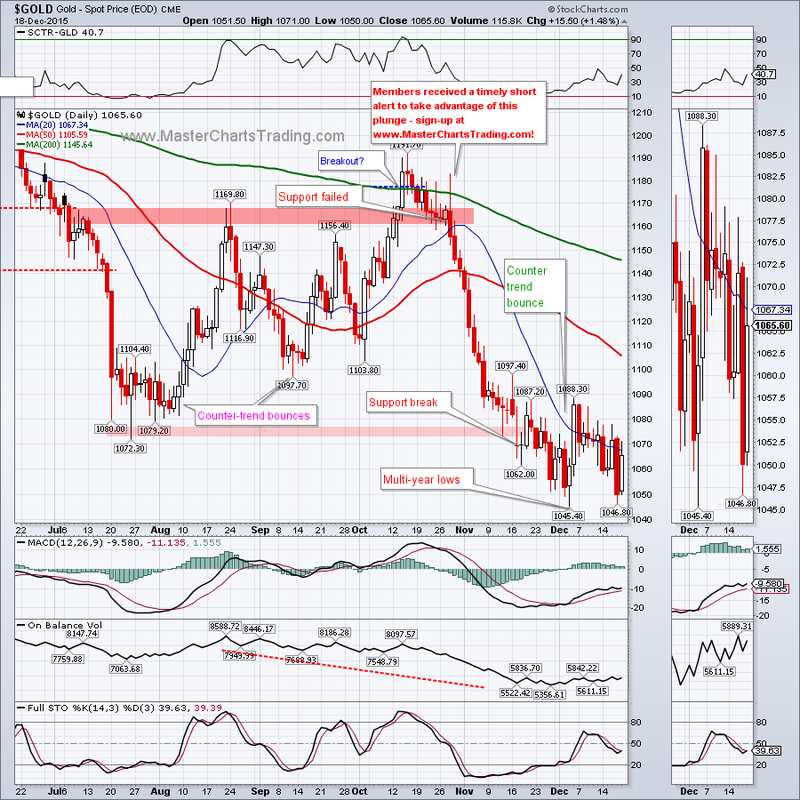
Gold has struggled following a close below support in mid-November. Neither the gold bulls nor the gold bears are so far able to gain the upper hand. Long-term gold is bearish. Short-term we may see a push to around $1100, possibly even $1160 area. The way I look at it is: the higher gold pushes, the better the shorting opportunity it becomes.
CHART OF GOLD
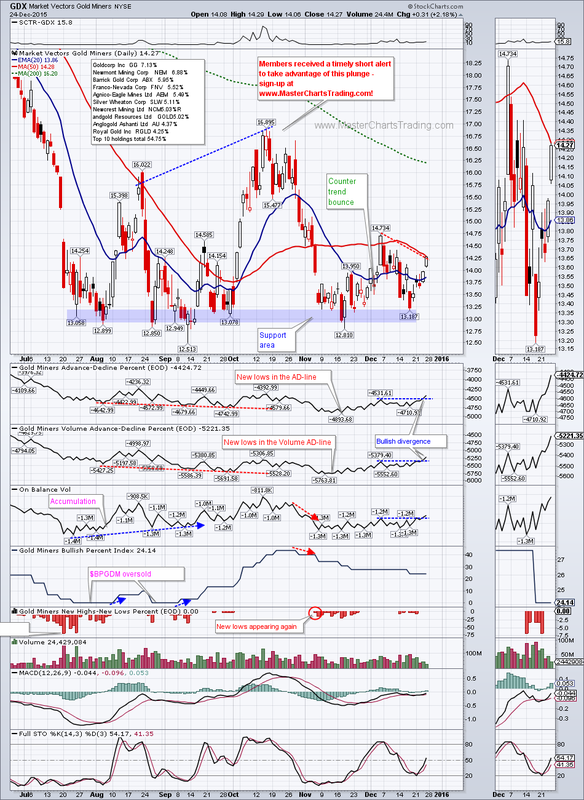
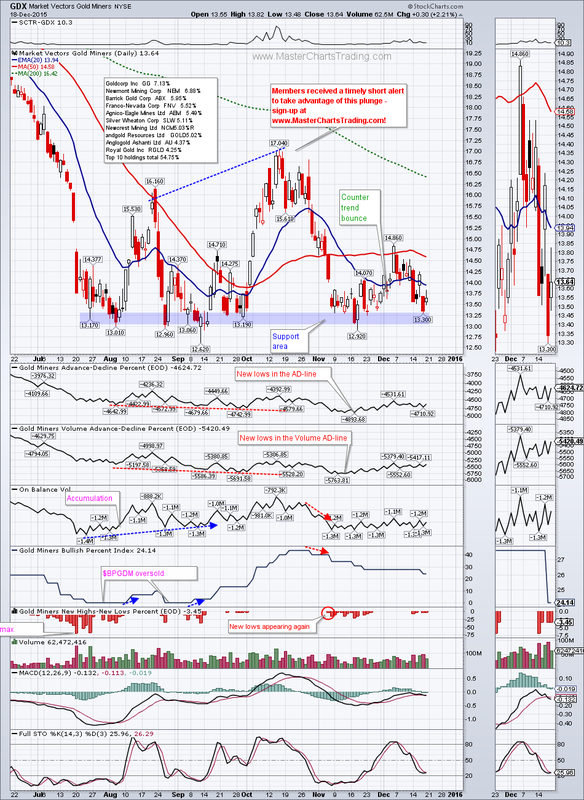
       GDX again held support in the $13 area last week and bounced. Friday GDX ended just below the 50-day moving average at $14.27. Maybe we are seeing some sort of a bottoming action in GDX (I am not a perma-bear)? I am seeing a higher high in the Advance-Decline lines for GDX as well as the On-Balance Volume indicator – all before a higher high in the price itself. This is a bullish divergence and should be paid attention to. Maybe we will see higher prices ahead for GDX. I am guessing $16 area is not out of the question, especially if the Dollar comes under more pressure.
CHART OF GDX
Picture
Picture
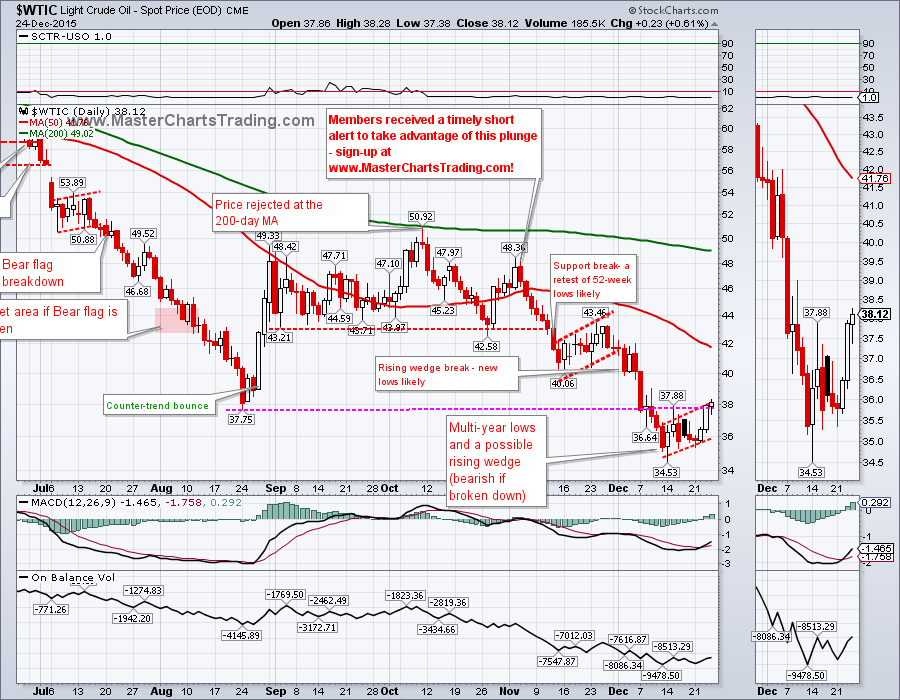
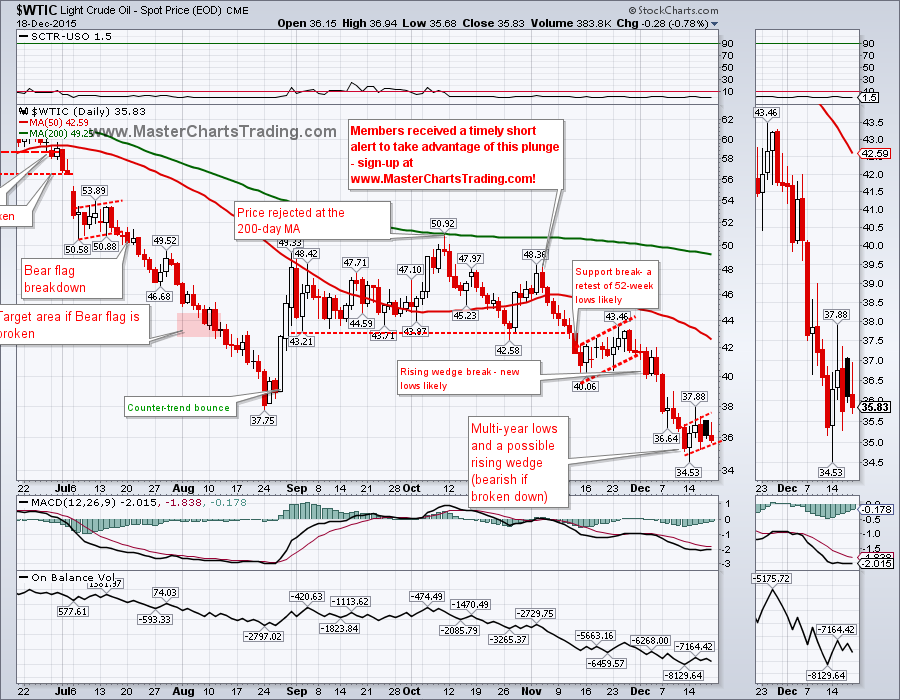
Oil ($WTIC) also bounced back above the broken support and is now trading for around $38. We could view this week’s rebound in one of two ways. This rise in prices formed a rising wedge. Rising wedges in a bearish security are bearish continuation patterns. Or we could say that the support break was rejected for now and prices have bottomed. Only time will tell, but it’s entirely possible that the upper $20s for oil would materialize in the next few months.
CHART OF OIL
​
Picture
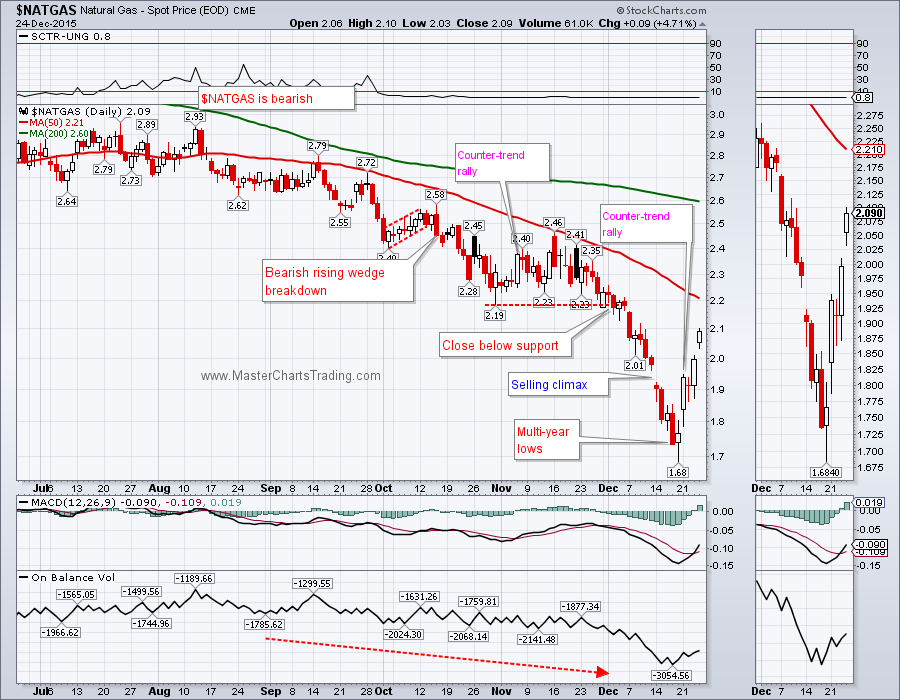
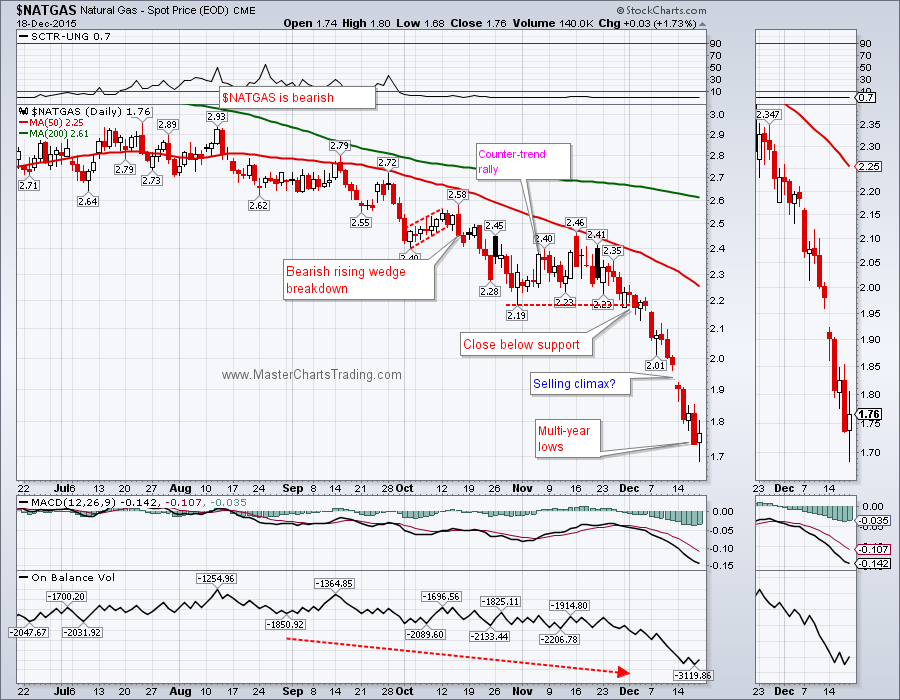
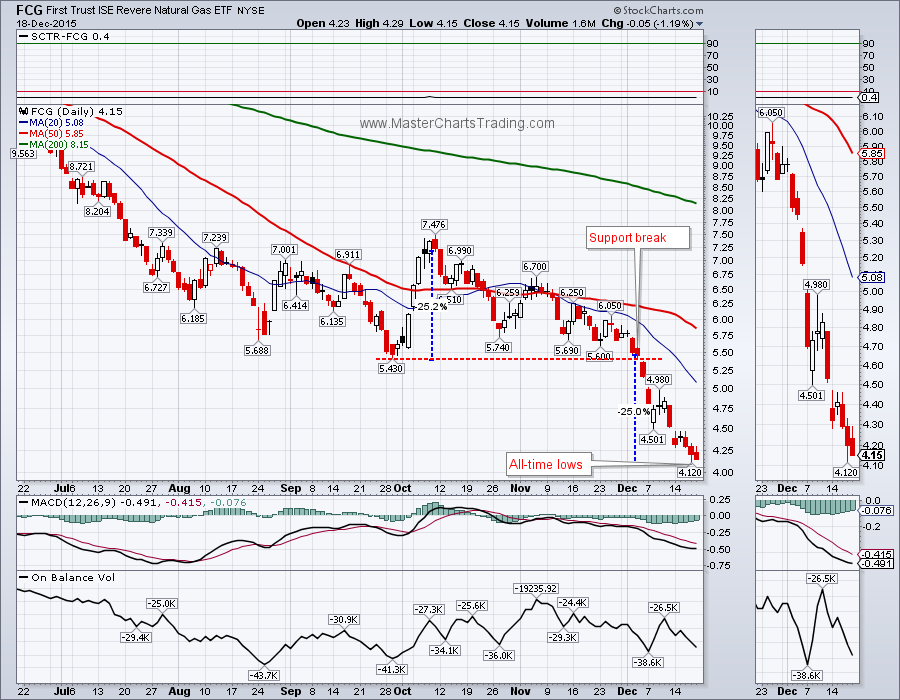
Of the commodities I monitor, natural gas was the clear winner this week – it popped over 18% in a classic short-covering rally. December 14th, NATGAS gapped down at the open in what looked to me suspiciously like a selling climax. I marked it on the chart with a question mark – this week I removed the question mark. As with many other commodities, NATGAS is still in a bear market (just last week NATGAS hit prices not seen since 1999). Depending on where this latest rebound will carry the price, a nice short setup could be brewing.
CHART OF NATGAS
Picture
Finally, during this holiday season, I wanted to urge those who are reading these words or watching the video presentation on YouTube, to consider donating some of the profits you made this year to a charity of your choice. This will not only help a good cause, but will make you feel good! Here is a quick Google search of charities for you to consider donating to.
       
 
Trade Alerts Service is now live – please sign-up here!

That’s it for this week’s market recap,
Merry Christmas and Happy New Year!
 
Alexander Berger (www.MasterChartsTrading.com)
 
 
0 Comments

Market Recap Friday, December 18, 2015 - SPY NYA TLT MUB UUP GLD GDX USO XES UNG FCG

12/20/2015

0 Comments

 
Although the weekly losses for the S&P 500 ($SPX) was only 0.34%, the manner in which this loss occurred is indeed concerning if you are a stock bull. The past two weeks saw increased volatility in many asset classes due to the speeches by chairs of both the European Central Bank and the Federal Reserve. The initial reaction to Janet Yellen’s announcement of a ¼ percent interest rate rise was positive, but things completely fall apart by the end of the week. Chart of SPY now shows a confirmed Bearish Engulfing (Outside reversal) pattern. Friday’s close also put the ETF below its November low for the 2nd time this week.
CHART OF SPY
​
Picture
​Various market breadth indicators did not improve after the Fed announcement, but deteriorated further by Friday’s close. For example: Percent of stocks above the 200-day exponential moving average (EMA) for NYSE Composite index now stands at only 29.9. Another indicator: New Highs-New Lows Percent for NYSE has been bearish since June of this year.
CHART OF NYA
       Our in-house Market Breadth Index (MBI) has been flashing Bear Market warning signs since mid-September. In our back testing going all the way to 1970, MBI was able to call 8 out of the 9 secular Bull and Bear market inflection points. What’s even more impressive is the fact that MBI would have also been able to eliminate the annoying whipsaws – false trend changes. (This index is available for exclusive licensing – contact us if interested.)
         Based on the various momentum, market breadth and trend data series that I follow, the overall preponderance of evidence paints a picture of beginning stages of a bear market. So for now I am going to trust the data I am seeing and continue to look for shorting opportunities within the general stock market.
Picture
Picture
Bonds also experience rather wild swings as Draghni and Yellen delivered their speeches. Interestingly, TLT held support and rebounded following Yellen’s announcement – a clear indication that rising interest rates may not be as much of a drag on the bond markets as many observers predicted. If anything, the move into bonds (Municipal bonds are hitting all-time highs) and away from equities is showing an increased amount of fear in the markets.     
TLT CHART, MUB CHART
​
Picture
Picture
​The US dollar ($USD), like many other asset classes, experienced severe volatility following Mario Dragni’s comments. I think $USD is still in an uptrend and the recent breakout is still valid. In the past 2 days $USD rebounded off a possible support to close again above the breakout level. Again, we are very close to 52-week highs, so at least a re-attempt to those highs is in order.
CHART OF $USD    
Picture
After Draghni’s comments, gold bounced off a multi-year lows. This bounce seem to have failed immediately as bears stepped in and pushed the prices to multi-year closing lows on Thursday. Gold is very much a bearish security, so I see 2 paths for it right now.
  1. A rebound to around $1100-$1140, maybe even $1160 and a failure there.
  2. A drop below the recent lows and continuation to around $1000, or lower.
I don’t see a third scenario of a major bottom and a beginning of a new bull market in gold just yet, especially if $USD continues to trade near 52-week highs.
GOLD CHART 
       Gold miners (GDX) are again trading near the $13 magical area. This is perhaps the 8th time in the past 6 month that GDX attempts to break below this level, but keeps failing. Will this time be different? In the ideal world, I would like to see a rebound for GDX to around $15-16 for a good        setup. If the dollar weakens, gold and GDX may rebound and provide for another shorting opportunity in the near future.
GDX CHART
Picture
Picture
Oil hit multi-year lows again this Monday, then rebounded to its broken support at around $38. Tuesday the price was rejected at that broken support and oil traded sideways for the rest of the week. Oil is very weak and staying weak. This week’s action may be tracing out a rising wedge of sorts. Rising wedges in a bearish security are bearish once the wedge breaks down. Oil could easily reach the high $20s area - based on the measured move from the October highs to its support break below the August lows. If XES (oil services ETF) is any indication, there is still more pain to come in the oil sector. XES just broke supports from August and October lows.
CHART OF OIL, CHART OF XES
​
Picture
Picture
​Natural gas ($NATGAS) is again hitting multi-year lows. The chart of $NATGAS is a picture-perfect example of why trend followers should at all costs avoid attempts to bottom pick a bearish security. On December 2nd $NATGAS closed below support and in the next 2 weeks plunged over 22%. If you view my previous videos, I mentioned the possibility of a down move of around 12% based on the measured move rule. Clearly I underestimated! Also, there were at least 4 hammer-like candlesticks in the past 2 weeks – none of them marked the bottom so far. Now $NATGAS is quite oversold, so a short covering rally cannot be excluded. Ideally the rally should take $NATGAS to around $2.20-$2.40 at which point it would be a nice place to short again. FCG (ETF that holds natural gas stocks) hit all-time lows this week. You can see the measured move in action on the chart there.
CHART OF $NATGAS, CHART OF FCG
 
Trade Alerts Service is now live – please sign-up here!
That’s it for this week’s market recap,
Best Regards and have another great trading week!
 
Alexander Berger (www.MasterChartsTrading.com)
 
 
Picture
Picture
0 Comments
<<Previous
    Picture
    Picture
    Subscribe to our mailing list!
    Picture
    Picture

    Archives

    January 2023
    December 2022
    November 2022
    October 2022
    September 2022
    August 2022
    July 2022
    June 2022
    May 2022
    April 2022
    March 2022
    February 2022
    January 2022
    December 2021
    November 2021
    October 2021
    September 2021
    August 2021
    July 2021
    June 2021
    May 2021
    April 2021
    March 2021
    February 2021
    January 2021
    December 2020
    November 2020
    October 2020
    September 2020
    August 2020
    July 2020
    June 2020
    May 2020
    April 2020
    March 2020
    February 2020
    January 2020
    December 2019
    November 2019
    October 2019
    September 2019
    August 2019
    July 2019
    June 2019
    May 2019
    April 2019
    March 2019
    February 2019
    January 2019
    December 2018
    November 2018
    October 2018
    September 2018
    August 2018
    July 2018
    June 2018
    May 2018
    April 2018
    March 2018
    February 2018
    January 2018
    December 2017
    November 2017
    October 2017
    September 2017
    August 2017
    July 2017
    June 2017
    May 2017
    April 2017
    March 2017
    February 2017
    January 2017
    December 2016
    November 2016
    October 2016
    September 2016
    August 2016
    July 2016
    June 2016
    May 2016
    April 2016
    March 2016
    February 2016
    January 2016
    December 2015
    November 2015
    October 2015
    September 2015
    August 2015
    July 2015
    June 2015
    May 2015
    April 2015
    March 2015
    February 2015
    January 2015
    December 2014
    November 2014
    October 2014
    September 2014
    August 2014
    June 2014
    May 2014
    April 2014
    March 2014
    February 2014
    January 2014

    RSS Feed

  All information on MasterChartsTrading.com is for educational and entertainment purposes only, and should not be construed as a recommendation to buy, sell or sell-short said securities. Read full disclaimer.