Master Charts Trading - Stock Market Indicators & Trade Alerts
Connect To Us!
  • MasterChartsTrading
  • Blog
  • Sign-Up
  • Members
    • Elite Trading Blog
    • Stock Speculator Blog
    • Training Library >
      • Basics of Trading
      • Risk & Trading Psych
      • Trend Identification
  • Help
    • Hall of Fame
    • Social
    • About Us
    • Contact
    • FAQs
    • Disclaimer
    • Refund Policy
    • Privacy Policy
    • What We Trade
    • Newsletter samples

Market Recap, Friday, November 27, 2015 - SPY nYA AGG MUB GLD GDX JJC USO UNG UUP

11/28/2015

1 Comment

 
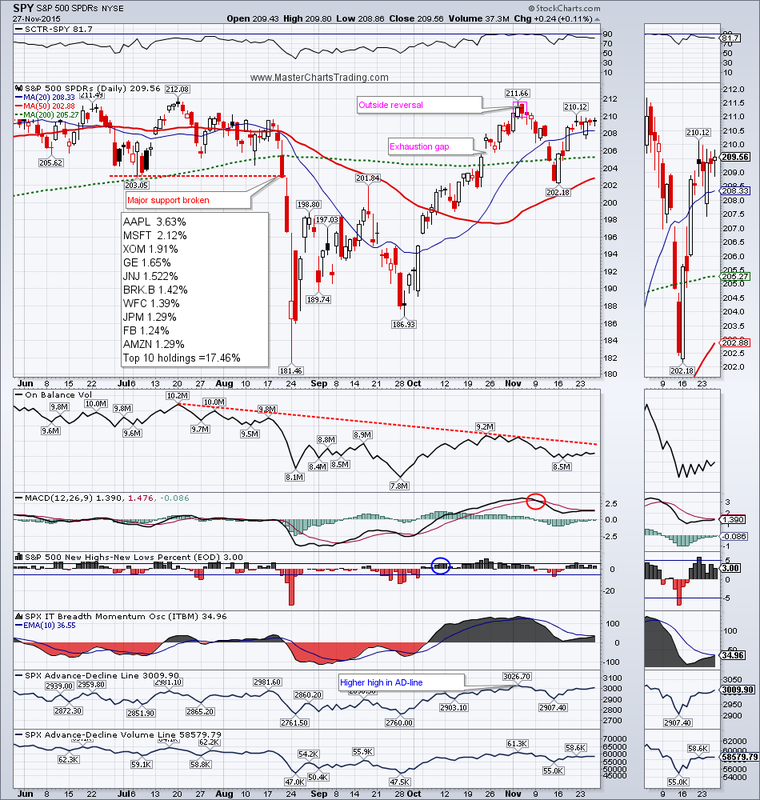
       We only had 3 full days of trading and a half-day on Friday; therefore it is difficult to draw any conclusions from the price action during this relatively short period of time. SPY gained a fraction of a percent for the week, while QQQ lost a fraction. 
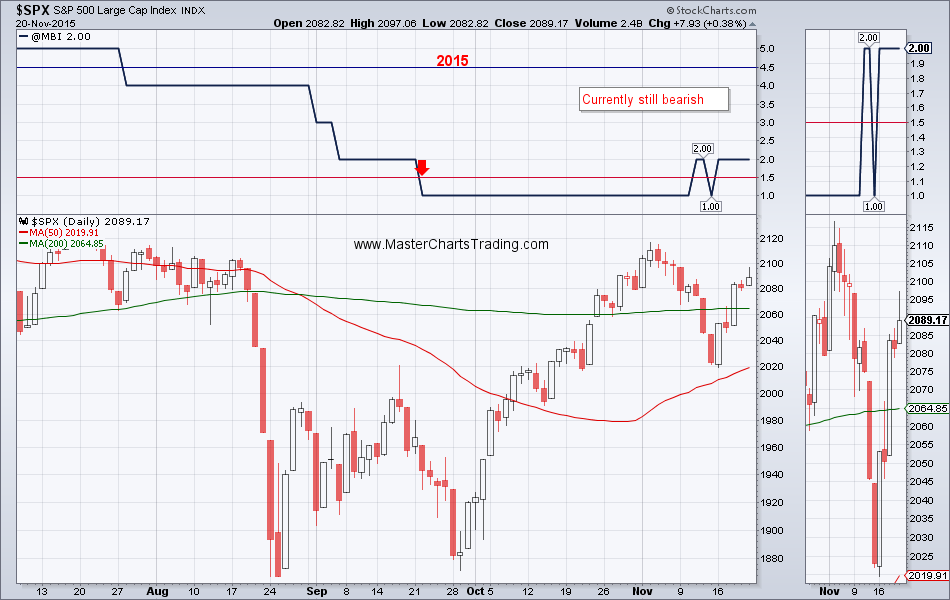
I maintain my bearish outlook for stocks in the near term. A retest of recent November lows is very likely. Should that level fail, a retest of August lows is extremely likely. Various market breadth, momentum and trend indicators that I track have not yet given an all-clear message.
       CHART OF SPY
Picture
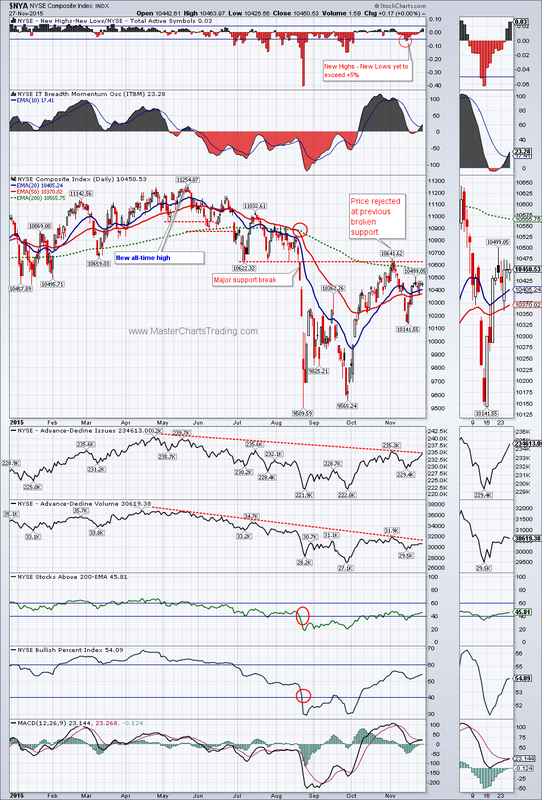
​$SPX is gaining upon its previous all-time highs, but the broader NYSE composite ($NYA) is nowhere near its all-time highs. In fact higher price was rejected at the previous broken support just a few weeks ago. Currently we may be in the process of making a lower high. The Advance-Decline (AD-Lines) lines for $NYA are still trending lower. The Bullish percent index and % of stocks above the 200-day EMA are still in the bearish territory.
         CHART OF NYA
Picture
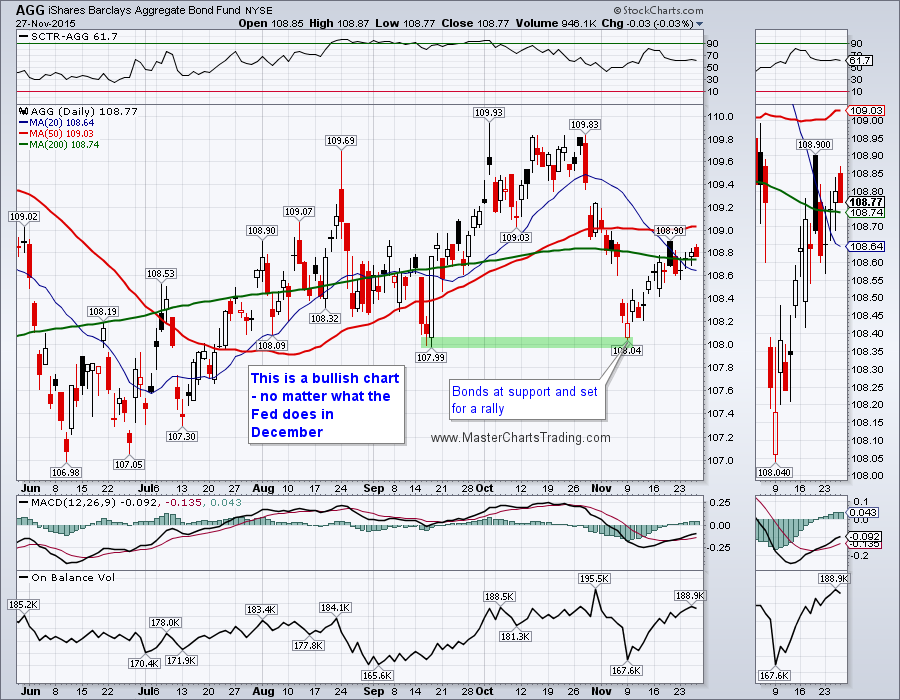
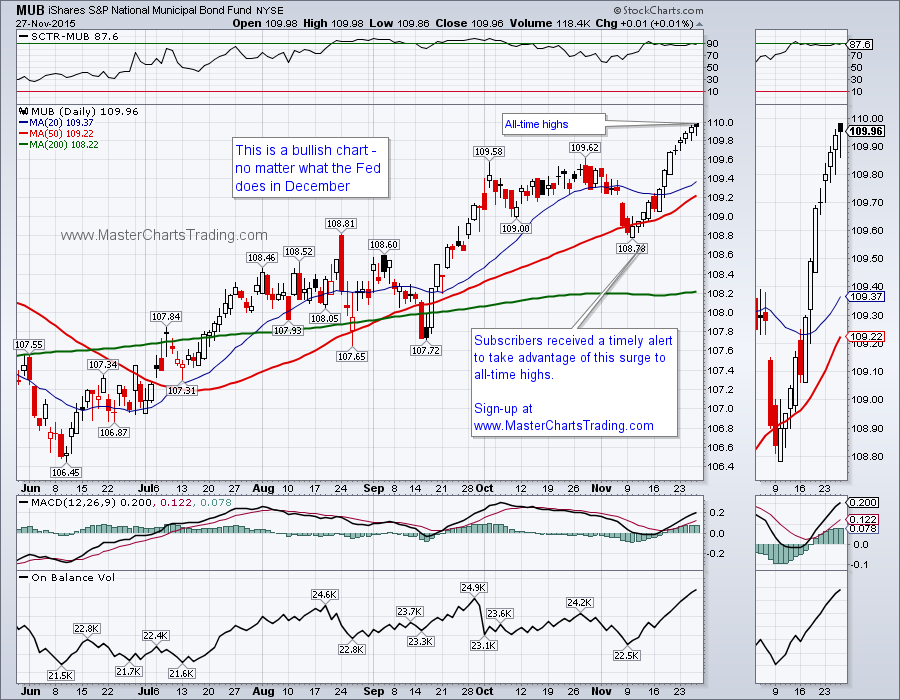
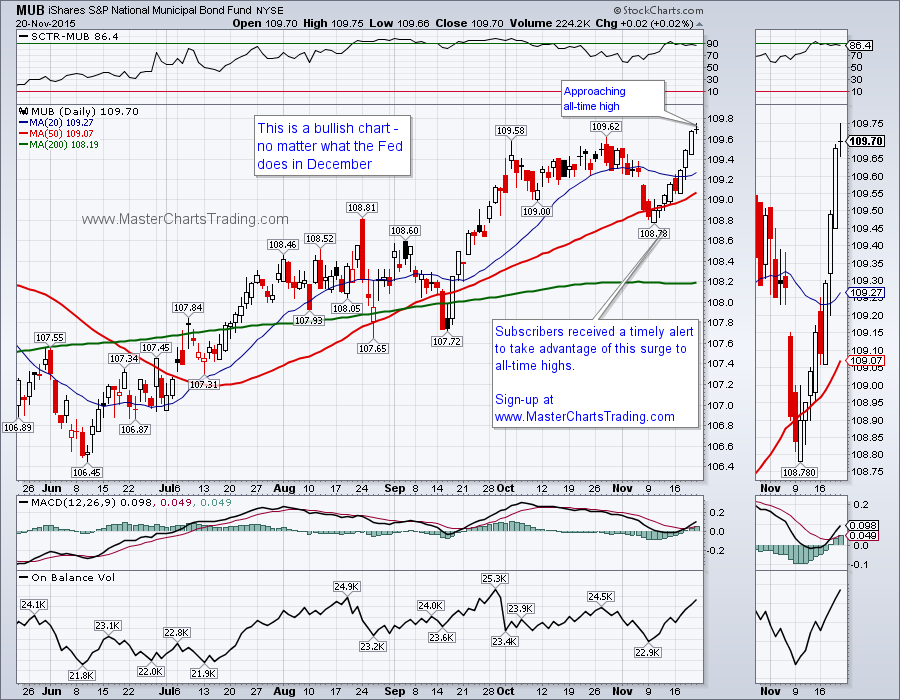
​Just a few weeks ago when the Federal Reserve finally made a decision to even consider increasing the interest rates at its December FOMC meeting, bonds came under selling pressure. At that point it was clear to me that this was a buying opportunity and I tweeted about it on November 10th. Since then bonds (AGG) went on a nice rebound. While the municipal bonds fund (MUB) made an all-time high. This is a counter-intuitive action, since it is a widely held view that rising interest rates hurt bond performance. This action is telling me that the bond market is sensing fear and the smart money is positioning itself appropriately by rotating into the more defensive areas of the market.
       CHART OF AGG
       CHART OF MUB
Picture
Picture
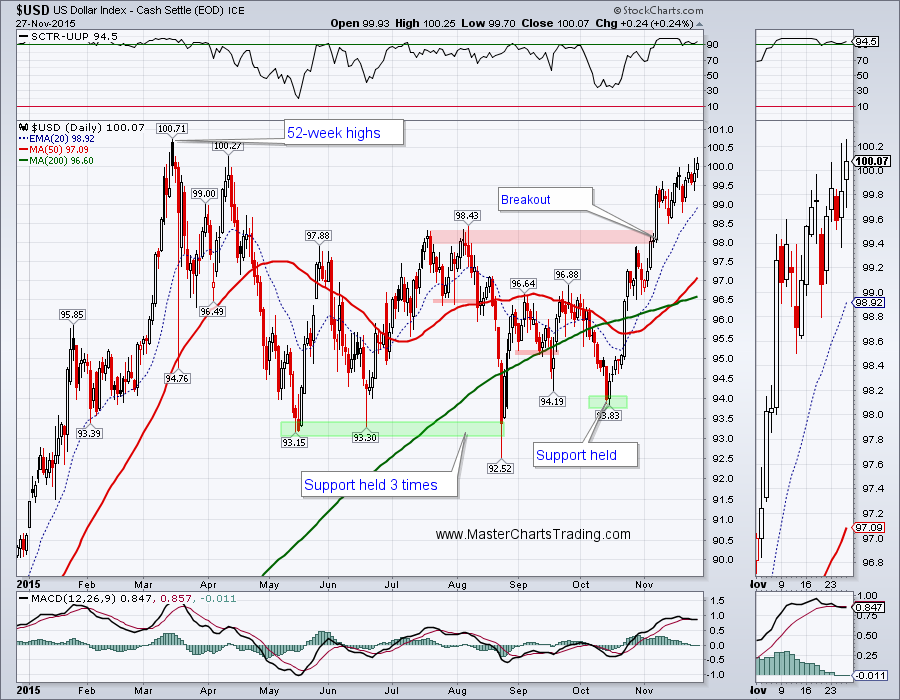
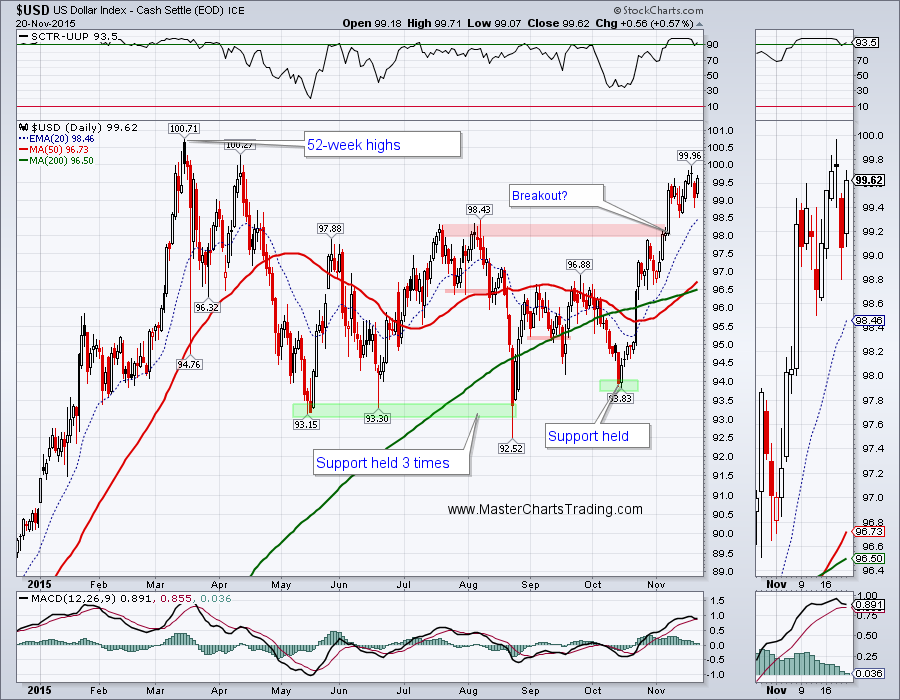
​The Dollar is gaining upon its 52-week highs following its recent breakout in early November. While there is talk about tightening the monetary policy in the United States, there is talk of more quantitative easing elsewhere in the world – this is very positive for the US Dollar index ($USD) while negative for various commodities that are priced in dollars.
       CHART OF $USD
Picture
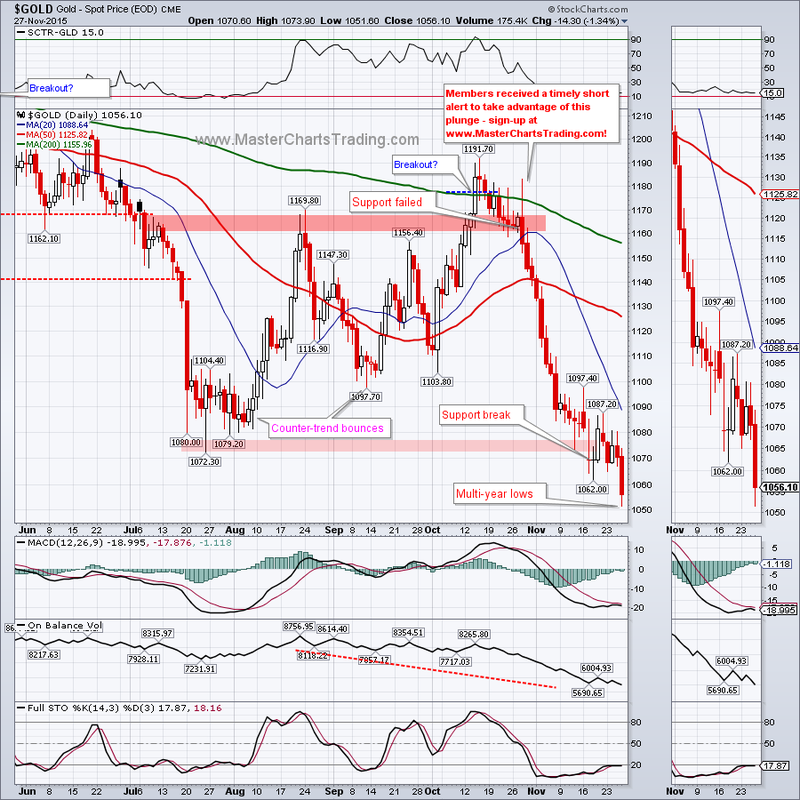
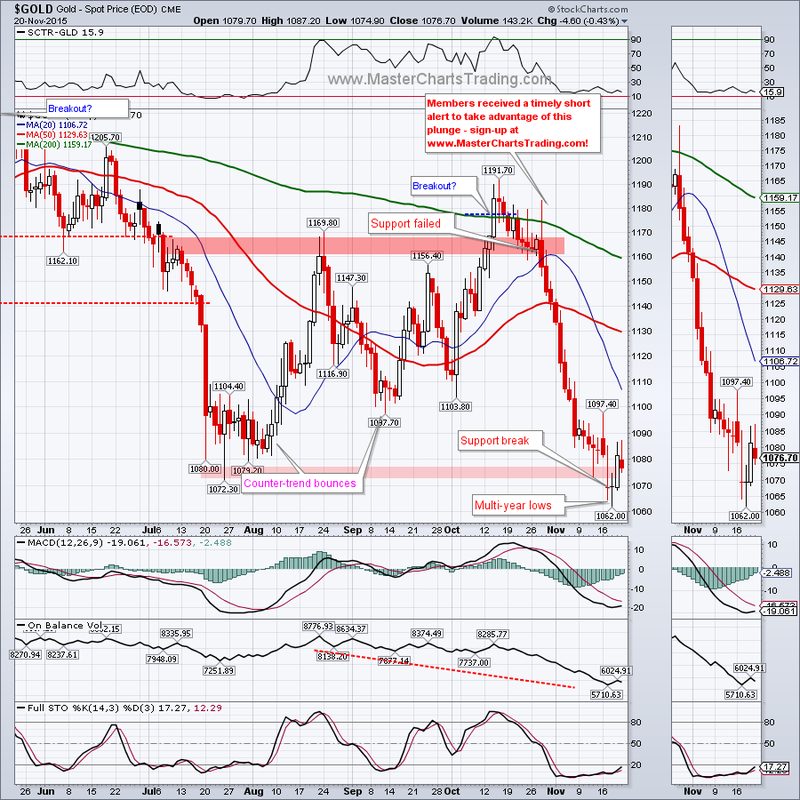
Last week on November 17th, I believe we had a meaningful and conclusive breakdown in the price of gold. Gold closed below the recent July lows while simultaneously making fresh multi-year lows. Gold was oversold last week; it’s even more oversold now. Gold is bearish - therefore I generally ignore oversold conditions and instead look for overbought conditions to open short positions. My subscribers were alerted as early as mid-October to my view of the fact that gold presented an excellent shorting opportunity and are sitting on very nice gains since then. Please consider signing-up for my Trade Alerts Service – its well worth the small investment. My conservative estimate is that the current drop in gold price would take it to around $1000 before any kind of short covering rally materializes.
       GOLD CHART 
Picture
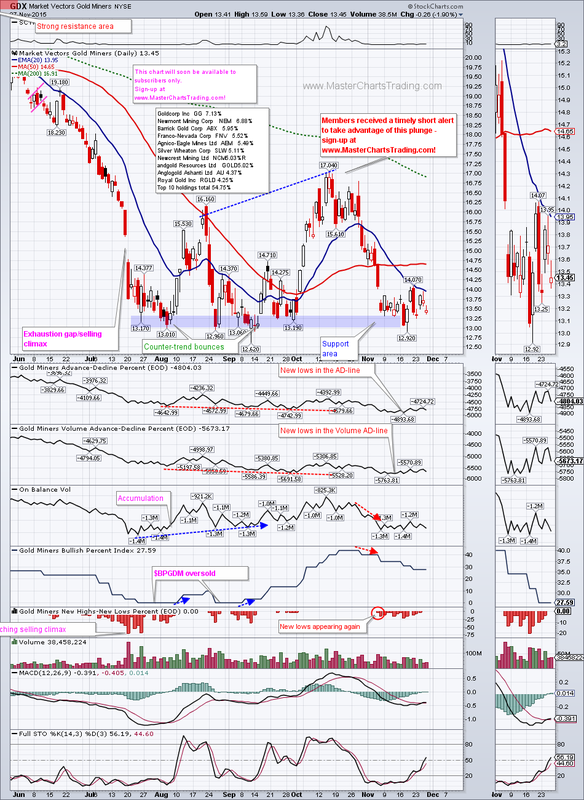
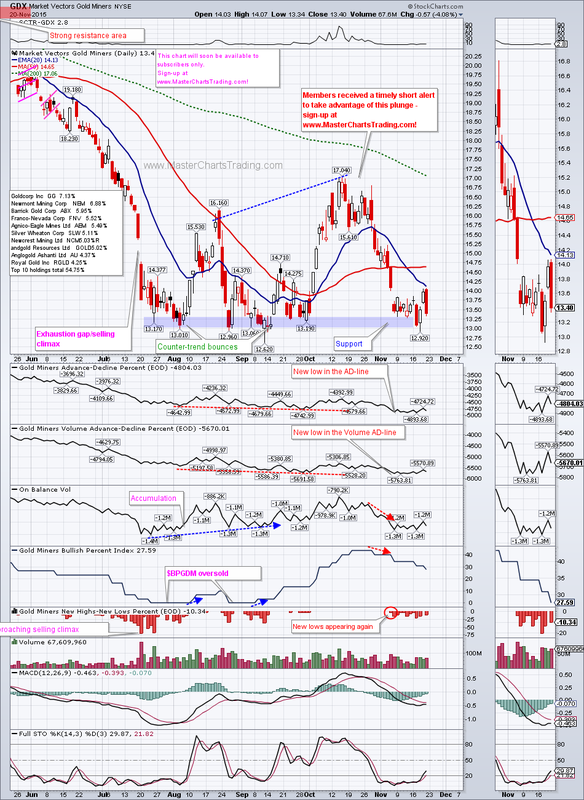
GDX is doing what gold is telling it to do, almost. GDX is still struggling at the previous support level of $13. So we now have a bit of a divergence – gold closed below its support, but GDX is still dragging its feet. Should GDX close below $13 though, we can easily see it trading around $10 based on the measured move rule.
       CHART OF GDX.
Picture
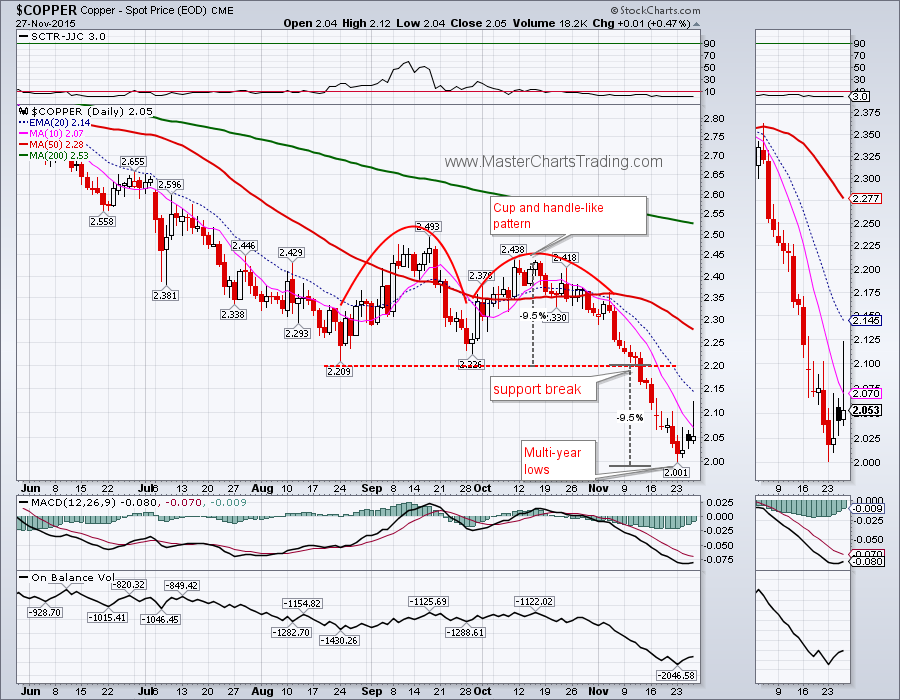
For a good illustration of a measured move rule take a look at the chart of $COPPER. You can see that $COPPER broke support in mid-November and before any kind of a meaningful bounce took place, it dropped around the height of the previous cup and handle-like pattern.
       CHART OF COPPER
Picture
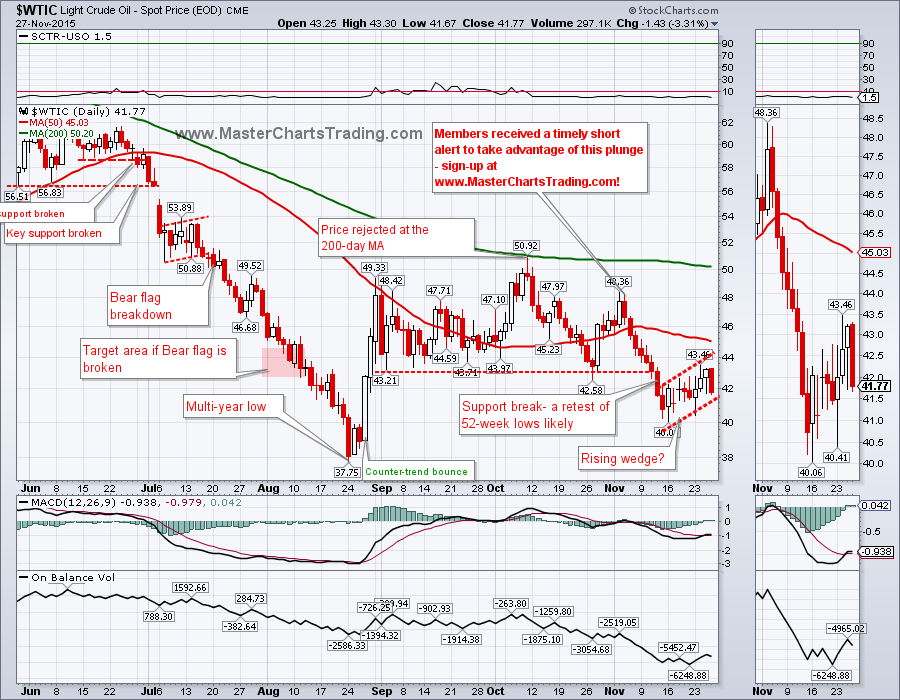
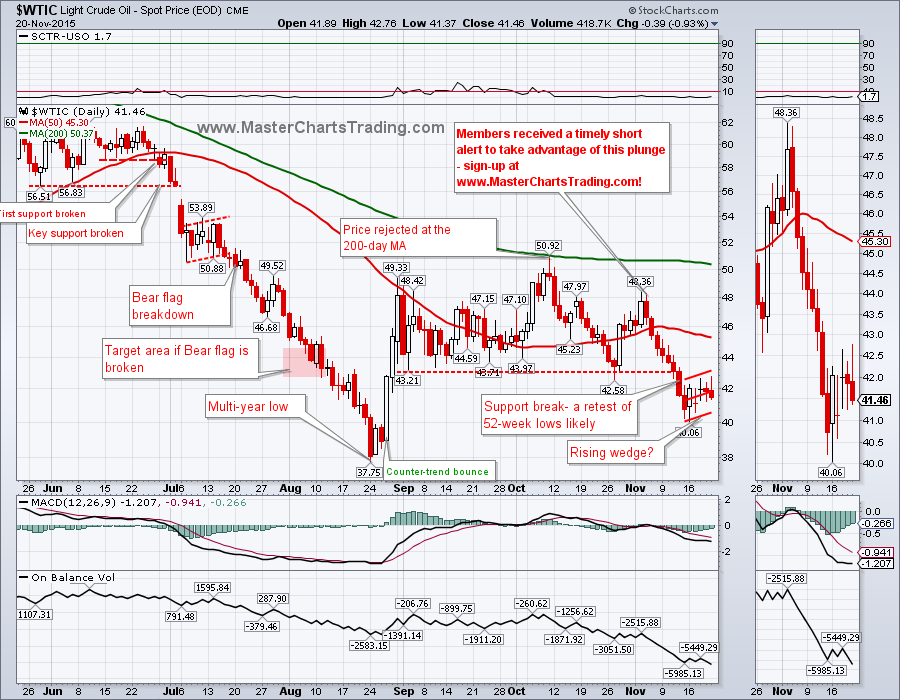
       Oil ($WTIC) spent the last week rebounding to the previously broken support at around $43. November 24th it failed there and this Friday we saw the more serious selling take place. Oil is bearish, and at least a re-test of August lows is highly likely. That August price support at $37.75 may not hold. Will we see oil trading at $30 next year?
       CHART OF OIL
Picture
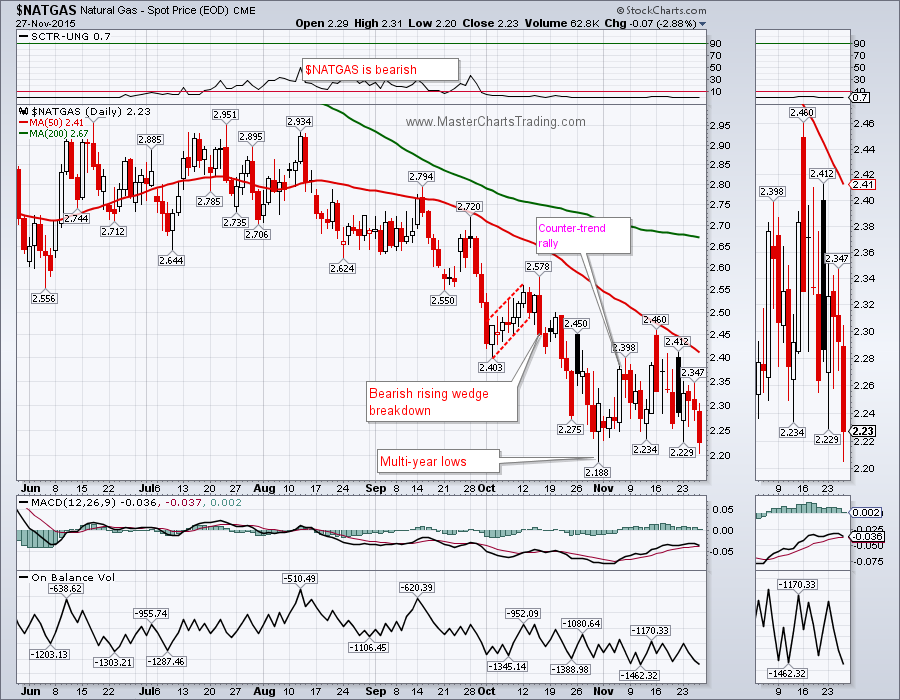
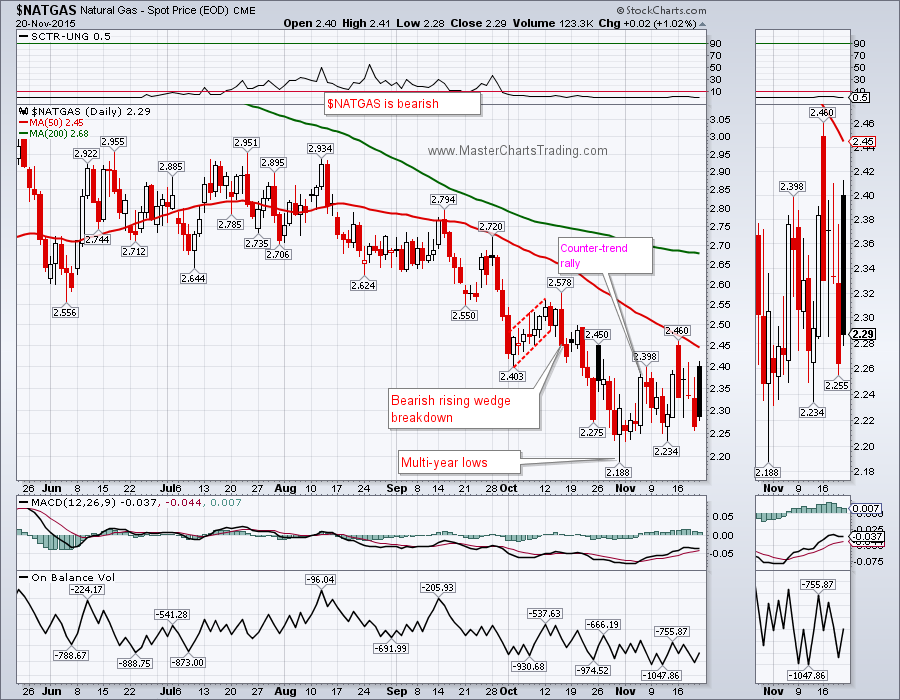
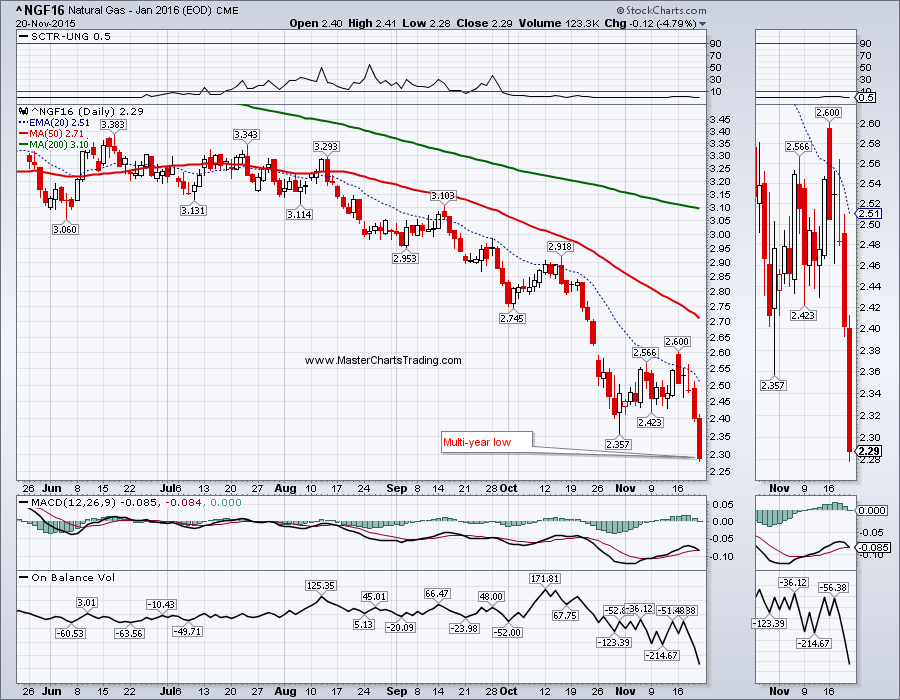
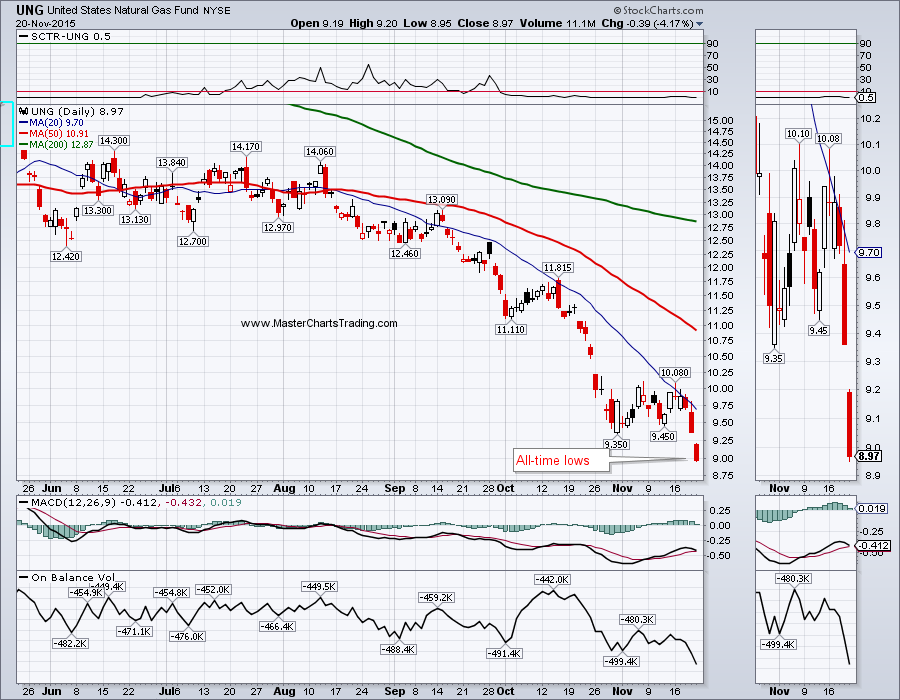
       Spot $NATGAS closed at multi-year lows this Friday. I am bit surprised at a lack of any meaningful rebound. $NATGAS hasn’t even been able to close above its 50-day moving average for the past 4 month. A close below $2.188 may call for a push to the $2.00 gas. $NATGAS is strongly bearish, but that doesn’t mean its currently a good opportunity to short. I want to see a rebound take place before I would even consider shorting again.
       CHART OF $NATGAS
Picture
That’s it for this week’s market recap,
Best Regards and have another great trading week!
 
Alexander Berger (www.MasterChartsTrading.com)
 
1 Comment

Market recap, friday, November 20, 2015 - SPY MUB UUP GLD GDX USO UNG 

11/22/2015

5 Comments

 
       “Choppy market environment” - could be the descriptive term for what has been happening in the markets for the past few months. Just last week stocks were down over 3.5%, only to reverse this week and recapture most of the losses. Many commentators and seasoned traders are having trouble explaining this type of action and are subsequently getting whipsawed out. Is the market right now bullish or are we entering a bear market? This should be a relatively simple question to answer; yet there seems to be quite a bit of disagreement even at such basic level. Let us look at some of the historical examples to attempt to answer this question now.
​I presented my proprietary Market Breadth Indicator (MBI) several weeks ago. MBI is composed of several breadth indices, momentum and trend indices all rolled into one. I back tested MBI all the way back to the 1970, and it appears to have a rather high predictive value. Specifically it called 8 out of 9 major trend changes (bull vs. bear markets) and helped eliminate numerous whipsaws if one was using trend-following strategies to time entries and exits. Let us now examine several such major trend changes in more details.
Picture
​A lot of comparisons were recently drawn between today’s market action and that of 2011. We have had a similar sharp drop, followed by the 50-day moving average (MA) crossing below the 200-day moving average. However on the chart below from 2011, it can be clearly seen that MBI never dipped into the bearish territory. Stocks continued sideways after a major drop and then recovered relatively quickly. The same goes for the chart of 2010 correction – MBI never dropped into negative territory even though the 50-day moving average crossed below the 200-day moving average. A relatively quick recovery followed.
Picture
Picture
​Now let us look at the 3 examples when MBI called the bear markets, namely those of: 1973, 2001 and 2008.
 
       The picture in 1973 was not exactly identical to the one today, but the similarities are there: the 50-day MA was below the 200-day MA and MBI dropped into the bearish territory. After MBI confirmed bear market, there was a sizable rally to above the 200-day MA. However, MBI never crossed above the bullish threshold and the index itself rolled over into a bear market – characterized by lower lows and lower highs with a total loss of about 50%.
Picture
​In 2001 the picture in stocks was somewhat different. The stock market seemed even weaker then back in 1974 when MBI crossed into the bearish camp. What followed was several years of a bear market with a peak to trough loss in $SPX of around 50%. 
Picture
​The picture at the start of the latest bear market of 2008 looks a bit more like what we have today. The 50-day MA crossed below the 200-day MA in December of 2007. Then MBI followed suit and signaled a change from a bullish to a bearish posture. Immediately after the MBI flipped bearish, stocks rallied and recaptured the 200-day MA. But was that enough? No. MBI never flipped into a bull mode and stocks rolled over with a vengeance. $SPX lost around 60% of its value before finally bottoming out in 2009. 
Picture
​What does the picture look like today? Today’s picture in stocks looks more like it looked back in 1973 and in 2008 beginnings of bear markets and less like it looked back in 2011 and 2010 corrections. Can stocks reverse and rally hard from here and negate the bearish MBI signal? Of course they can! But based on the previous 3 examples as outlined above it is unlikely. At best I can visualize a scenario of the stock indices struggling close to their highs and more sideways consolidation. More likely is at least a retest of August lows with a possible support break there.
CHART OF SPY
Picture
Bond markets seem to be shrugging off the potential interest rate hike in December. Various bond funds held their supports last week and are in the process of rebounding. Municipal bond fund (MUB) is approaching its all-time highs - this looks like bullish action to me.
Chart of MUB
Picture
The Dollar is also approaching its 52-week highs. $USD broke out 3 weeks ago above its previous peaks and for now this breakout is holding. Mario Draghni of the European Central Bank hinted at more quantitative easing. This sent the Euro vs. the US dollar sharply lower this week. EURUSD is now approaching its 52-week lows and this is weighing on $USD. ($USD is composed of almost 58% Euro.)
       Chart of $USD
Picture
Gold broke support this week with a close below $1072.30 - a multi-year low that was set back in July. Gold has since attempted a quick rally back above the broken support. On the heels of potentially more QE coming out of Europe, the dollar is likely to benefit and this will weigh further on gold. One scenario for gold is a short-covering rally back to around $1100, while a more likely one, in my opinion, is continuation down to around $1000.
       CHART OF GOLD
Picture
Gold miners (GDX) again are trading around the $13 level. This level previously held significance to GDX as it rebounded off of it. If gold continues down, GDX is surely going to follow it. A support break here could put GDX around the $10 level in the not so distant future. Another possibility is a rebound to around $14.75 where the 50-day moving average currently is.
CHART OF GDX
Picture
Oil ($WTIC) broke support last week with a close below $43.21. I have been pointing out this level for many weeks - it being critical to the fate of oil prices in the short-term. This week oil spent its time rebounding back to this broken level with a rising wedge pattern of sorts. Rising wedges are bullish while rising, but once broken (in a bearish security) call for significantly more movement to the downside. A retest of multi-year lows around $37.75 is very much in the cards still.
CHART OF OIL
Picture
Natural gas ($NATGAS) is still very much in a bear market. About a month ago I pointed out that NATGAS might have reached at least a temporary bottom and a rebound to around $2.50 is possible. That rebound proved fleeting and this week we saw the January 2016 natural gas contract hit a multi-year low. UNG – the natural gas tracking ETF followed suit and hit all-time lows. Bottom picking a bearish security is fraught with dangers – I strongly suggest traders avoid the urge to bottom pick.
CHART OF UNG
Picture
Picture
Picture
​That’s it for this week’s market recap,
Best Regards and have another great trading week!
 
Alexander Berger (www.MasterChartsTrading.com)
5 Comments
<<Previous
    Picture
    Picture
    Subscribe to our mailing list!
    Picture
    Picture

    Archives

    December 2022
    November 2022
    October 2022
    September 2022
    August 2022
    July 2022
    June 2022
    May 2022
    April 2022
    March 2022
    February 2022
    January 2022
    December 2021
    November 2021
    October 2021
    September 2021
    August 2021
    July 2021
    June 2021
    May 2021
    April 2021
    March 2021
    February 2021
    January 2021
    December 2020
    November 2020
    October 2020
    September 2020
    August 2020
    July 2020
    June 2020
    May 2020
    April 2020
    March 2020
    February 2020
    January 2020
    December 2019
    November 2019
    October 2019
    September 2019
    August 2019
    July 2019
    June 2019
    May 2019
    April 2019
    March 2019
    February 2019
    January 2019
    December 2018
    November 2018
    October 2018
    September 2018
    August 2018
    July 2018
    June 2018
    May 2018
    April 2018
    March 2018
    February 2018
    January 2018
    December 2017
    November 2017
    October 2017
    September 2017
    August 2017
    July 2017
    June 2017
    May 2017
    April 2017
    March 2017
    February 2017
    January 2017
    December 2016
    November 2016
    October 2016
    September 2016
    August 2016
    July 2016
    June 2016
    May 2016
    April 2016
    March 2016
    February 2016
    January 2016
    December 2015
    November 2015
    October 2015
    September 2015
    August 2015
    July 2015
    June 2015
    May 2015
    April 2015
    March 2015
    February 2015
    January 2015
    December 2014
    November 2014
    October 2014
    September 2014
    August 2014
    June 2014
    May 2014
    April 2014
    March 2014
    February 2014
    January 2014

    RSS Feed

  All information on MasterChartsTrading.com is for educational and entertainment purposes only, and should not be construed as a recommendation to buy, sell or sell-short said securities. Read full disclaimer.