|
“Choppy market environment” - could be the descriptive term for what has been happening in the markets for the past few months. Just last week stocks were down over 3.5%, only to reverse this week and recapture most of the losses. Many commentators and seasoned traders are having trouble explaining this type of action and are subsequently getting whipsawed out. Is the market right now bullish or are we entering a bear market? This should be a relatively simple question to answer; yet there seems to be quite a bit of disagreement even at such basic level. Let us look at some of the historical examples to attempt to answer this question now.
|
|
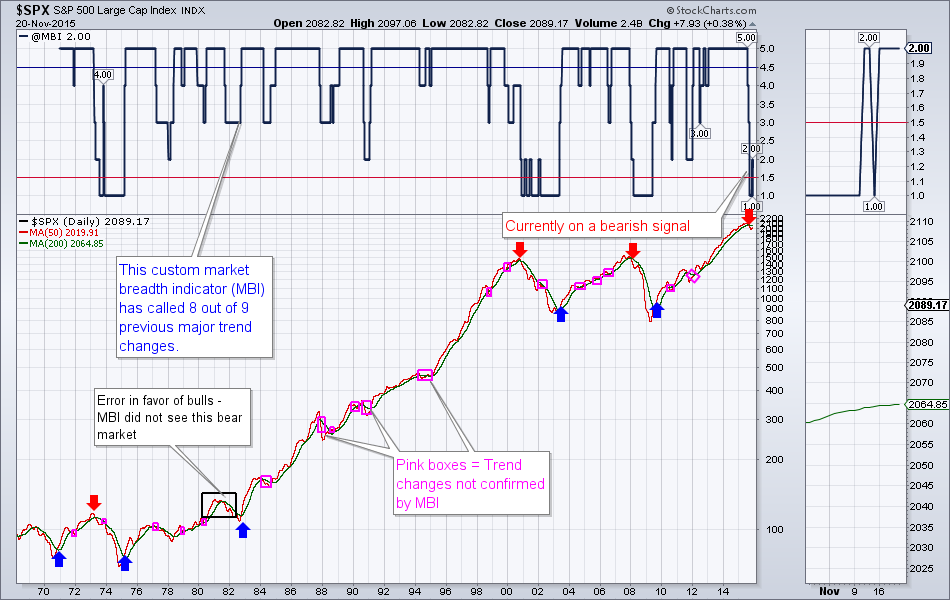
I presented my proprietary Market Breadth Indicator (MBI) several weeks ago. MBI is composed of several breadth indices, momentum and trend indices all rolled into one. I back tested MBI all the way back to the 1970, and it appears to have a rather high predictive value. Specifically it called 8 out of 9 major trend changes (bull vs. bear markets) and helped eliminate numerous whipsaws if one was using trend-following strategies to time entries and exits. Let us now examine several such major trend changes in more details.
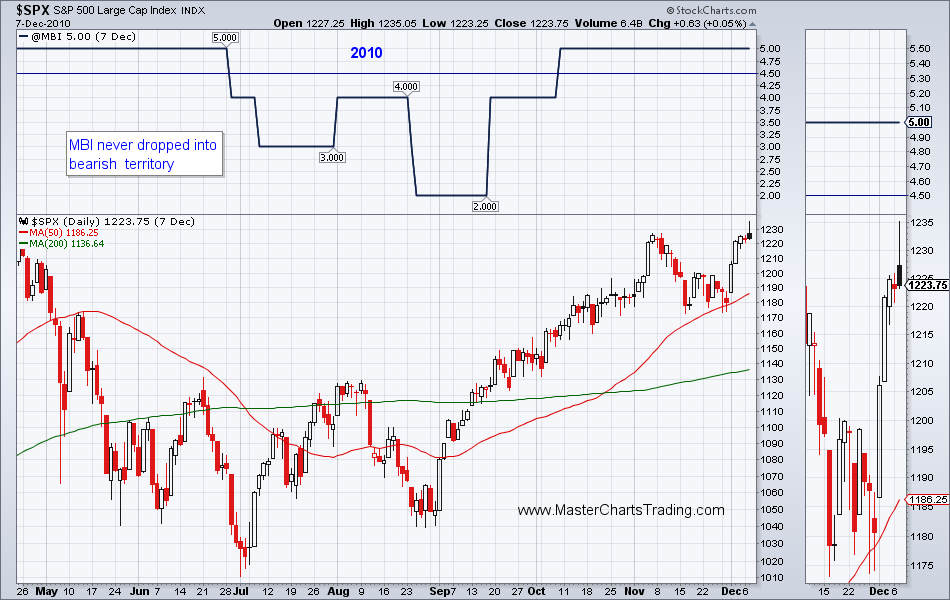
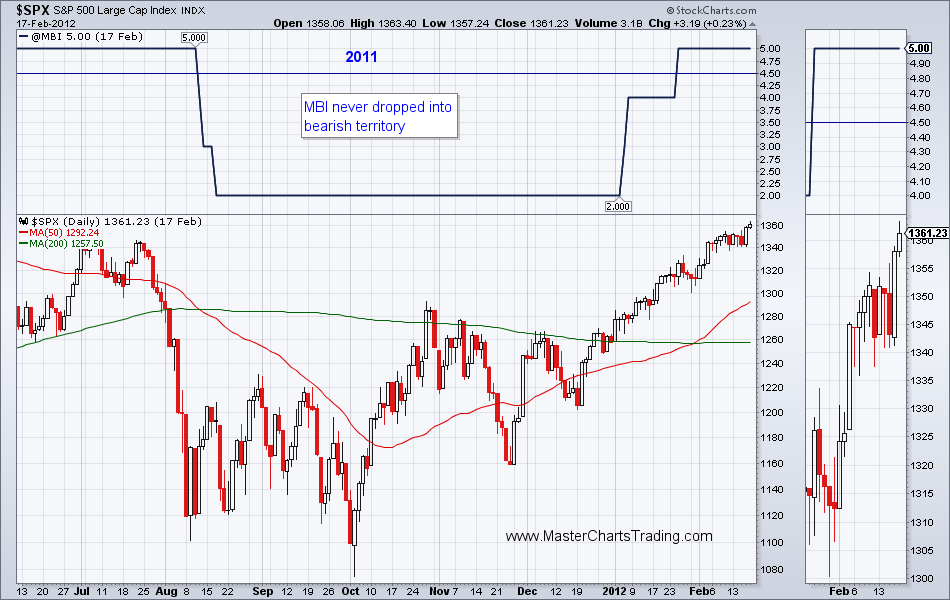
A lot of comparisons were recently drawn between today’s market action and that of 2011. We have had a similar sharp drop, followed by the 50-day moving average (MA) crossing below the 200-day moving average. However on the chart below from 2011, it can be clearly seen that MBI never dipped into the bearish territory. Stocks continued sideways after a major drop and then recovered relatively quickly. The same goes for the chart of 2010 correction – MBI never dropped into negative territory even though the 50-day moving average crossed below the 200-day moving average. A relatively quick recovery followed.
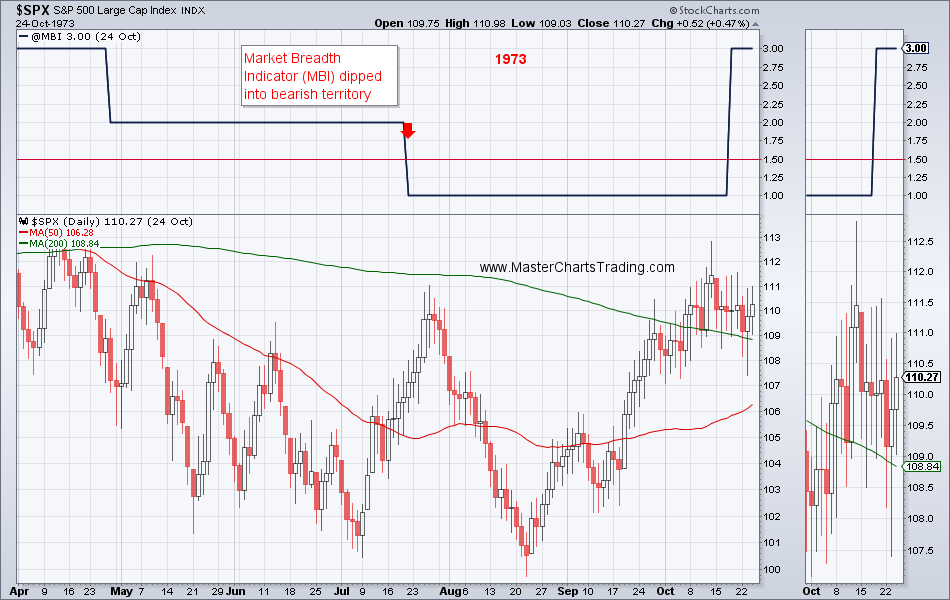
Now let us look at the 3 examples when MBI called the bear markets, namely those of: 1973, 2001 and 2008.
The picture in 1973 was not exactly identical to the one today, but the similarities are there: the 50-day MA was below the 200-day MA and MBI dropped into the bearish territory. After MBI confirmed bear market, there was a sizable rally to above the 200-day MA. However, MBI never crossed above the bullish threshold and the index itself rolled over into a bear market – characterized by lower lows and lower highs with a total loss of about 50%.
The picture in 1973 was not exactly identical to the one today, but the similarities are there: the 50-day MA was below the 200-day MA and MBI dropped into the bearish territory. After MBI confirmed bear market, there was a sizable rally to above the 200-day MA. However, MBI never crossed above the bullish threshold and the index itself rolled over into a bear market – characterized by lower lows and lower highs with a total loss of about 50%.
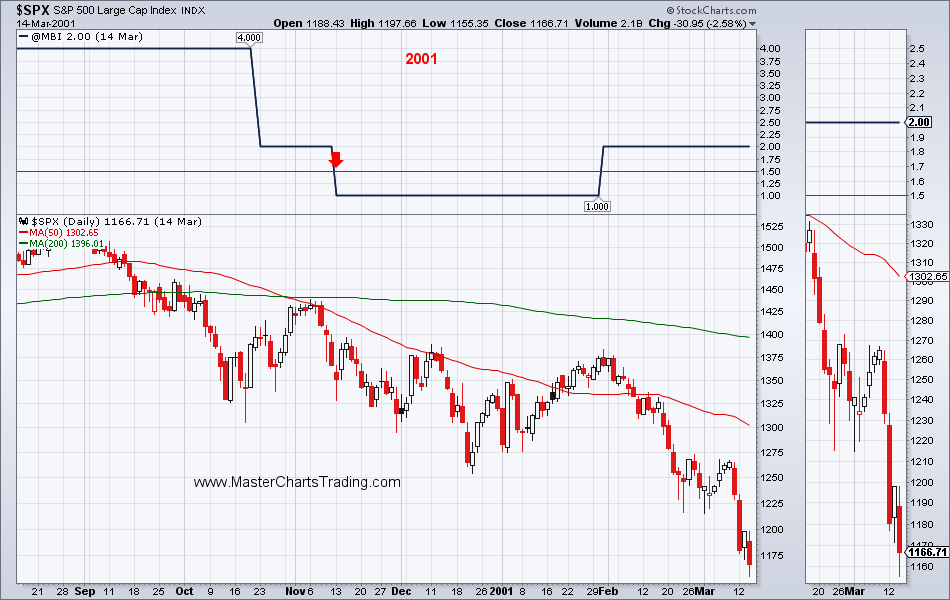
In 2001 the picture in stocks was somewhat different. The stock market seemed even weaker then back in 1974 when MBI crossed into the bearish camp. What followed was several years of a bear market with a peak to trough loss in $SPX of around 50%.
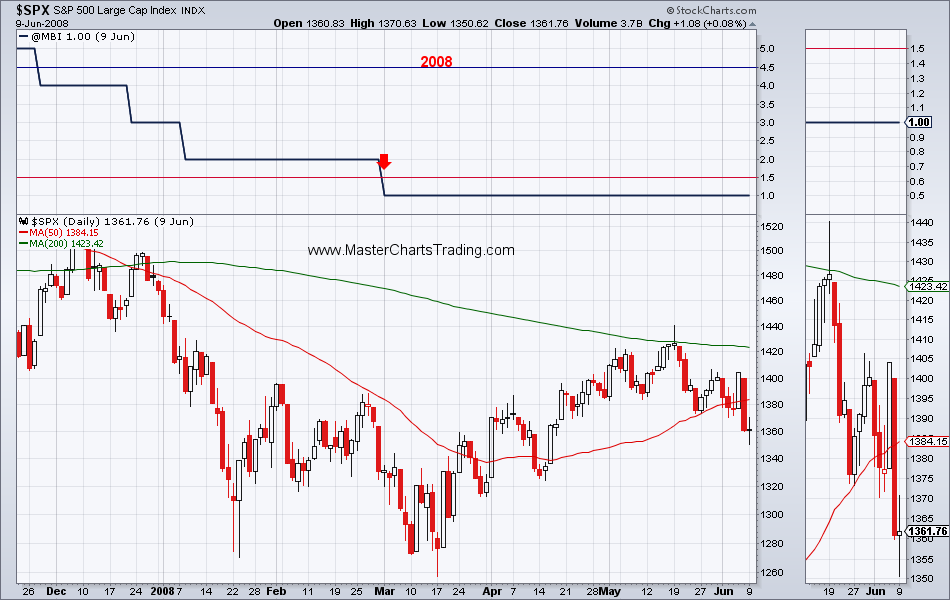
The picture at the start of the latest bear market of 2008 looks a bit more like what we have today. The 50-day MA crossed below the 200-day MA in December of 2007. Then MBI followed suit and signaled a change from a bullish to a bearish posture. Immediately after the MBI flipped bearish, stocks rallied and recaptured the 200-day MA. But was that enough? No. MBI never flipped into a bull mode and stocks rolled over with a vengeance. $SPX lost around 60% of its value before finally bottoming out in 2009.
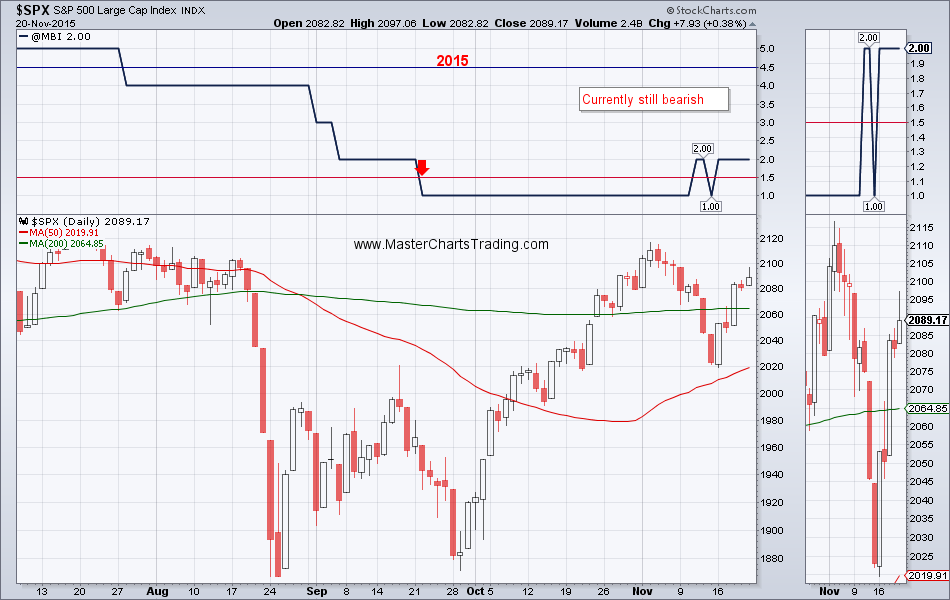
What does the picture look like today? Today’s picture in stocks looks more like it looked back in 1973 and in 2008 beginnings of bear markets and less like it looked back in 2011 and 2010 corrections. Can stocks reverse and rally hard from here and negate the bearish MBI signal? Of course they can! But based on the previous 3 examples as outlined above it is unlikely. At best I can visualize a scenario of the stock indices struggling close to their highs and more sideways consolidation. More likely is at least a retest of August lows with a possible support break there.
CHART OF SPY
CHART OF SPY
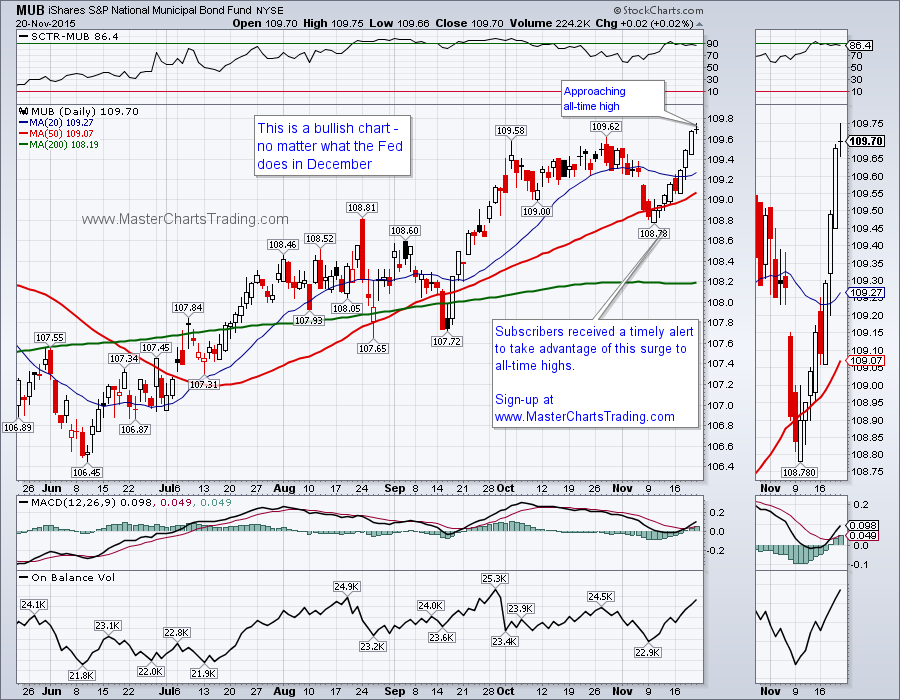
Bond markets seem to be shrugging off the potential interest rate hike in December. Various bond funds held their supports last week and are in the process of rebounding. Municipal bond fund (MUB) is approaching its all-time highs - this looks like bullish action to me.
Chart of MUB
Chart of MUB
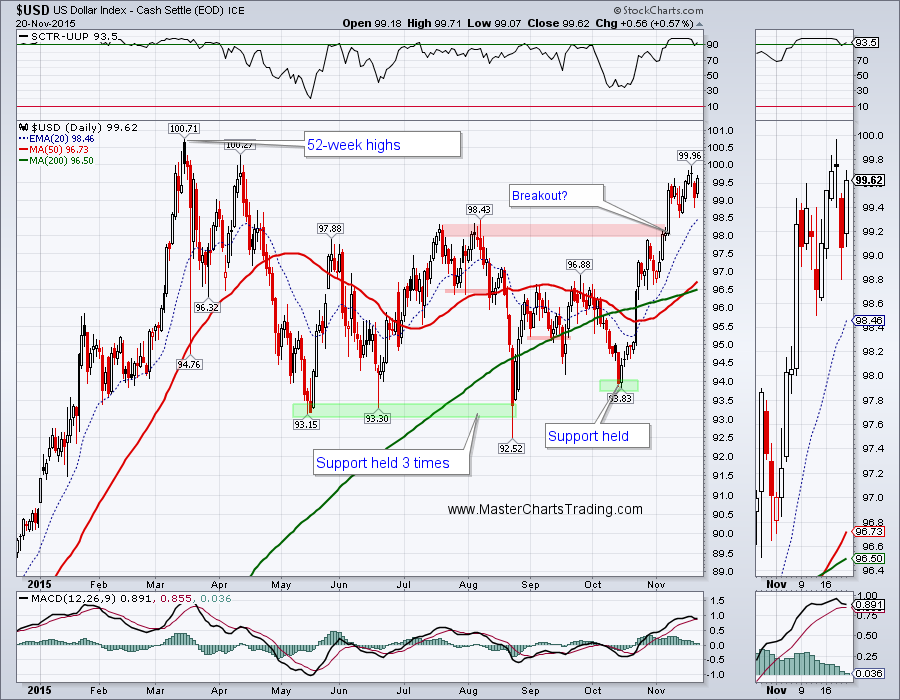
The Dollar is also approaching its 52-week highs. $USD broke out 3 weeks ago above its previous peaks and for now this breakout is holding. Mario Draghni of the European Central Bank hinted at more quantitative easing. This sent the Euro vs. the US dollar sharply lower this week. EURUSD is now approaching its 52-week lows and this is weighing on $USD. ($USD is composed of almost 58% Euro.)
Chart of $USD
Chart of $USD
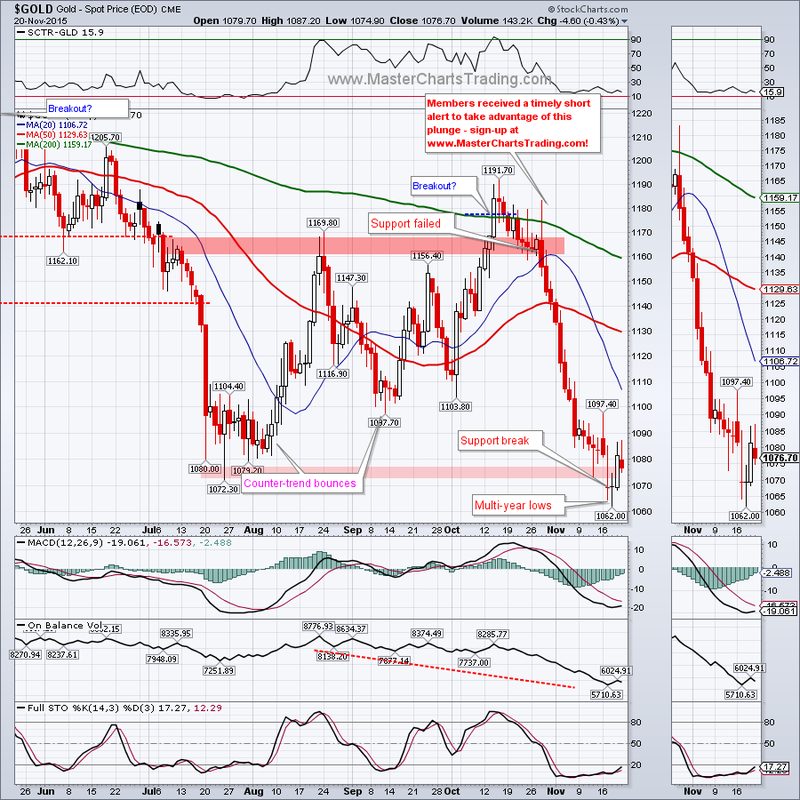
Gold broke support this week with a close below $1072.30 - a multi-year low that was set back in July. Gold has since attempted a quick rally back above the broken support. On the heels of potentially more QE coming out of Europe, the dollar is likely to benefit and this will weigh further on gold. One scenario for gold is a short-covering rally back to around $1100, while a more likely one, in my opinion, is continuation down to around $1000.
CHART OF GOLD
CHART OF GOLD
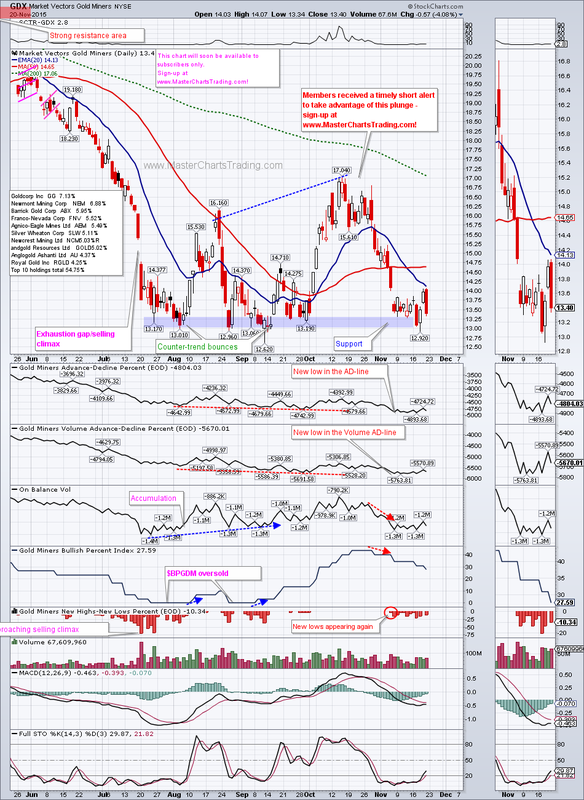
Gold miners (GDX) again are trading around the $13 level. This level previously held significance to GDX as it rebounded off of it. If gold continues down, GDX is surely going to follow it. A support break here could put GDX around the $10 level in the not so distant future. Another possibility is a rebound to around $14.75 where the 50-day moving average currently is.
CHART OF GDX
CHART OF GDX
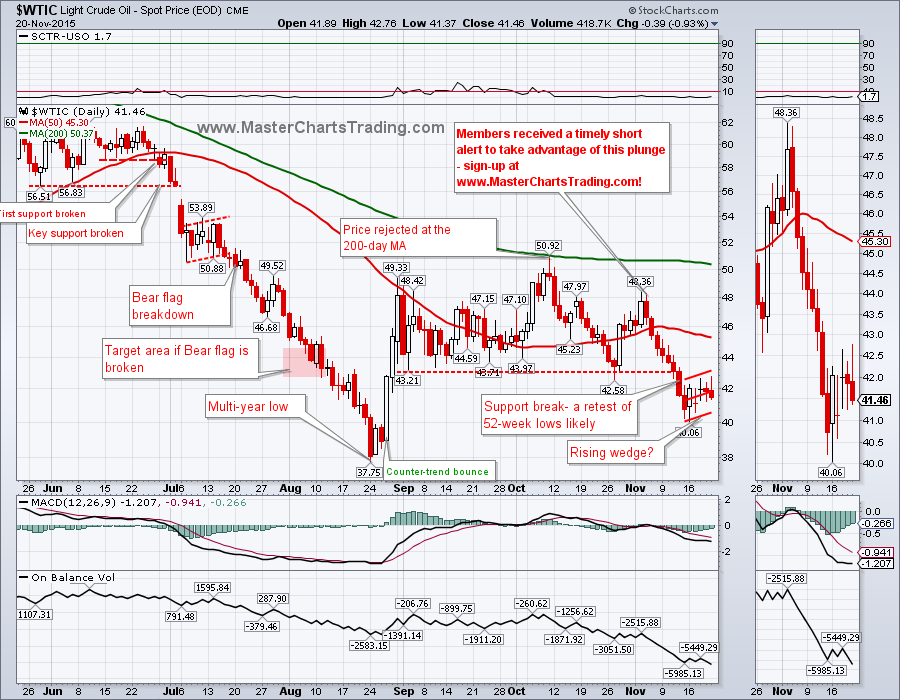
Oil ($WTIC) broke support last week with a close below $43.21. I have been pointing out this level for many weeks - it being critical to the fate of oil prices in the short-term. This week oil spent its time rebounding back to this broken level with a rising wedge pattern of sorts. Rising wedges are bullish while rising, but once broken (in a bearish security) call for significantly more movement to the downside. A retest of multi-year lows around $37.75 is very much in the cards still.
CHART OF OIL
CHART OF OIL
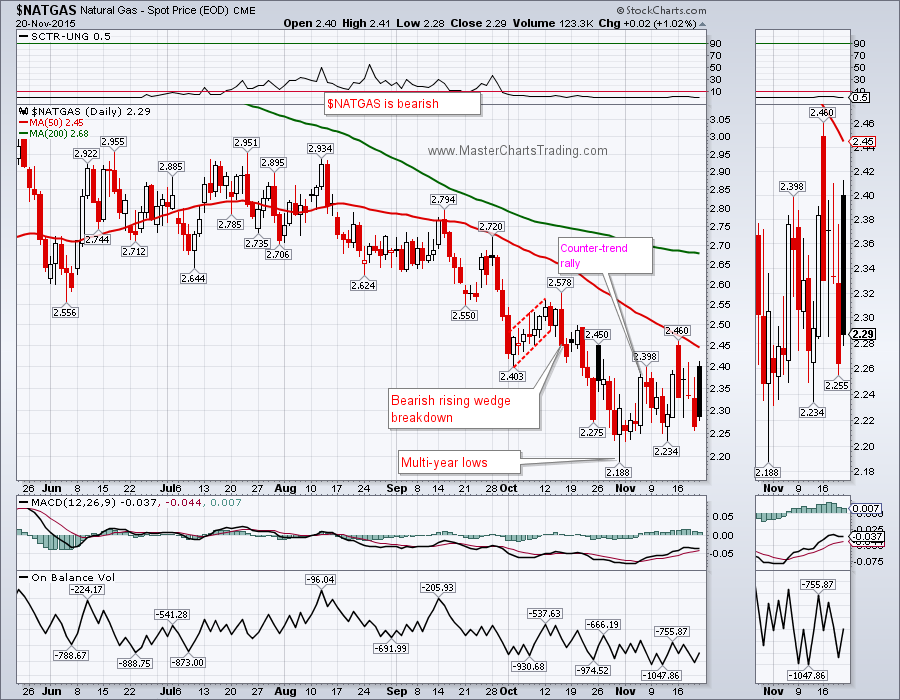
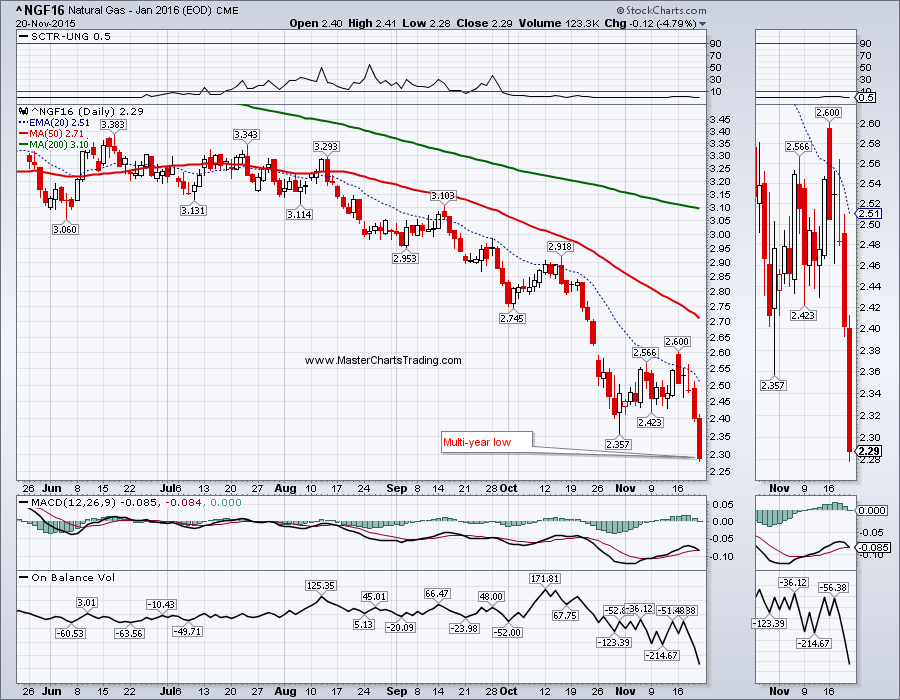
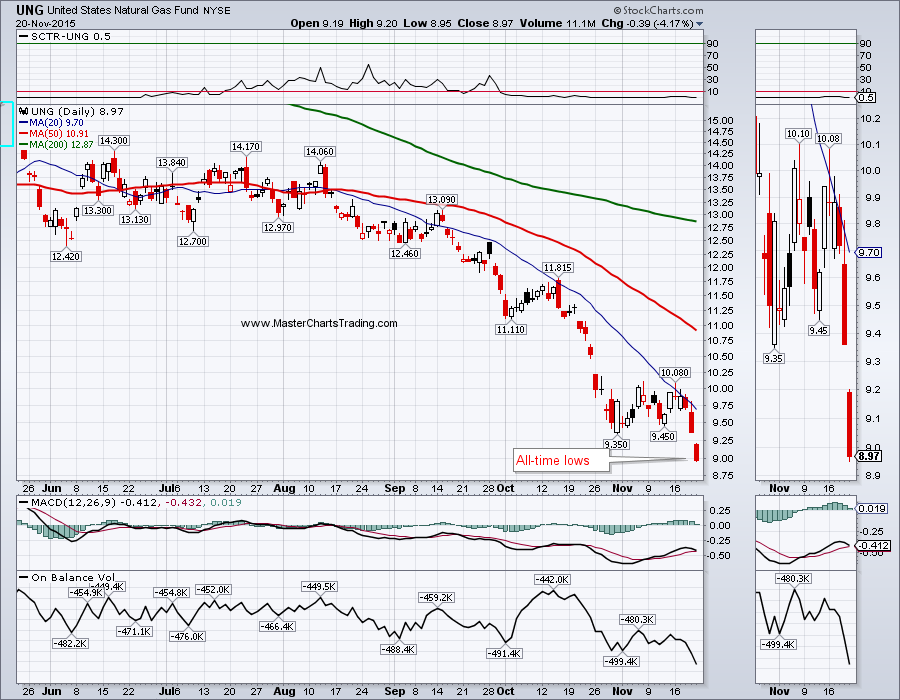
Natural gas ($NATGAS) is still very much in a bear market. About a month ago I pointed out that NATGAS might have reached at least a temporary bottom and a rebound to around $2.50 is possible. That rebound proved fleeting and this week we saw the January 2016 natural gas contract hit a multi-year low. UNG – the natural gas tracking ETF followed suit and hit all-time lows. Bottom picking a bearish security is fraught with dangers – I strongly suggest traders avoid the urge to bottom pick.
CHART OF UNG
CHART OF UNG
That’s it for this week’s market recap,
Best Regards and have another great trading week!
Alexander Berger (www.MasterChartsTrading.com)
Best Regards and have another great trading week!
Alexander Berger (www.MasterChartsTrading.com)


 RSS Feed