|
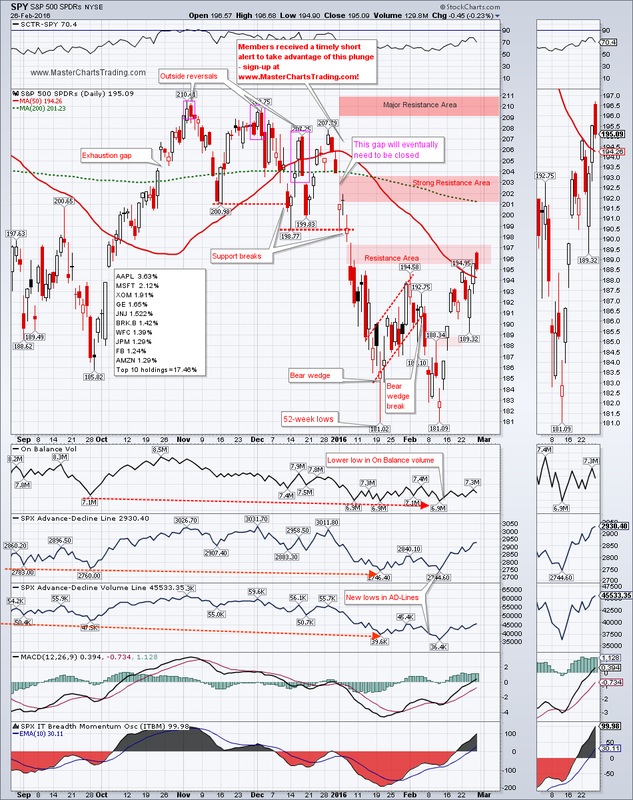
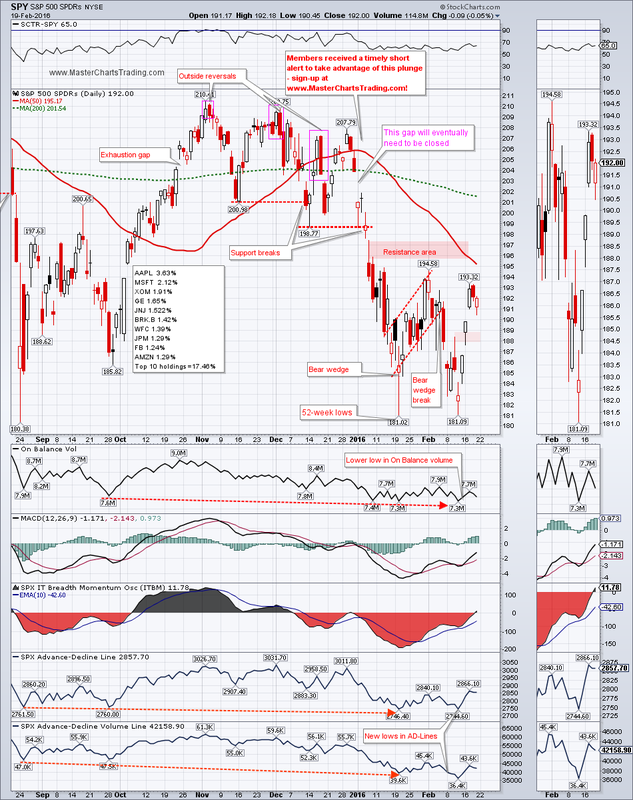
On Thursday, February 25, 2016, S&P 500 was finally able to close above the 50-day moving average for the first time this year. SPY gained 1.61% for the week.
On Friday, SPY attempted to push higher, but ran into a resistance and closed near the lows for the session. For now the resistance in the $197 area was reaffirmed. Further up in the $203 area is a large unfilled gap-down. Together with the declining 200-day moving average that area should now act as strong resistance. This is all provided if SPY even gets to that area. Even higher in the $210 area are the previous all-time highs. If the resistance around $203 gives, a run-up to all-time highs cannot be excluded. CHART OF SPY |
|
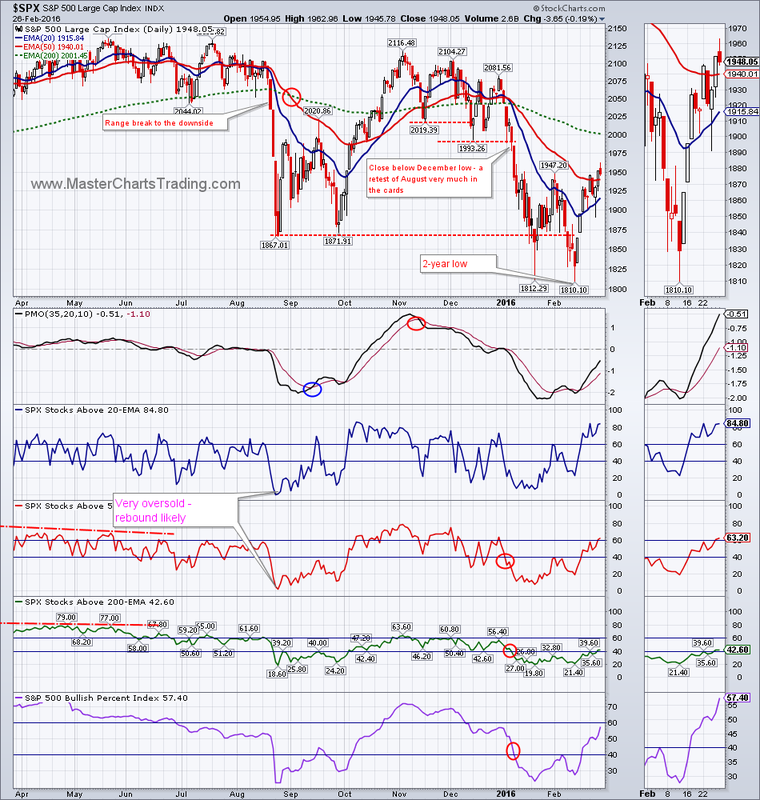
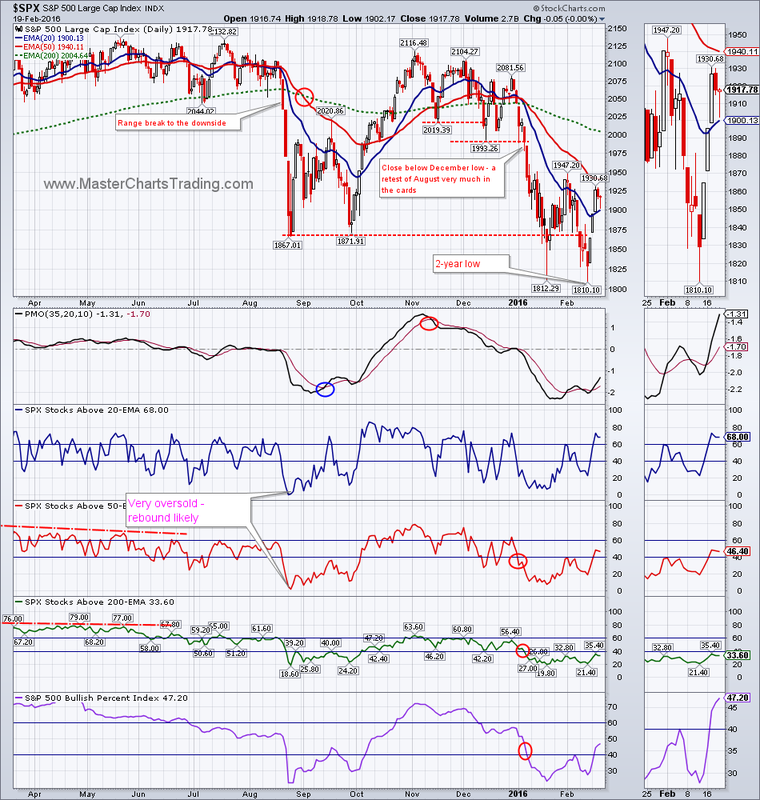
CHART OF $SPX
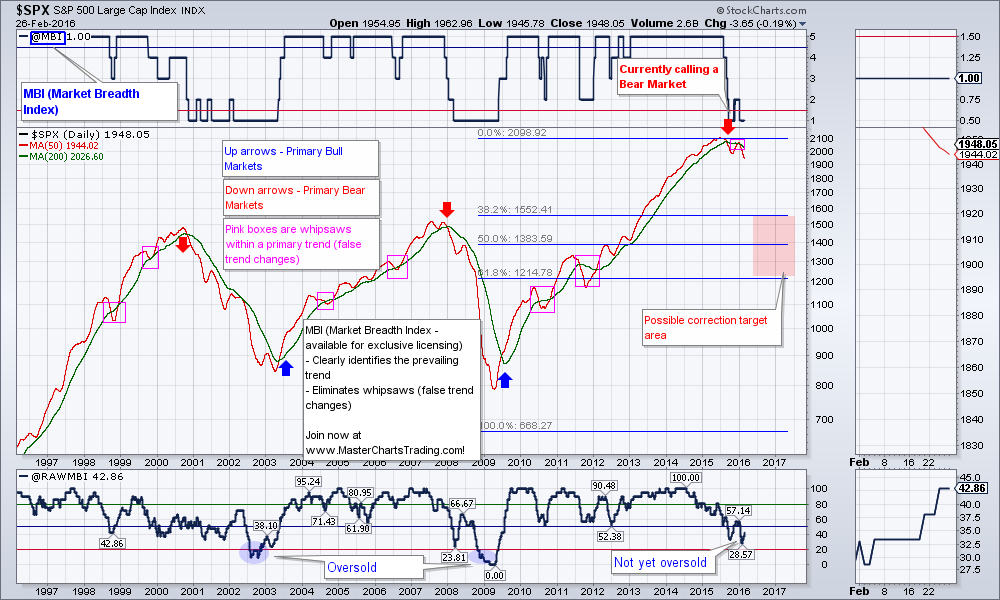
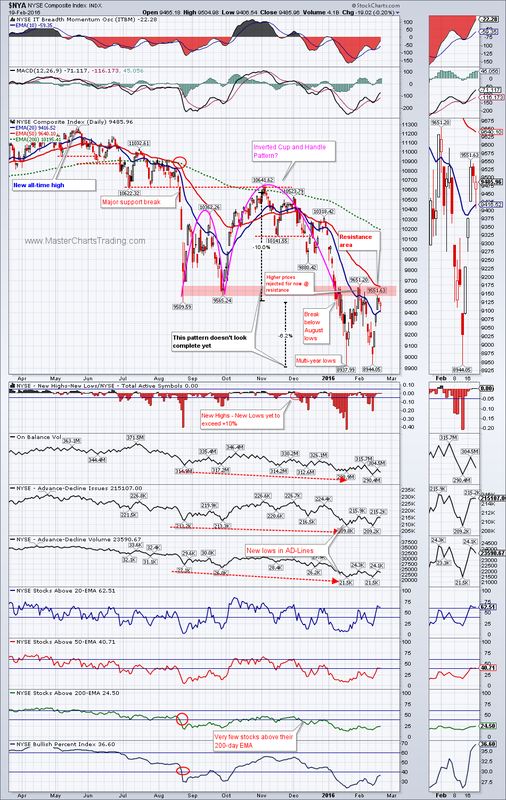
… if it wasn’t for the fact that stocks are in a bear market. My custom market indicator - the Market Breadth Index (MBI), entered into its bearish territory last September and is yet to turn bullish. MBI uses multiple inputs to make its determination of the general market trend with around a 90% accuracy going back to the 1970s. For now, not a single one of those inputs has flipped into the bullish camp.
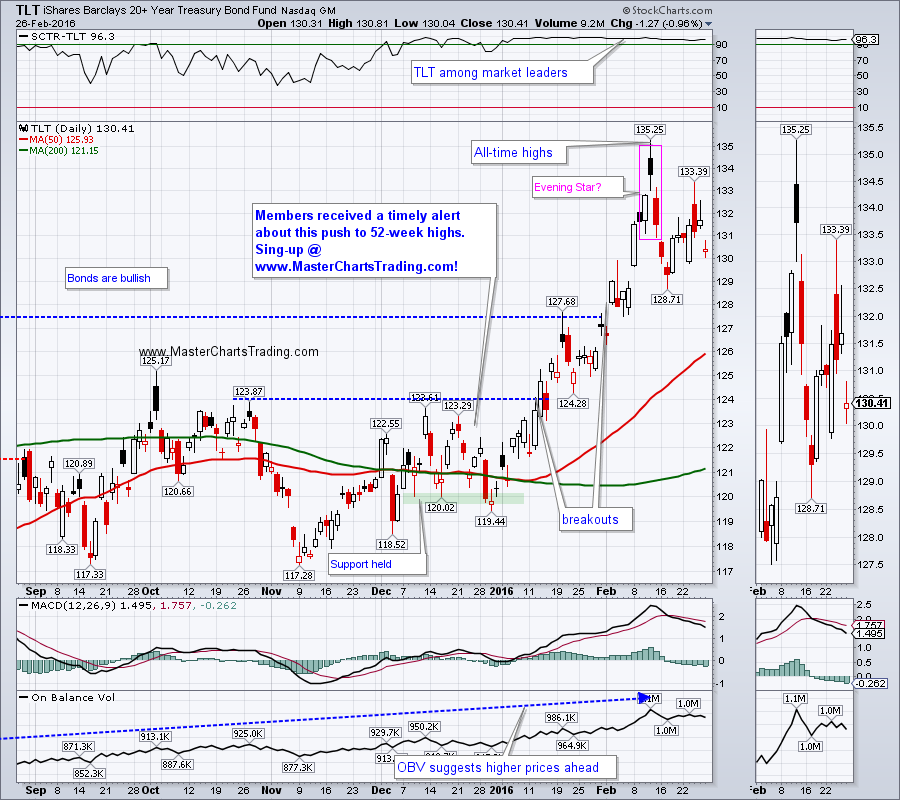
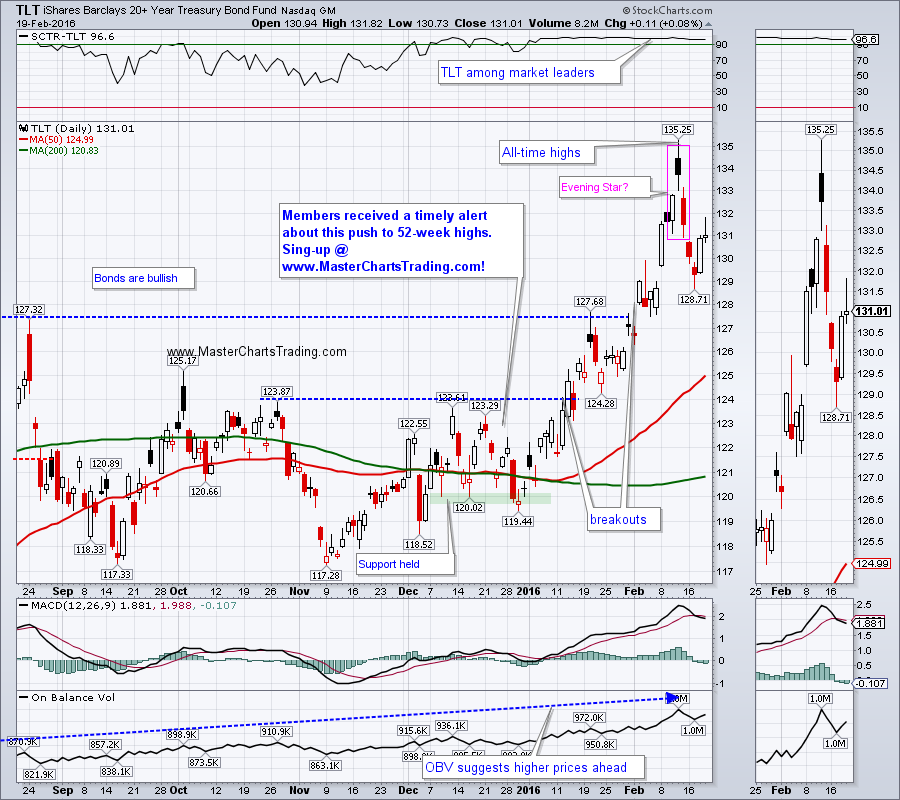
CHART OF TLT
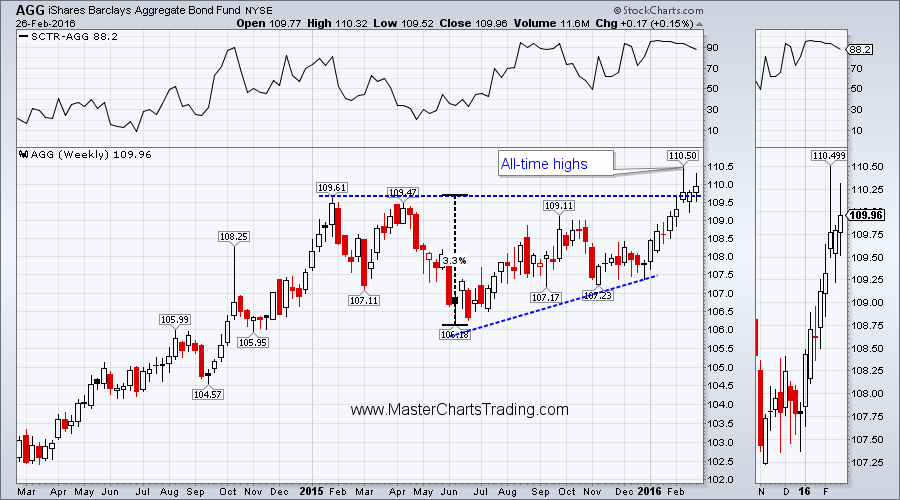
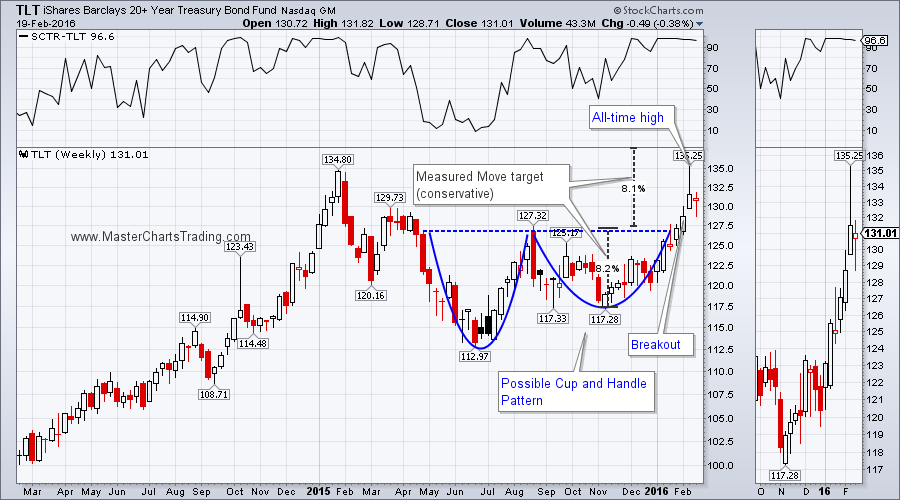
LONG-TERM CHART OF AGG
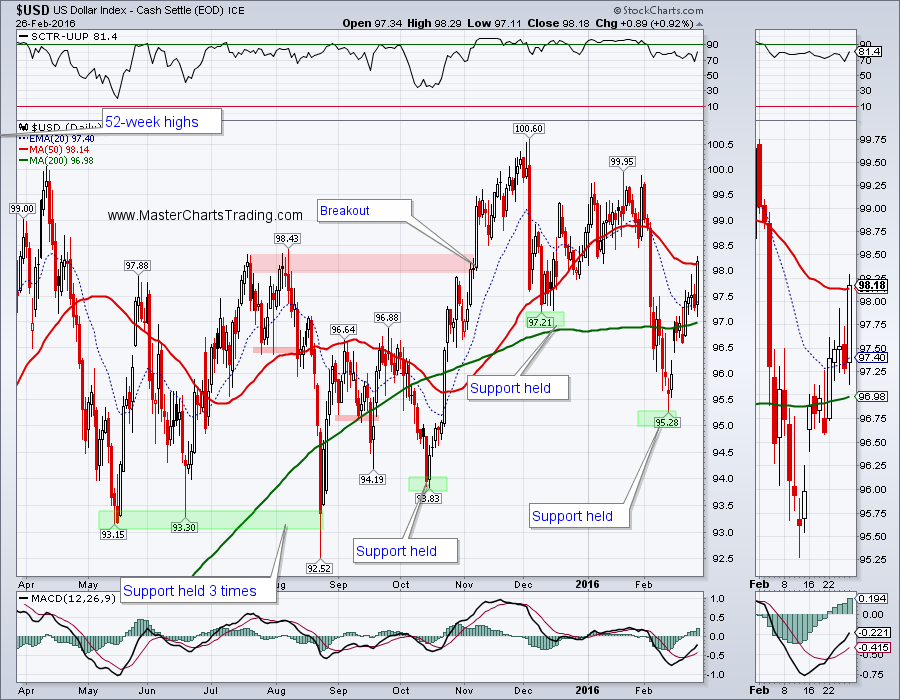
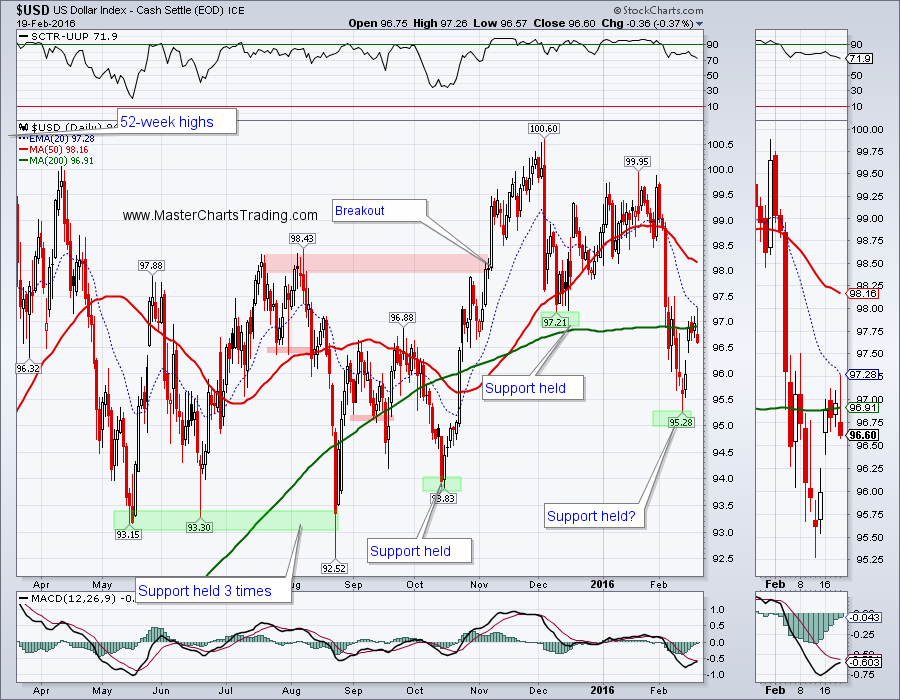
CHART OF $USD
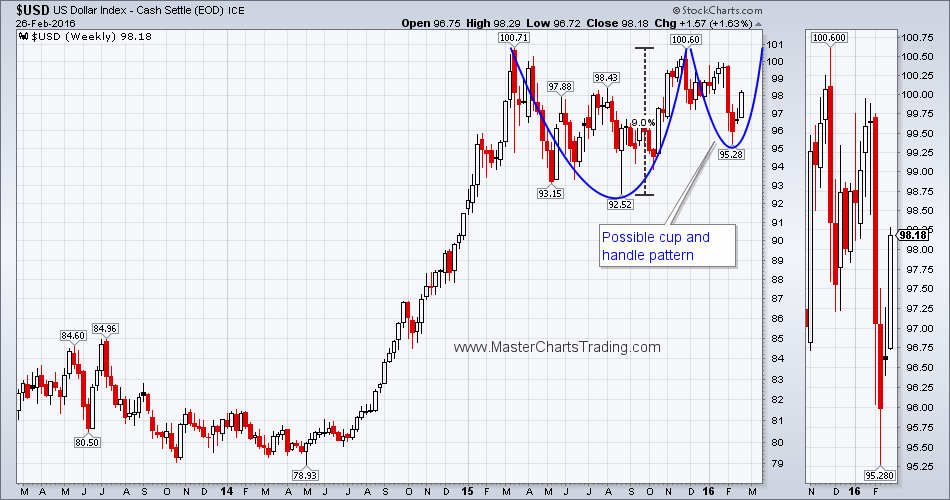
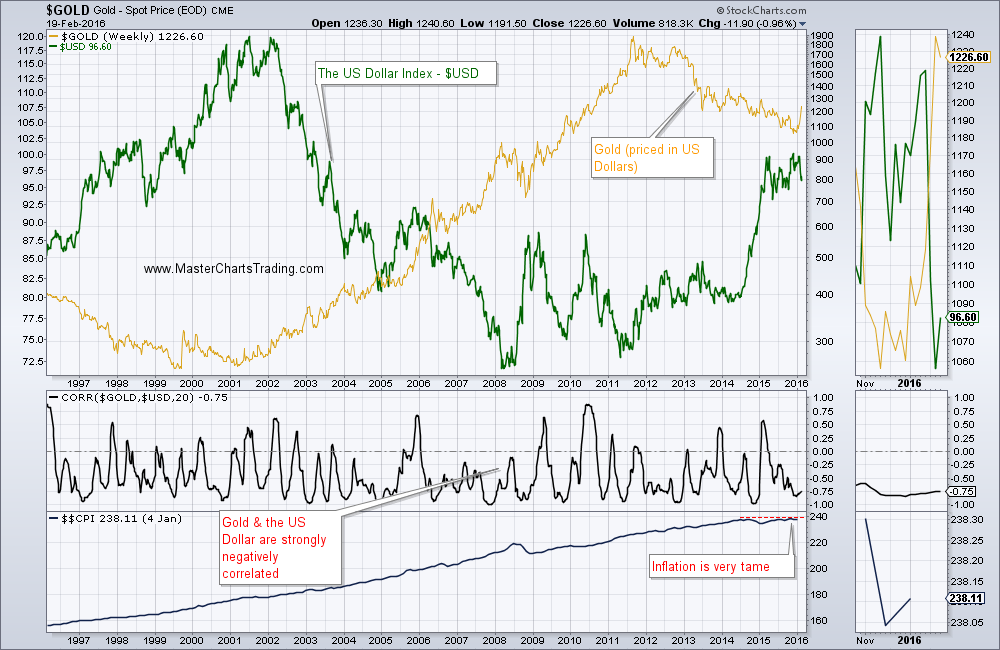
Long-term the dollar is bullish and may be poised for a major breakout to new 52-week highs. Please take a look at the chart below. This is a weekly chart of $USD going back 3 years. Notice that for the past year or so, $USD has been tracing out a potential Cup and Handle pattern. Should a breakout above the lip of the “handle” occur above 100.71, we could see a major run of another 9% or so (based on the measured move target from the bottom of the pattern). Any further strength in the US Dollar will weigh on commodities, especially gold.
LONG-TERM CHART OF $USD
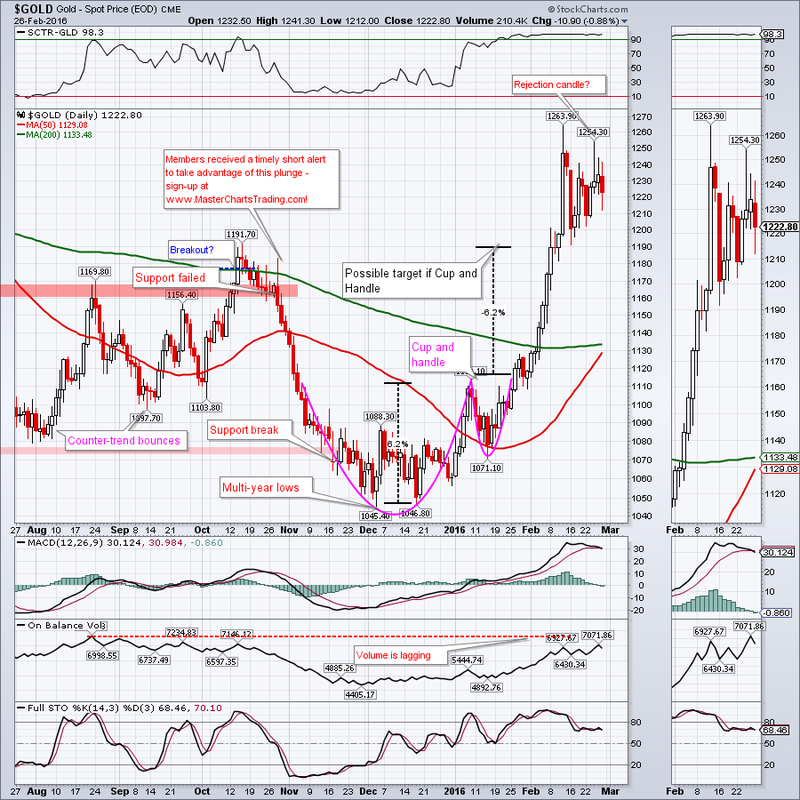
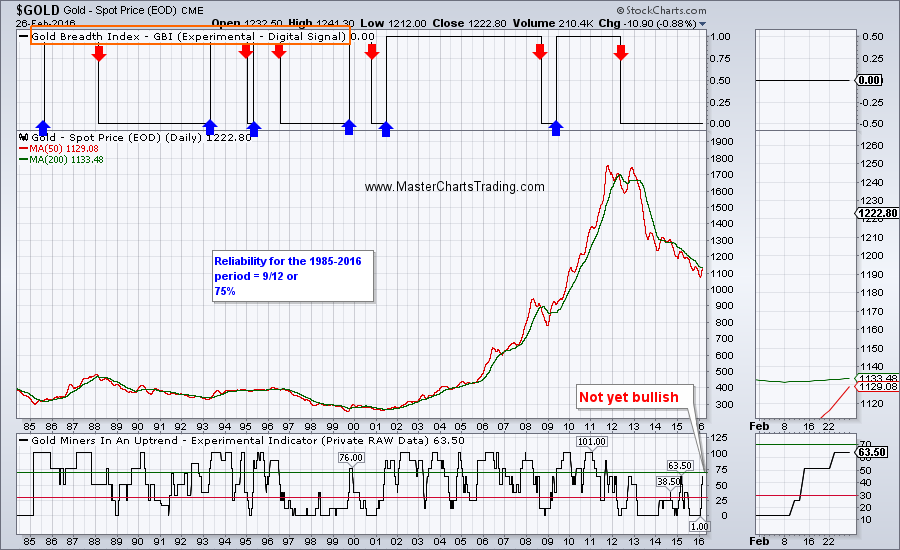
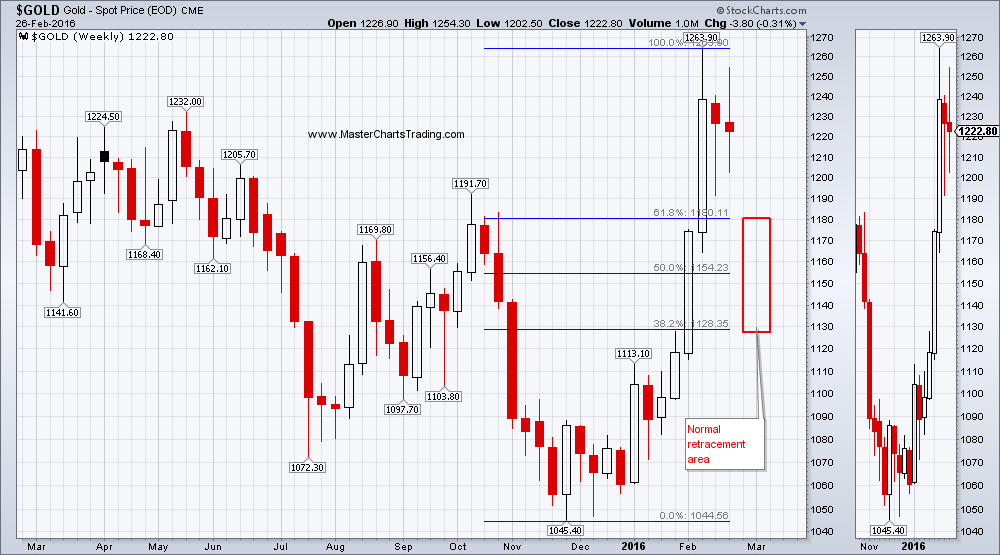
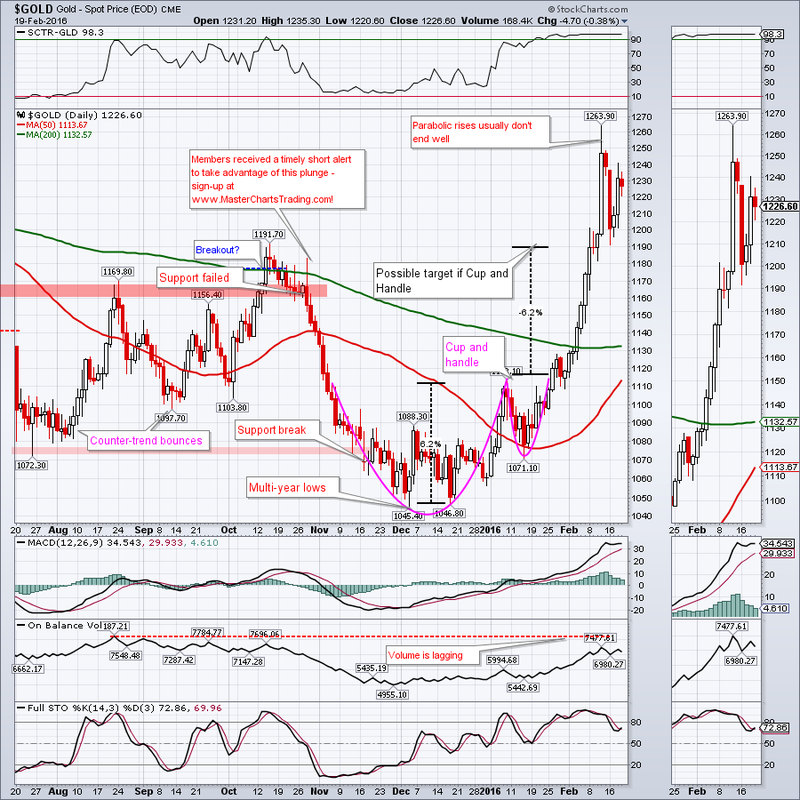
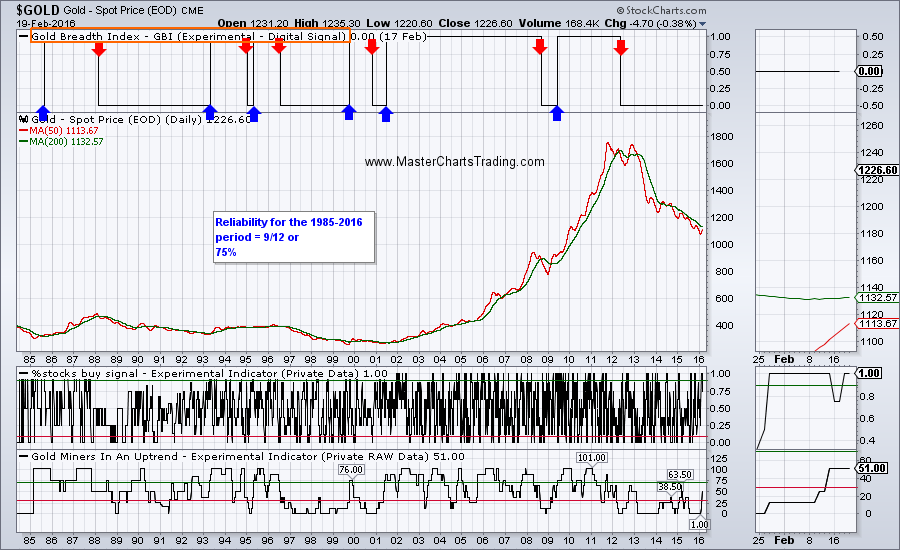
GOLD CHART
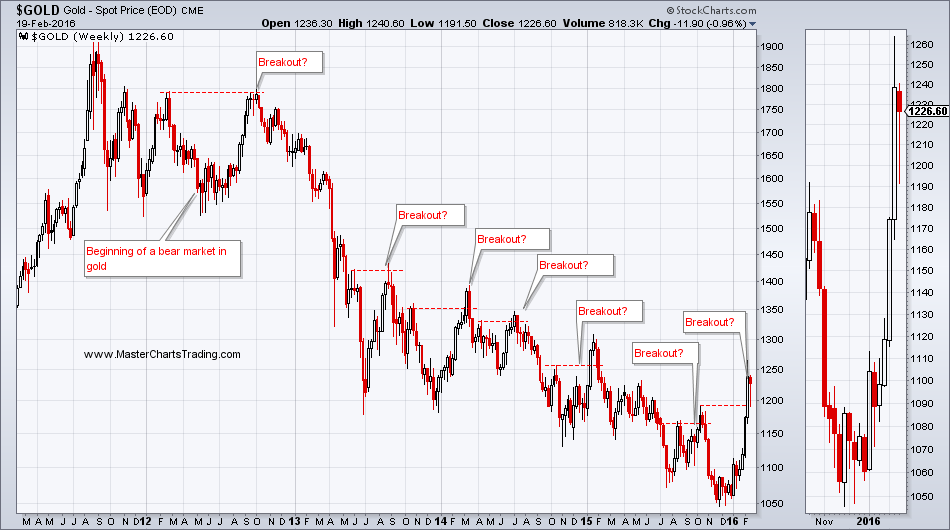
Even if gold did turn long-term bullish, a throwback to the breakout area around 1190 or even lower is almost a guarantee. An even more bearish scenario could see gold reverse and collapse to new multi-year lows.
LONG-TERM CHART OF GOLD
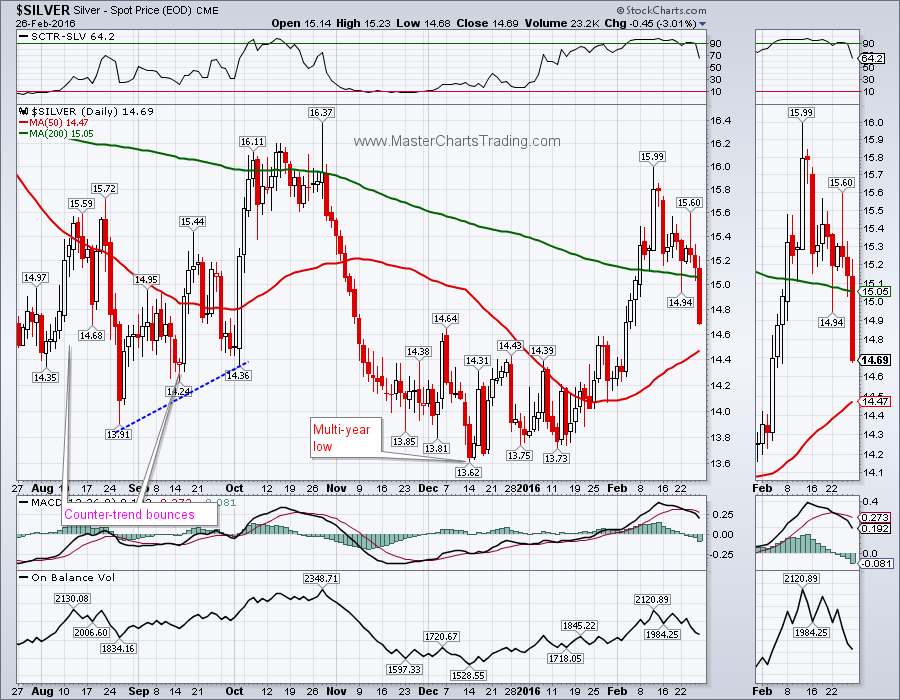
CHART OF SILVER
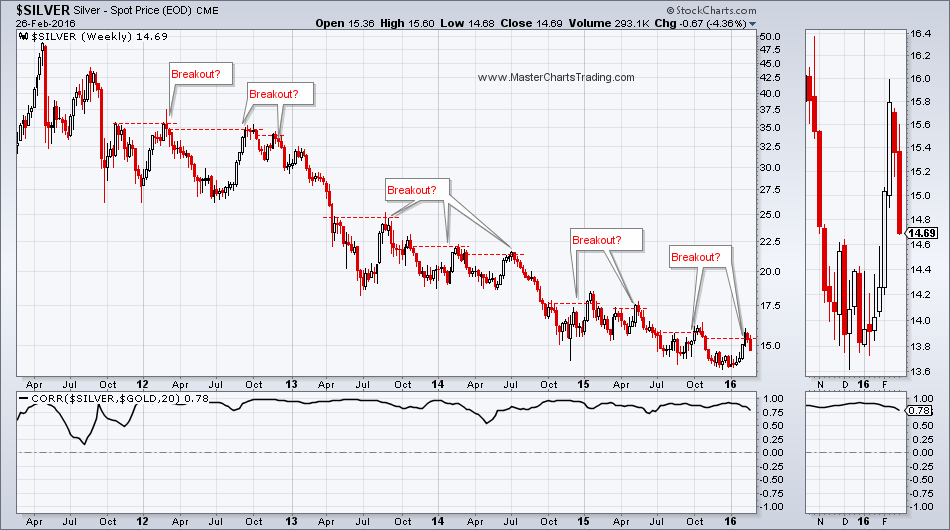
LONG-TERM CHART OF SILVER
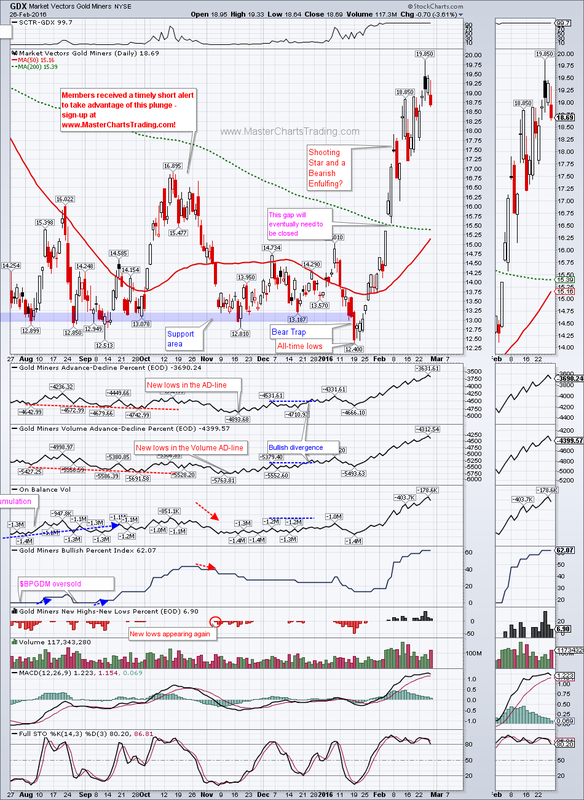
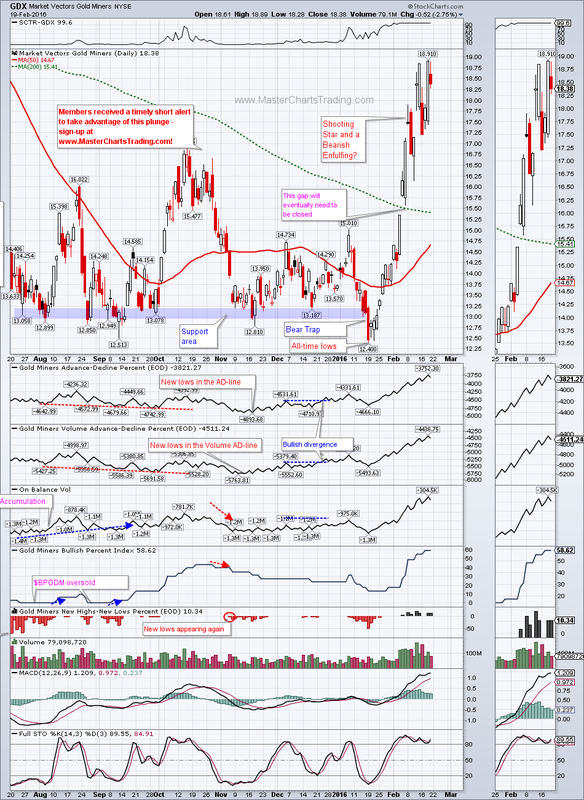
CHART OF GDX
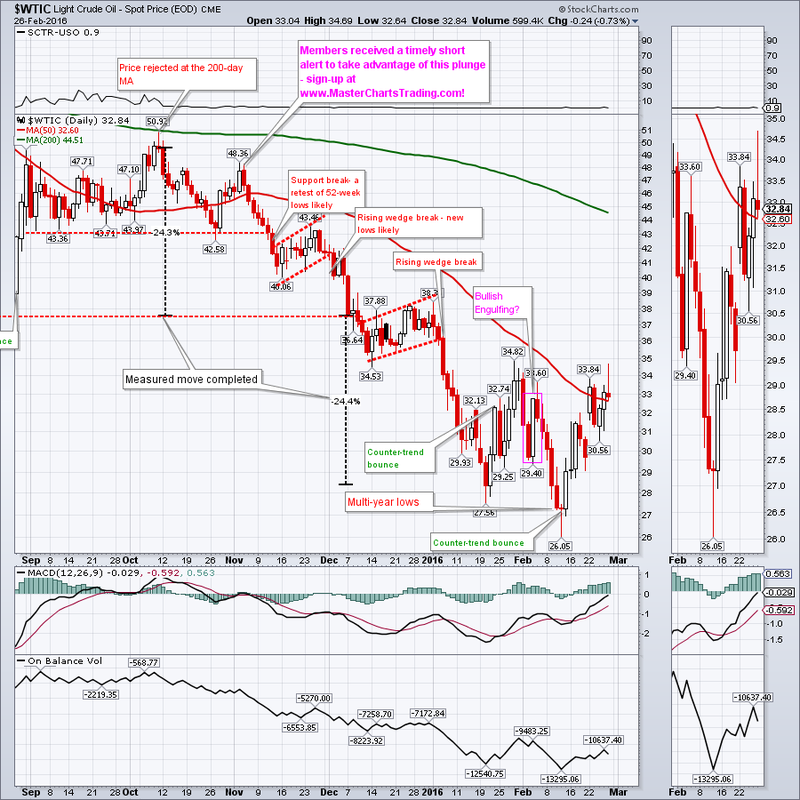
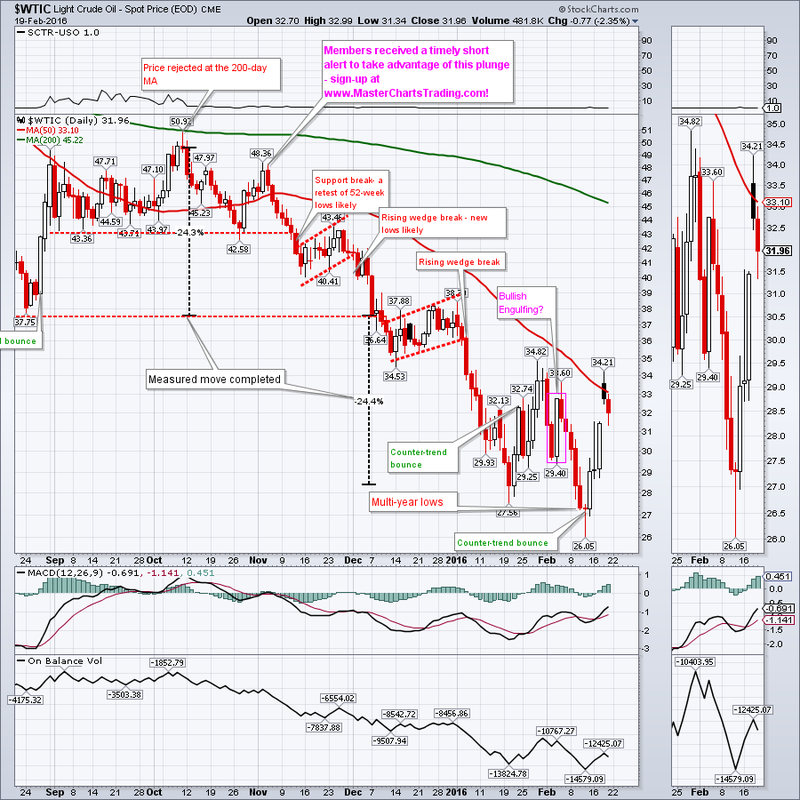
CHART OF $WTIC
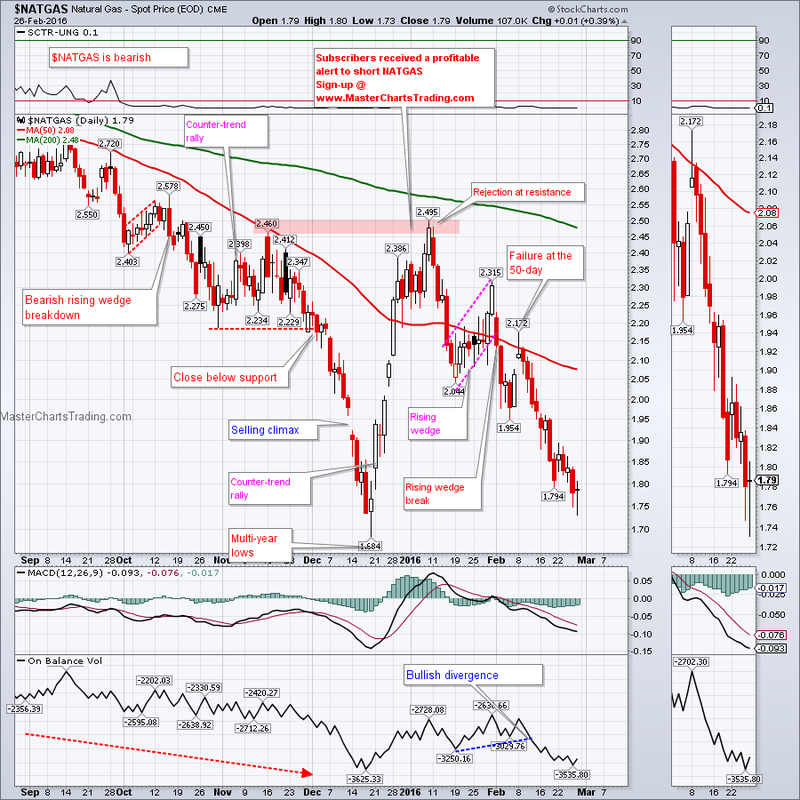
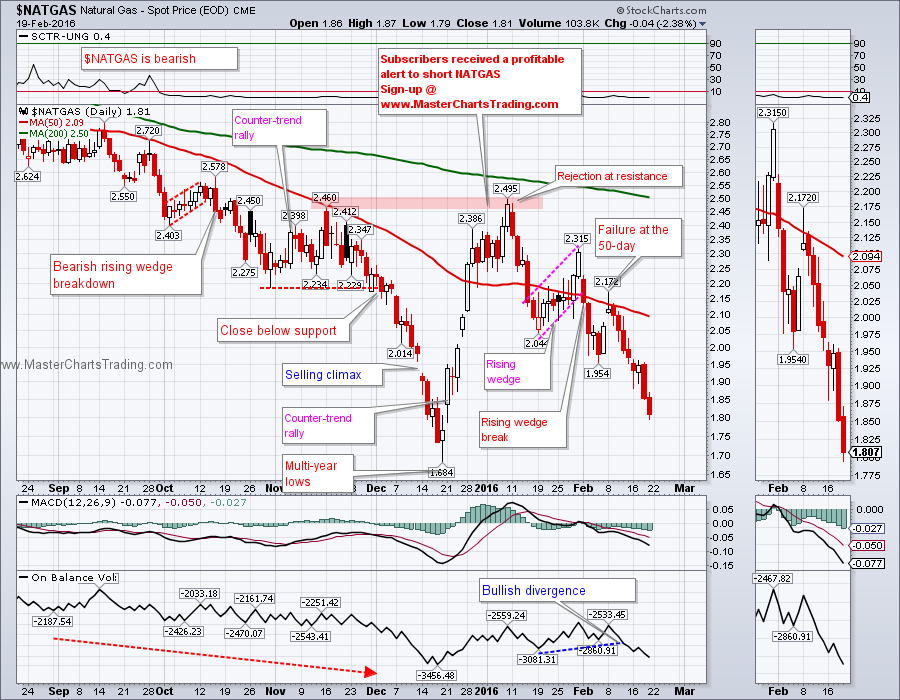
CHART OF NATGAS
That’s it for this week’s market recap,
Best Regards and have another great trading week!
Alexander Berger (www.MasterChartsTrading.com)


 RSS Feed