|
There was lots of excitement this week as S&P 500 gained 2.84%. Is this a beginning of a new bull market, or a mere pause before another leg down? Let’s try to look at the market objectively and attempt to ascertain what is going on.
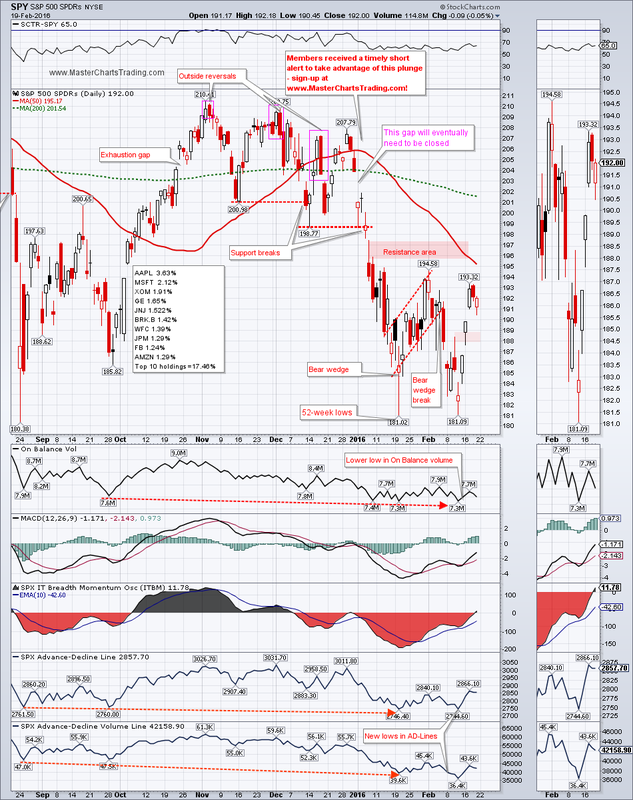
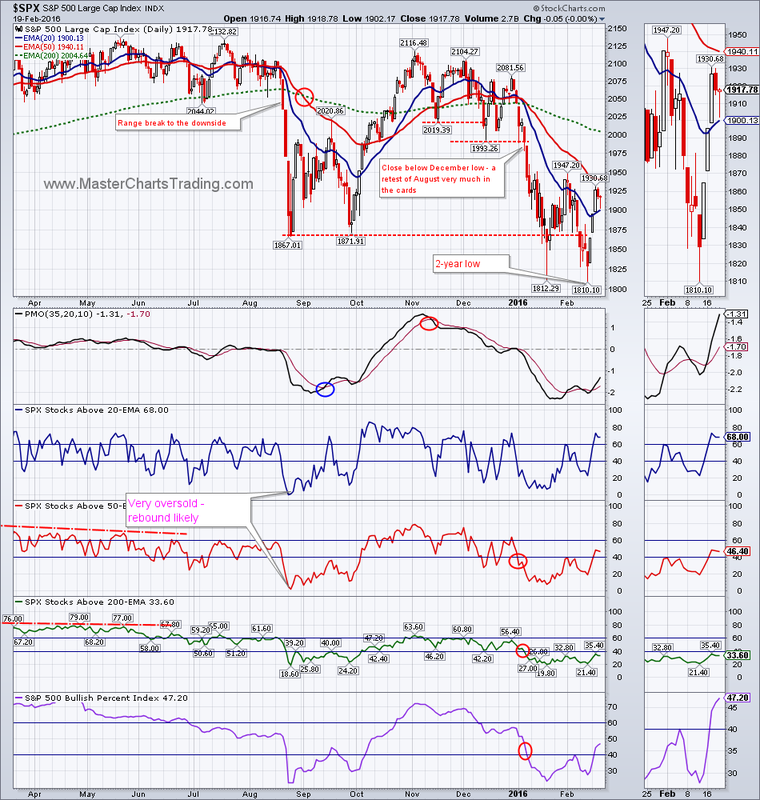
Last week SPY printed a spinning-top candlestick, then Monday, Tuesday and Wednesday there were gap-ups, followed by a run higher. If SPY was in a long-term uptrend, I would not hesitate to call it a strongly bullish action. However since we are in a long-term downtrend, the best I could say is that this bounce is a strong short-covering rally. As a matter of fact, SPY is already getting somewhat overbought. Just slightly higher is the steeply declining 50-day moving average and a small gap-down around $195-$197. A rejection in that area would be most bearish and new lows very likely. CHART OF SPY Market breadth for $SPX is still decisively bearish. If anything, this rebound could be a setup to short again. CHART OF $SPX |
|
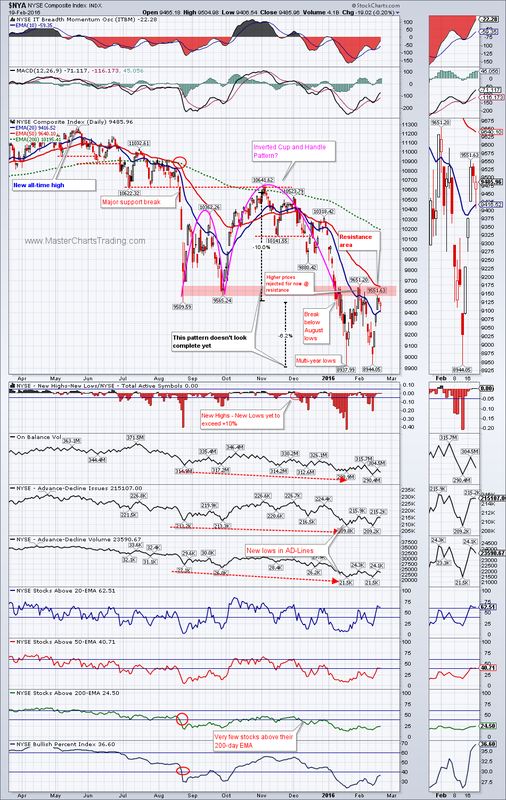
The broader NYSE composite average ($NYA) is already at a strong resistance defined by the January breakdown and the early February rejection in the 9651 area. Again, the 50-day EMA is just above, while index itself is already somewhat overbought. This is a recipe for a drop, should another rejection come to be.
CHART OF $NYA
CHART OF $NYA
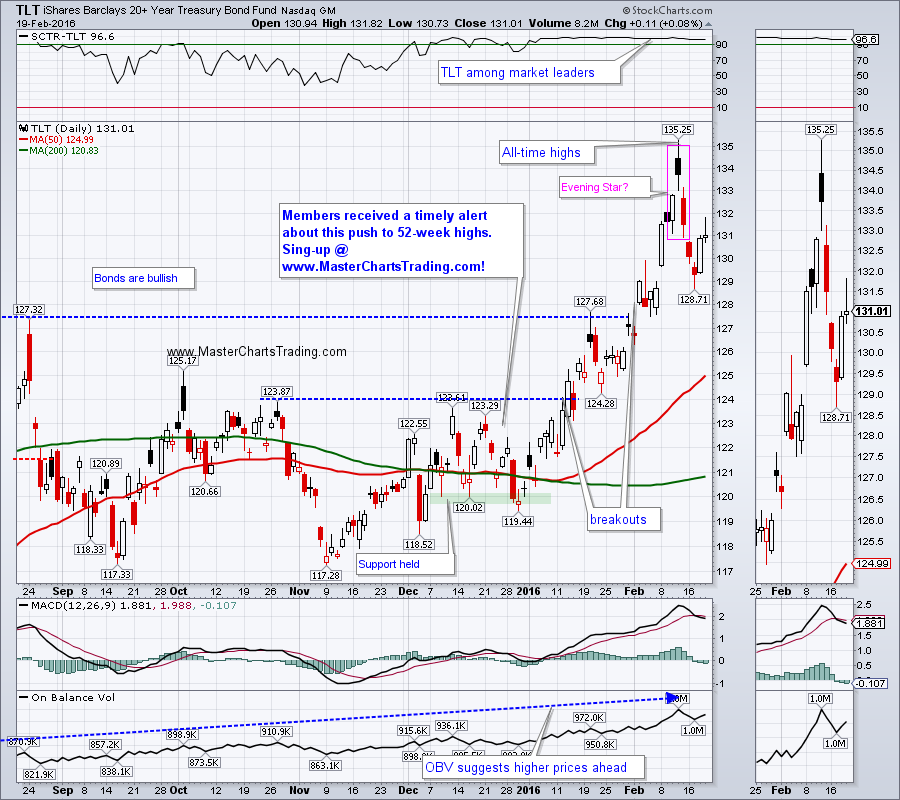
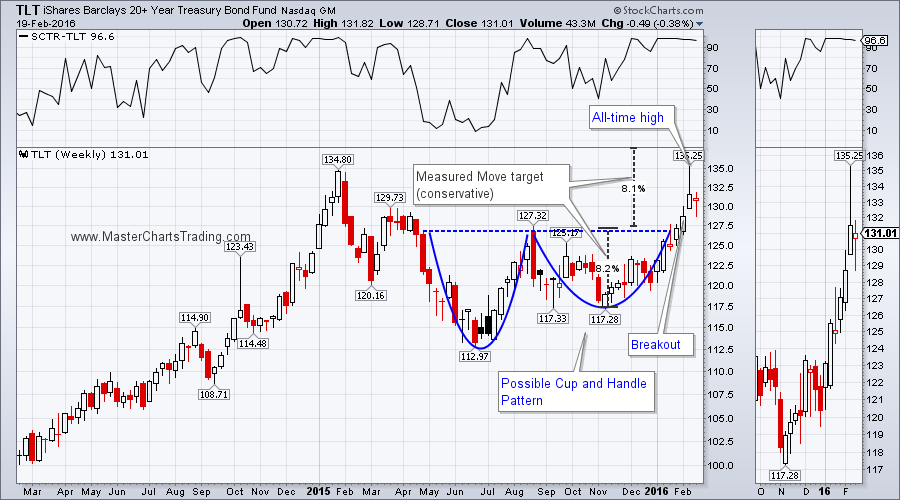
In the bond universe things are looking much brighter. TLT hit an all-time high just last week and pulled back. This week TLT retested its breakout above the $128 area, for now successfully. We may get another retest or simply continue higher. The long-term chart shows a potential conservative target for the move to around $138.
CHART OF TLT
LONG-TERM TLT CHART
CHART OF TLT
LONG-TERM TLT CHART
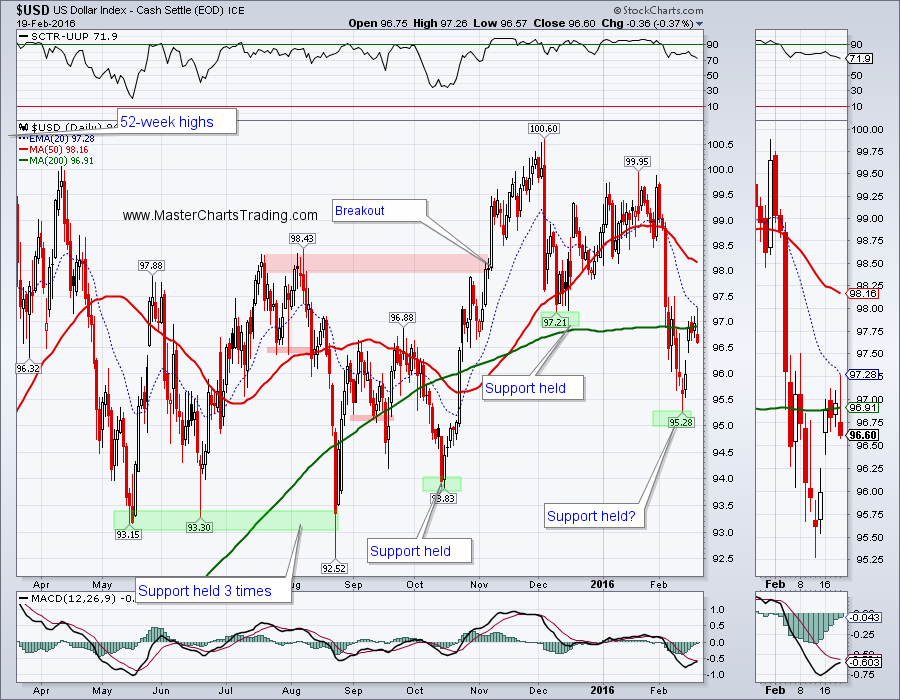
The Dollar Index ($USD) , I believe is still bullish. $USD dropped as low as 95.28 last week, but has bounced since. Especially encouraging is the gap-up on Tuesday, which is still holding. This gap may get retested next week. Should this gap area hold support, next stop would be the 50-day moving average around the $98 area.
CHART OF $USD
CHART OF $USD
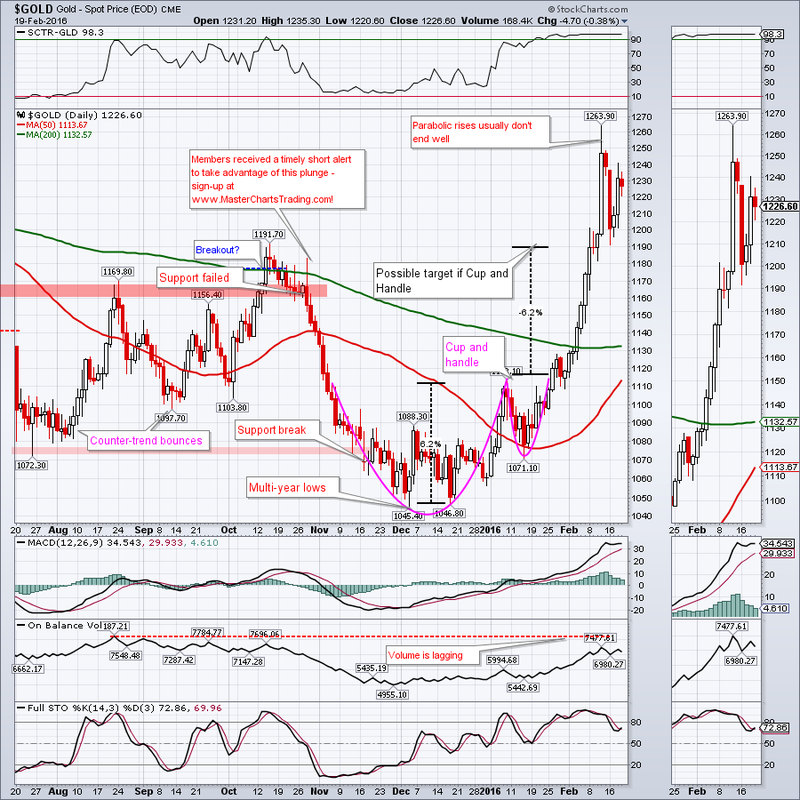
Gold generated a lot of excitement of late, with its possible breakout. I am taking some flak for daring to call this breakout “possible” still. This is fine - I welcome a civil discourse! Please understand, I have no ideological opposition to buying gold, I just want my investments to be bullish when I am accumulating them. If/when gold becomes bullish; I would happily be looking for buying opportunities within the bigger uptrend. But as of the close on Friday, February 19, 2016, I think gold is still in a bear market.
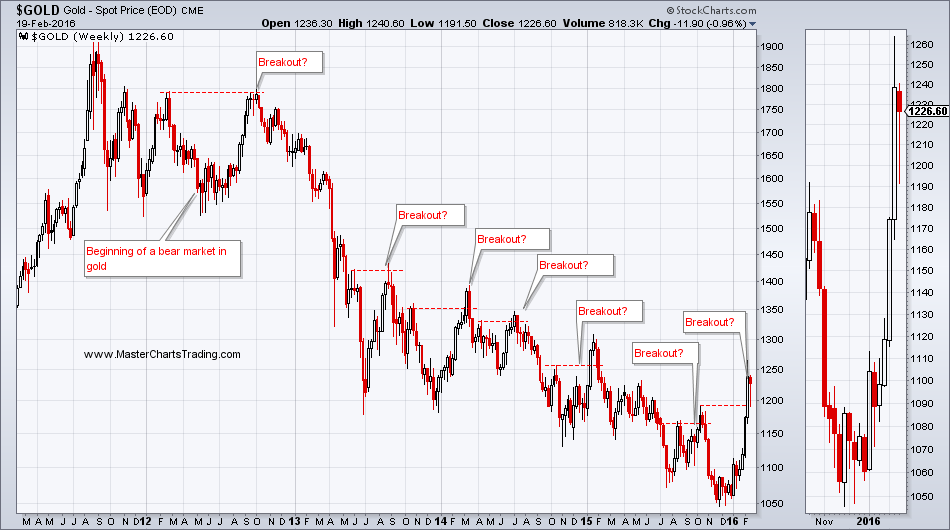
Lets take a look at some of the charts then. Gold gained a little over 21% from the multi-year lows set in early December until the February 11 peak. This is indeed a powerful move, but we had similar powerful moves in the past during the current bear market in gold dating back to 2012.
GOLD CHART
LONG-TERM CHART OF GOLD
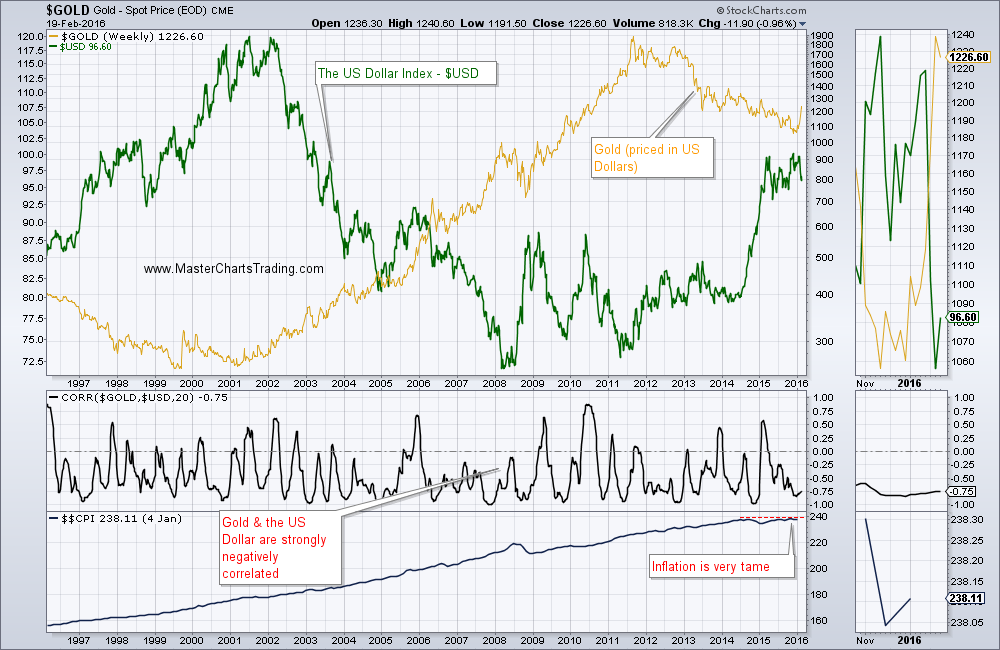
Looking at the very long-term correlation charts of gold to the $USD, we can see a rather strong negative correlation between the two. When gold goes up, the dollar is dropping and vice versa, when gold is dropping, $USD is pushing higher. Its possible that the recent price run-up in gold was simply due to the weakening of the dollar.
Additionally many people believe that gold is a good hedge against inflation. But as can be seen from the chart, inflation has been rather tame, especially of late.
GOLD vs. US DOLLAR AND INFLATION
Additionally many people believe that gold is a good hedge against inflation. But as can be seen from the chart, inflation has been rather tame, especially of late.
GOLD vs. US DOLLAR AND INFLATION
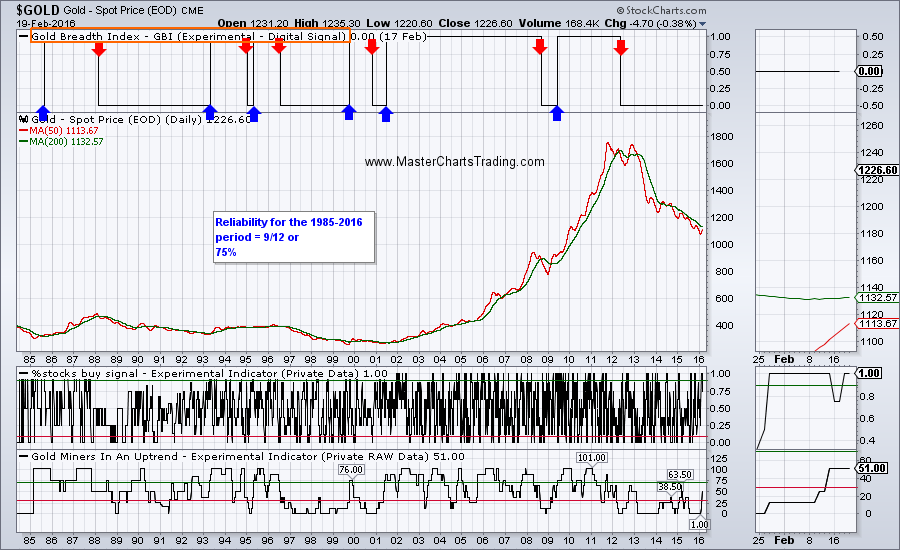
Finally, I have been developing a gold market indicator that would help with the long-term trend identification. Oftentimes one of the best way to determine if a security is in a bull or a bear market is to simply look at the 50-day and the 200-day moving averages. If the 50-day is above the 200-day, the security is bullish. If opposite – bearish. This technique gives OK results, but quite often throws whipsaws (false signals). For example, going back to 1985, there were around 32 directional changes on the gold chart if one was to use the 50x200 technique described above.
The Gold Breadth Index (GBI) attempts to decrease the number of false trend changes. GBI does this by looking at a basket of gold mining stocks and using the signals generated by the gold miners to augment those signals generated by gold itself. Take a look at the chart below. GBI was able to eliminate the vast majority of the false trend signals. In fact, as it stands right now, GBI had a reliability of 75% from 1985 till today. (Reliable data is only available from around 1985).
Point of this exercise: so far, we have not seen GBI and by extension gold turn bullish. It’s getting close, but not yet.
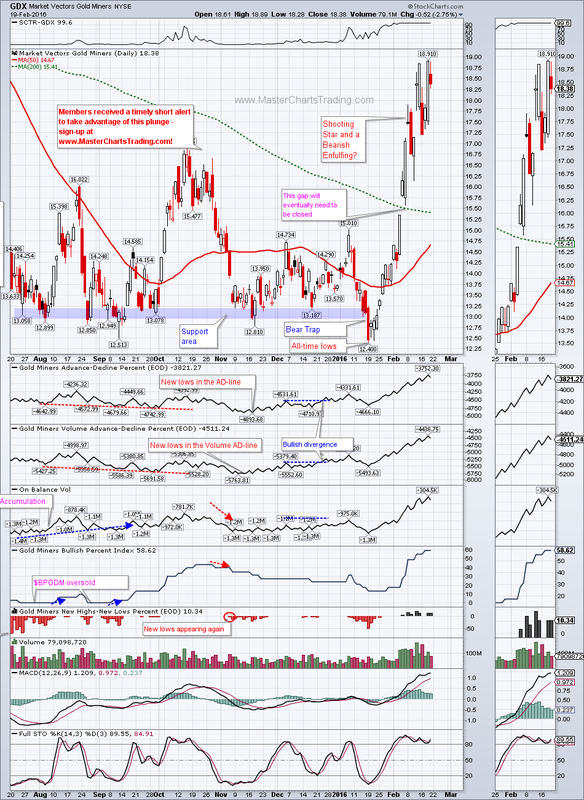
Gold Miners ETF (GDX) mirrored the movements of gold (more or less), but in its usual volatile manner. GDX is up over 50% from tis low in January! Should gold break out and GBI turn bullish, I will be happy to look for buying opportunities in GDX. For now GDX is looking like an overbought security within a bigger downtrend.
CHART OF GDX
CHART OF GDX
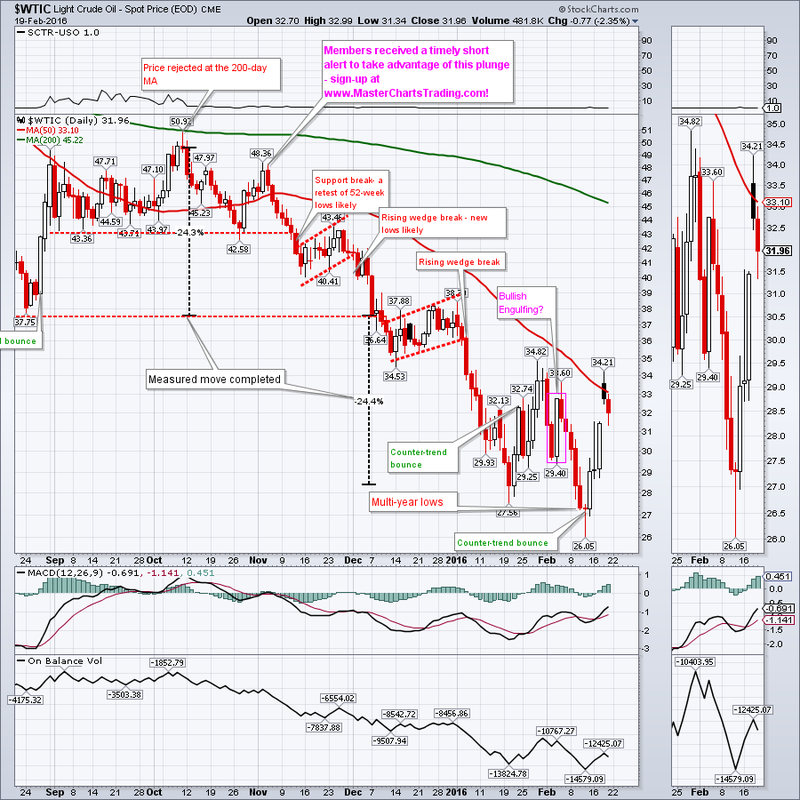
Oil started the week on a strong note, but still failed to break above the 50-day moving average. Basically its in no-man’s-land: too late to be picking bottoms, but not overbought enough to short yet. Maybe if the demand for oil picks up and the supply decreases…etc ... we will get a true rally.
CHART OF $WTIC
CHART OF $WTIC
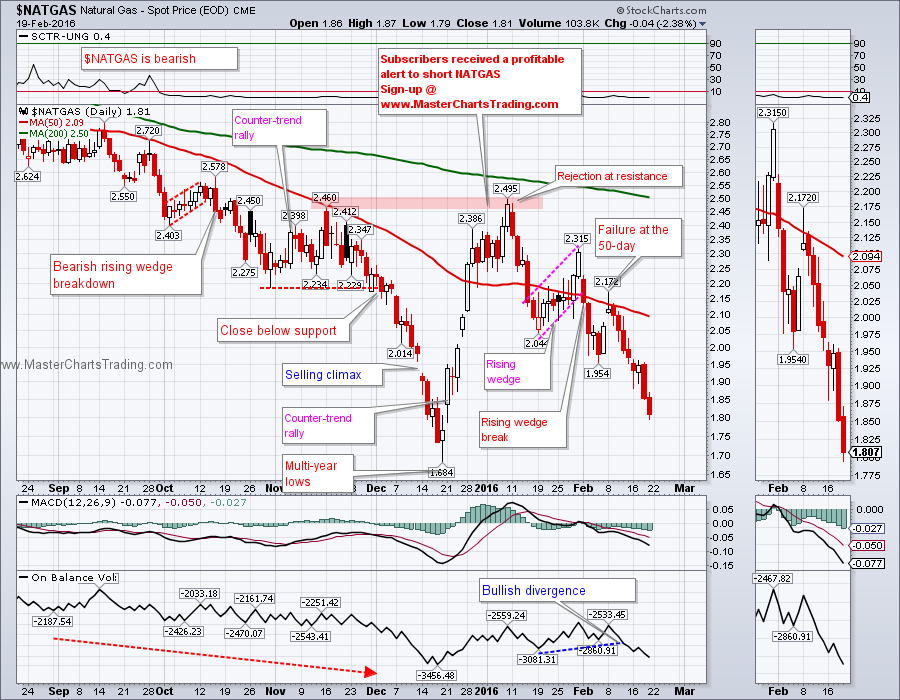
NATGAS broke down conclusively below the early February lows and is likely headed for a retest of the multi-year lows set in the December of last year. Would those lows hold?
CHART OF NATGAS
CHART OF NATGAS
Trade Alerts Service is now live – please sign-up here!
That’s it for this week’s market recap,
Best Regards and have another great trading week!
Alexander Berger (www.MasterChartsTrading.com)
That’s it for this week’s market recap,
Best Regards and have another great trading week!
Alexander Berger (www.MasterChartsTrading.com)


 RSS Feed