Master Charts Trading - Stock Market Indicators & Trade Alerts
Connect To Us!
  • MasterChartsTrading
  • Blog
  • Sign-Up
  • Members
    • Elite Trading Blog
    • Stock Speculator Blog
    • Training Library >
      • Basics of Trading
      • Risk & Trading Psych
      • Trend Identification
  • Help
    • Hall of Fame
    • Social
    • About Us
    • Contact
    • FAQs
    • Disclaimer
    • Refund Policy
    • Privacy Policy
    • What We Trade
    • Newsletter samples

It was a Big Day on Wall Street

2/28/2014

0 Comments


Thursday, February 27, 2014

It was a Big Day on Wall Street

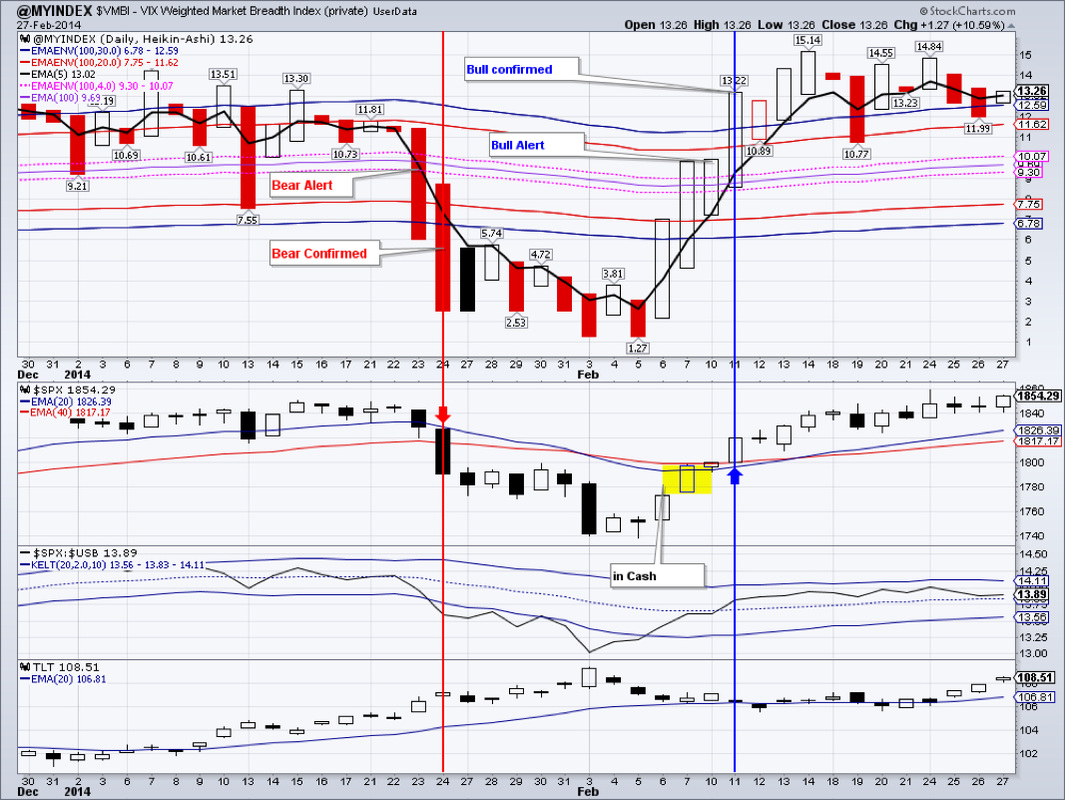
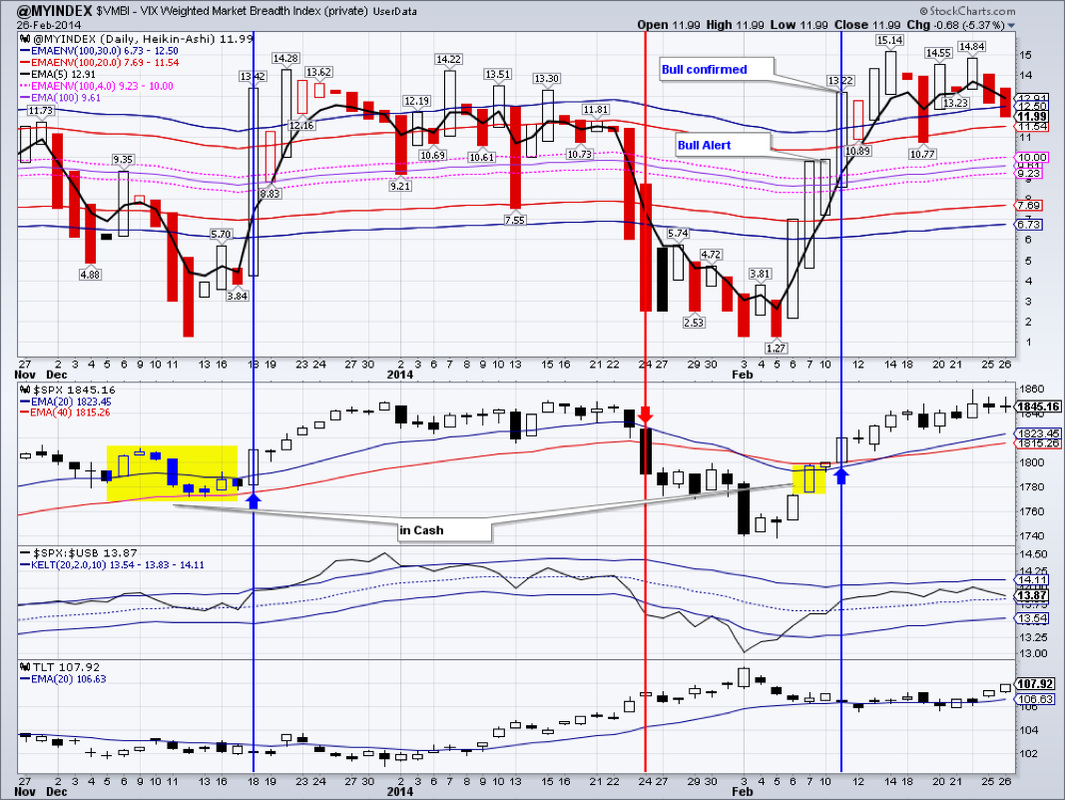
Today the S&P 500 and the Russell 2000 indices finally managed to put in an all-time high on the closing basis. In combination with a strong market breadth index reading ($VMBI), this tells us that markets are headed higher in the short to medium-term.

Gold closed at $1331.70 with an inside day. An inside day happens when the entire today's range falls within yesterday's price range. An inside day usually precedes a strong move. A close above or below February 26 price range should clarify price direction.

Gold miners fared slightly worse then gold itself and are in danger of rolling over to the downside. A close below 20 day exponential moving average (eMA) may trigger a sell-off.

Treasuries gained strongly again, albeit on low volume. A TLT close above 109.34 could target a move to around $114.

Real Estate (IYR) has been range-bound for the past 7 trading day. It seems to be gearing up for its next move. Bulk of evidence is pointing to higher prices ahead.

Big move today in emerging markets! EEM gapped-up in the morning and gained almost 2 percent by session's end. A close above $39.87 would likely trigger a rally of about 7%.

Oil remained strong. A close above $103.45 would target a move up to $105 and possibly higher.

Natural gas collapsed this week by over 30%. A rebound is very likely, but all the signs, especially the volume patterns, point to a continued downside.

We are long: GDX, IYR, DEM, DVY, ETV, TLT

Feel free to emails questions and visit our blog at http://www.masterchartstrading.com/blog.html

Picture
0 Comments

World Turmoil Weighs on Markets

2/27/2014

0 Comments


Wednesday, February 26, 2014

Indices struggled above or near their highs. Russell 2000 small cap index made an intra day high, but closed just shy of an all-time high. The Dow and S&P 500 have printed yet another inside day. Two inside days in a row means that the market is getting ready for a strong move. Which way is it going to be?

Bulk of the evidence remains bullish: Price Momentum Oscillator, Stochastic oscillator, On Balance Volume, and our VIX Weighted Market Breadth Index ($VMBI), all point to higher prices ahead. The only “negative” is the fact that the Stochastic is in the overbought territory (this can continue for a long time, though).

The other negative is the TLT. Once again it gained today and we re-opened a small position in it. Treasuries are gaining most likely as an insurance against “turmoil” in the world (Ukraine, Venezuela). They held support for the 2 last weeks and if in the next few weeks TLT manages to close above $109.34, an up-move to about $114 would not be impossible. This will likely be a drag on the stock market.

GDX gapped down at the open, but managed to close with a spinning top candlestick indicating indecision. Gold miners have been on a tear since the late December, so a pause is in order. Our stop is set at $23.50 – just below the February 10 gap up.

Gold lost almost 1% today. It’s entirely possible that this may be a start of some sort of a correction. If yes, then first support is around $1300.

With positive news in the housing sector, IYR closed slightly up. IYR is coming up on resistance in the $68 area dating back to July 2013 peak. Momentum and volume patterns still favor the bullish side.

EEM is in a serious danger of rolling over. A close above $39.87 would be ideal to confirm this rally.

We are long: GDX, IYR, DEM, DVY, ETV, TLT


Picture
0 Comments
<<Previous
    Picture
    Picture
    Subscribe to our mailing list!
    Picture
    Picture

    Archives

    February 2023
    January 2023
    December 2022
    November 2022
    October 2022
    September 2022
    August 2022
    July 2022
    June 2022
    May 2022
    April 2022
    March 2022
    February 2022
    January 2022
    December 2021
    November 2021
    October 2021
    September 2021
    August 2021
    July 2021
    June 2021
    May 2021
    April 2021
    March 2021
    February 2021
    January 2021
    December 2020
    November 2020
    October 2020
    September 2020
    August 2020
    July 2020
    June 2020
    May 2020
    April 2020
    March 2020
    February 2020
    January 2020
    December 2019
    November 2019
    October 2019
    September 2019
    August 2019
    July 2019
    June 2019
    May 2019
    April 2019
    March 2019
    February 2019
    January 2019
    December 2018
    November 2018
    October 2018
    September 2018
    August 2018
    July 2018
    June 2018
    May 2018
    April 2018
    March 2018
    February 2018
    January 2018
    December 2017
    November 2017
    October 2017
    September 2017
    August 2017
    July 2017
    June 2017
    May 2017
    April 2017
    March 2017
    February 2017
    January 2017
    December 2016
    November 2016
    October 2016
    September 2016
    August 2016
    July 2016
    June 2016
    May 2016
    April 2016
    March 2016
    February 2016
    January 2016
    December 2015
    November 2015
    October 2015
    September 2015
    August 2015
    July 2015
    June 2015
    May 2015
    April 2015
    March 2015
    February 2015
    January 2015
    December 2014
    November 2014
    October 2014
    September 2014
    August 2014
    June 2014
    May 2014
    April 2014
    March 2014
    February 2014
    January 2014

    RSS Feed

  All information on MasterChartsTrading.com is for educational and entertainment purposes only, and should not be construed as a recommendation to buy, sell or sell-short said securities. Read full disclaimer.