Master Charts Trading - Stock Market Indicators & Trade Alerts
Connect To Us!
  • MasterChartsTrading
  • Blog
  • Sign-Up
  • Members
    • Elite Trading Blog
    • Stock Speculator Blog
    • Training Library >
      • Basics of Trading
      • Risk & Trading Psych
      • Trend Identification
  • Help
    • Hall of Fame
    • Social
    • About Us
    • Contact
    • FAQs
    • Disclaimer
    • Refund Policy
    • Privacy Policy
    • What We Trade
    • Newsletter samples

New Highs in Dow Possible

4/30/2014

0 Comments


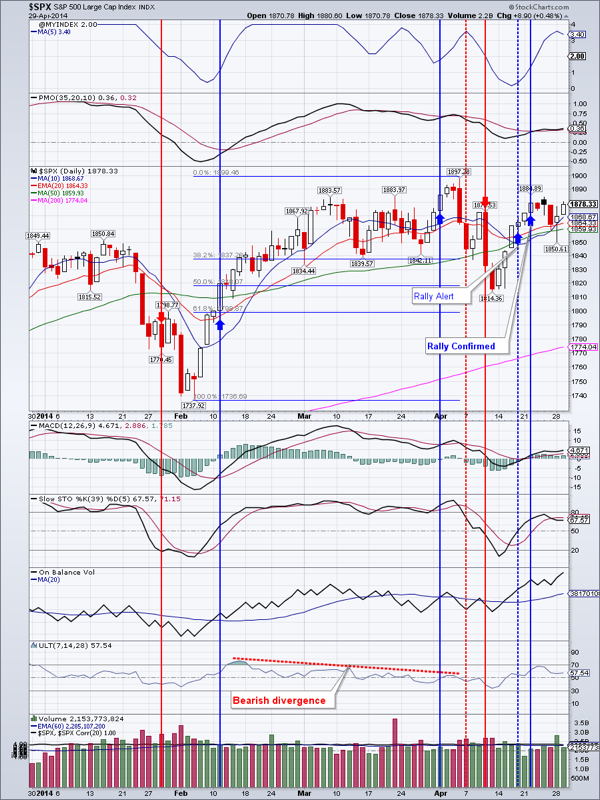
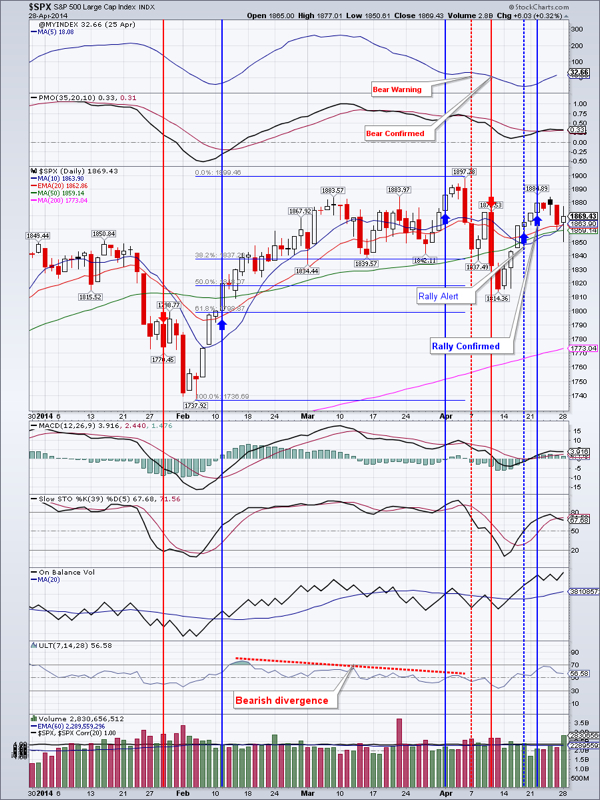
Tuesday, April 29, 2014

New Highs in Dow Possible

  As we are nearing the end of an upswing that began April 11 it is becoming clear that a rotation is taking shape from small caps into the large caps. The Dow is poised to take out the highs from April 4th, while the Russell 2000 could easily breakdown and retest February 5 lows.

  SPY - Sideways consolidation is likely for the next few days. After that this is the place to look for new highs

  DIA - looks even better then SPY. New highs likely

  IWM - Inside day (entire yesterday’s range within today’s range). It is somewhat oversold so unless we fall thru the 200 day moving average, we could see a bounce soon.

  QQQ- is similar to IWM, but much stronger. My best guess is 1-3 more down to sideways days, followed by a bounce higher. Important resistance is at $88.21

  TLT-lots of important economic news this week and a Fed statement that is sure to reverberate here. TLT tested the 20 day exponential moving average (EMA) and held it for now.

  EEM-rebounded for a second day in a row and gapped up at the open. Still thinking that we will see lower prices first before the higher once

  Gold-formed a doji spinning top candlestick on the daily chart, indicating indecision. Its just that-indecisive

  GDX rose 1.33%. Will the gains hold? Decent support is at $23.04

  IYR is pushing higher

  Oil tried to rally, but was met with selling. A close below 100.33 would be bearish and open the door to prices around $98

  Natural gas may have broken to the upside from the bullish flag consolidation pattern. Initial target is $5

  Open positions: TLT, IYR, NUGT, EEM, DIA, UGAZ

  Closed positions: QQQ, IWM

Picture
0 Comments

The Moment of Truth for Small Caps

4/29/2014

0 Comments


Monday, April 28, 2014

The Moment of Truth for Small Caps.

  Indices were mixed today with large caps and blue chips gaining while the small caps underperformed again. IWM today touched the 200 day moving average (DMA), but pulled back with what appears to be a hammer candlestick.            Failure here would be rather bearish for the small caps.

  Market breadth deteriorated slightly more, especially for the NASDAQ, but it may be approaching oversold levels and a breadth thrust should commence soon.

  SPX reaffirmed support in the 1850 area. Initial resistance is at 1897

  NASDAQ may be finding support in the 4000-4070 area. It may retest the upward sloping 200 DMA currently at 3967 before rebounding to first resistance at 4177.

  The DOW looks strong and new highs are very much possible

  TLT confirmed a shooting star from Friday and may head lower. It is already at first support. Next support is at $109.98

  EEM may have made the bottom for now, but still looks rather weak.

  Gold had an inside day. A breakout in either direction should clarify which way it would go.

  GDX lost almost 2 percent, but held support for now. Next resistance is at $24.48. I am mildly bullish on gold and GDX

  IYR keeps pushing higher

  Oil probably stopped correcting. Next support is at $98.86, while strong resistance is at $104.99

  Natural gas had a good day and gained over 2%. It almost broke above the bull flag it is tracing out. A close above $4.80 would open the door to at least $5

  Open positions: IYR, TLT, EEM, NUGT, QQQ, TNA, DIA, UGAZ

  Bottom line: General markets are bullish, but further weakness may cause a sell-off in small caps

Picture
0 Comments
<<Previous
    Picture
    Picture
    Subscribe to our mailing list!
    Picture
    Picture

    Archives

    February 2023
    January 2023
    December 2022
    November 2022
    October 2022
    September 2022
    August 2022
    July 2022
    June 2022
    May 2022
    April 2022
    March 2022
    February 2022
    January 2022
    December 2021
    November 2021
    October 2021
    September 2021
    August 2021
    July 2021
    June 2021
    May 2021
    April 2021
    March 2021
    February 2021
    January 2021
    December 2020
    November 2020
    October 2020
    September 2020
    August 2020
    July 2020
    June 2020
    May 2020
    April 2020
    March 2020
    February 2020
    January 2020
    December 2019
    November 2019
    October 2019
    September 2019
    August 2019
    July 2019
    June 2019
    May 2019
    April 2019
    March 2019
    February 2019
    January 2019
    December 2018
    November 2018
    October 2018
    September 2018
    August 2018
    July 2018
    June 2018
    May 2018
    April 2018
    March 2018
    February 2018
    January 2018
    December 2017
    November 2017
    October 2017
    September 2017
    August 2017
    July 2017
    June 2017
    May 2017
    April 2017
    March 2017
    February 2017
    January 2017
    December 2016
    November 2016
    October 2016
    September 2016
    August 2016
    July 2016
    June 2016
    May 2016
    April 2016
    March 2016
    February 2016
    January 2016
    December 2015
    November 2015
    October 2015
    September 2015
    August 2015
    July 2015
    June 2015
    May 2015
    April 2015
    March 2015
    February 2015
    January 2015
    December 2014
    November 2014
    October 2014
    September 2014
    August 2014
    June 2014
    May 2014
    April 2014
    March 2014
    February 2014
    January 2014

    RSS Feed

  All information on MasterChartsTrading.com is for educational and entertainment purposes only, and should not be construed as a recommendation to buy, sell or sell-short said securities. Read full disclaimer.