Master Charts Trading - Stock Market Indicators & Trade Alerts
Connect To Us!
  • MasterChartsTrading
  • Blog
  • Sign-Up
  • Members
    • Elite Trading Blog
    • Stock Speculator Blog
    • Training Library >
      • Basics of Trading
      • Risk & Trading Psych
      • Trend Identification
  • Help
    • Hall of Fame
    • Social
    • About Us
    • Contact
    • FAQs
    • Disclaimer
    • Refund Policy
    • Privacy Policy
    • What We Trade
    • Newsletter samples

Stock Market Recap For Friday, September 22nd, 2017 - SPY QQQ IWM XLU XLP XLI TAN FSLR USO UNG GLD GDX UUP XLF XLY IYT

9/24/2017

0 Comments

 
•Elite Membership Interest list forming! Sign-up today for a discounted membership. Estimated go live date is Monday, October 10th, 2017

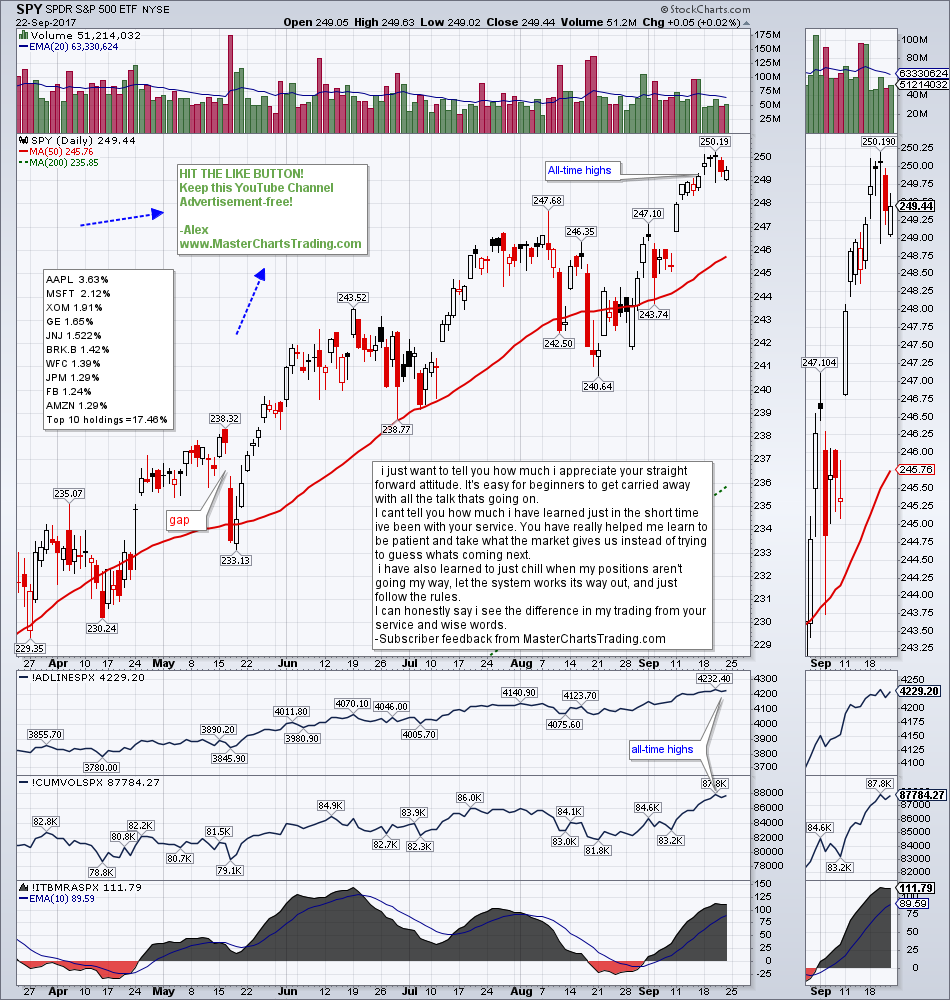
•Stocks continue higher, but sector leadership changed. Energy, Industrials and Materials lead. While Staples, and Utilities lag
New highs: IWM, XLF, XLI and junk bonds – overall this still paints a bullish picture
Solar (TAN) could be poised for a substantial upside. FSLR looks very strong

•TLT attempting to find support at the 50-day moving average

•US Dollar index is trying to bottom around 2016 lows as Euro takes a breather

•Gold pulls back to the breakout level. GDX is oversold and could bounce

•Oil moves higher. A breakout above $53 would call for more upside

•Choppy action in natural gas continues.

•Copper pulls back from the 52-week highs for a trade setup 

Charts mentioned in this video are located here: stockcharts.com/public/1229503
Picture
0 Comments

Stock Market Recap For Friday, September 16th, 2017 - SPY QQQ IWM DIA XLU XLP XLI SMH XRT TAN FSLR USO UNG GLD GDX UUP

9/17/2017

0 Comments

 
•Elite Membership Interest list forming! Sign-up today for a discounted membership. Estimated go live date is Monday, October 10th, 2017

•Please make a donation to help those affected by hurricane Irma!
www.RedCross.org is a good place for this.

•Stocks (SPY) close at all-time record highs – Advance-Decline Lines confirm this fresh breakout | QQQ and Dow Jones also move to fresh highs, while IWM is playing catch-up,

XLF bounces, as TLT falls | XLI, SMH, XLU – at records, while XLP has a bullish divergence. | Flat consolidation in TAN resolves to the upside – using the Elite indicator to finds entry points on TAN and FSLR. | XRT may have bottomed

•Junk bonds again at fresh highs confirm the bullish stock market posture. | TLT pulls back from 2017 highs, but trend is likely up

•Dollar index (DXY) attempting to bottom. | Weak Yen is helping, while British Pound and Euro are hurting DXY

•Gold pulls back. A retest of recent breakout above $1300 may be in the cards. | GDX bounces off resistance in the $25.50 area.

•Oil still indecisive

•Natural gas may be resolving to the upside finally 

Charts mentioned in this video are located here: stockcharts.com/public/1229503

If you become a member of my Basic trading service you can get an Elite indicator for free until October 9th!


0 Comments
<<Previous
    Picture
    Picture

    Subscribe to our mailing list!

    * indicates required
    /* real people should not fill this in and expect good things - do not remove this or risk form bot signups */

    Intuit Mailchimp

    Click to set custom HTML
    Picture
    Picture

    Archives

    January 2025
    December 2024
    November 2024
    October 2024
    September 2024
    August 2024
    July 2024
    June 2024
    May 2024
    April 2024
    March 2024
    February 2024
    January 2024
    December 2023
    November 2023
    October 2023
    September 2023
    August 2023
    July 2023
    June 2023
    May 2023
    April 2023
    March 2023
    February 2023
    January 2023
    December 2022
    November 2022
    October 2022
    September 2022
    August 2022
    July 2022
    June 2022
    May 2022
    April 2022
    March 2022
    February 2022
    January 2022
    December 2021
    November 2021
    October 2021
    September 2021
    August 2021
    July 2021
    June 2021
    May 2021
    April 2021
    March 2021
    February 2021
    January 2021
    December 2020
    November 2020
    October 2020
    September 2020
    August 2020
    July 2020
    June 2020
    May 2020
    April 2020
    March 2020
    February 2020
    January 2020
    December 2019
    November 2019
    October 2019
    September 2019
    August 2019
    July 2019
    June 2019
    May 2019
    April 2019
    March 2019
    February 2019
    January 2019
    December 2018
    November 2018
    October 2018
    September 2018
    August 2018
    July 2018
    June 2018
    May 2018
    April 2018
    March 2018
    February 2018
    January 2018
    December 2017
    November 2017
    October 2017
    September 2017
    August 2017
    July 2017
    June 2017
    May 2017
    April 2017
    March 2017
    February 2017
    January 2017
    December 2016
    November 2016
    October 2016
    September 2016
    August 2016
    July 2016
    June 2016
    May 2016
    April 2016
    March 2016
    February 2016
    January 2016
    December 2015
    November 2015
    October 2015
    September 2015
    August 2015
    July 2015
    June 2015
    May 2015
    April 2015
    March 2015
    February 2015
    January 2015
    December 2014
    November 2014
    October 2014
    September 2014
    August 2014
    June 2014
    May 2014
    April 2014
    March 2014
    February 2014
    January 2014

    RSS Feed

  All information on MasterChartsTrading.com is for educational and entertainment purposes only, and should not be construed as a recommendation to buy, sell or sell-short said securities. Read full disclaimer.