|
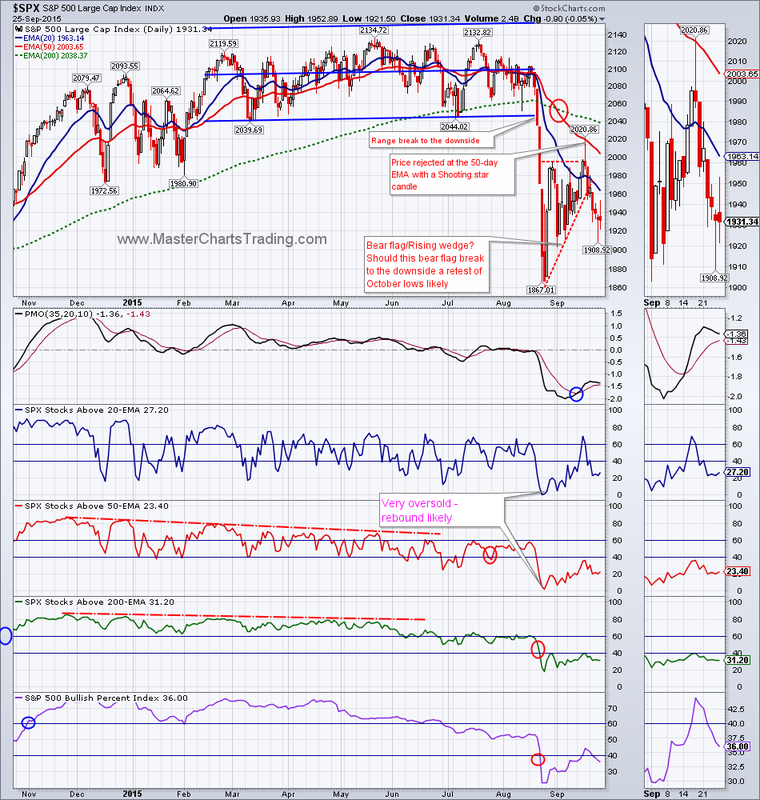
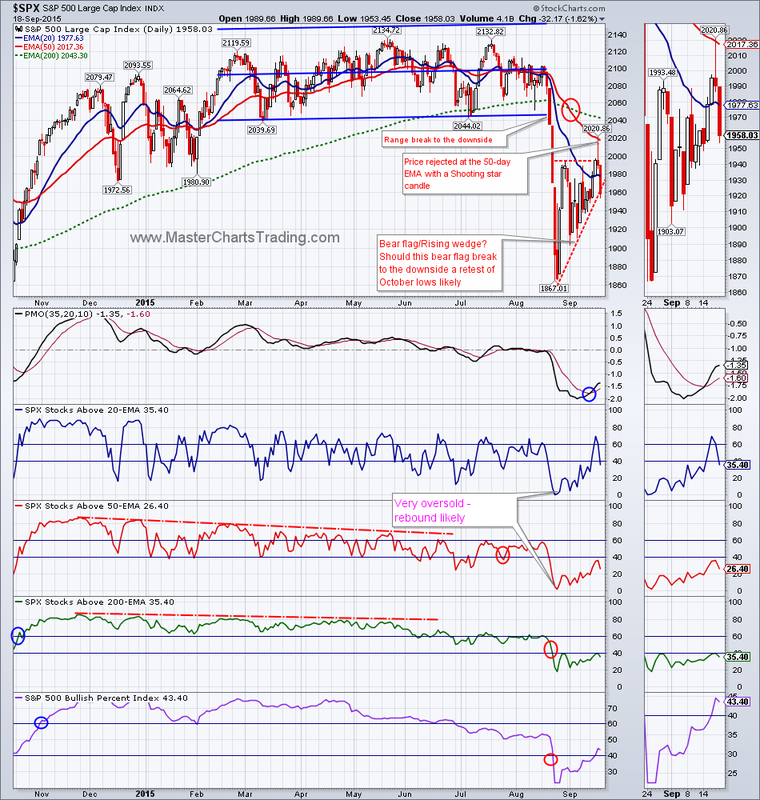
Last week I mentioned that we had a rising wedge break on the chart of $SPX. This week the above-mentioned wedge break continued to play out as $SPX dropped further. I think a re-test of August lows around 1860 is still very much in play here.
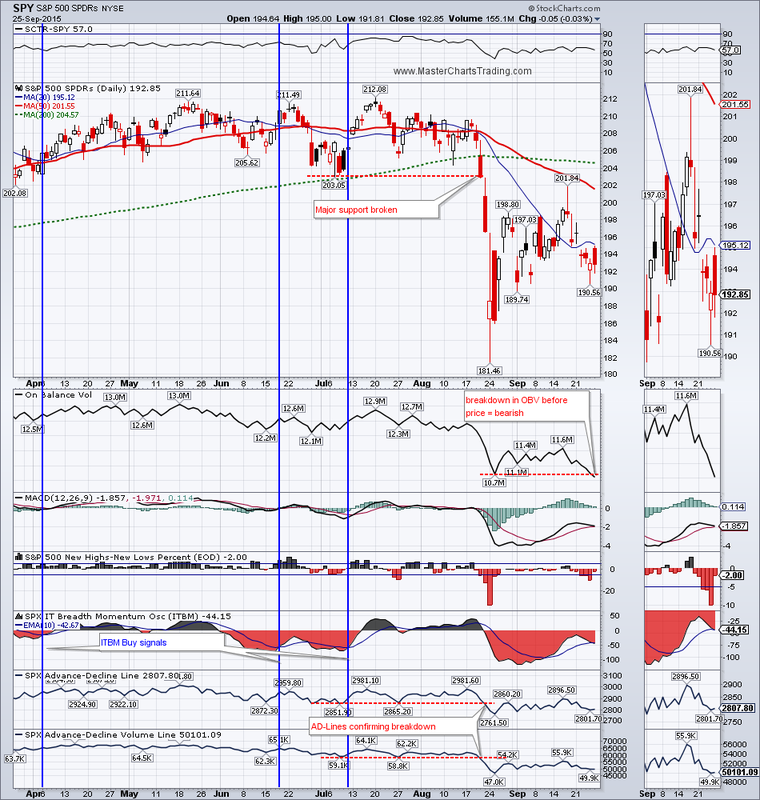
The chart of SPY (S&P 500 ETF) features further evidence of distribution that is taking place right now. The On Balance volume indicator broke below the low it set in late August on Friday, while the price itself is still over 3% above the August low. As an old Wall Street saying goes: “Volume leads price”, will this time be different? Charts of $SPX and SPY |
|
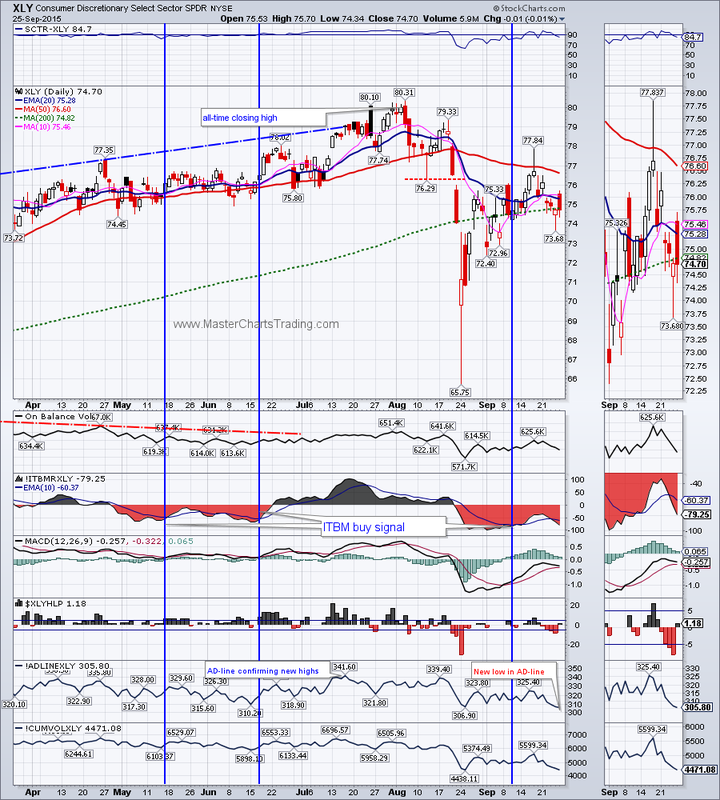
Chart of XLY
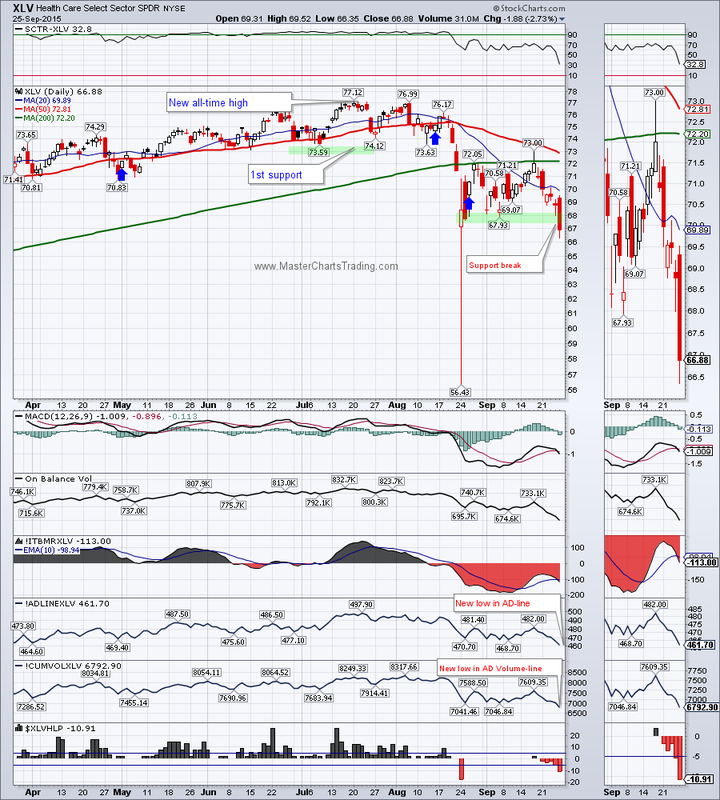
_Chart of XLV
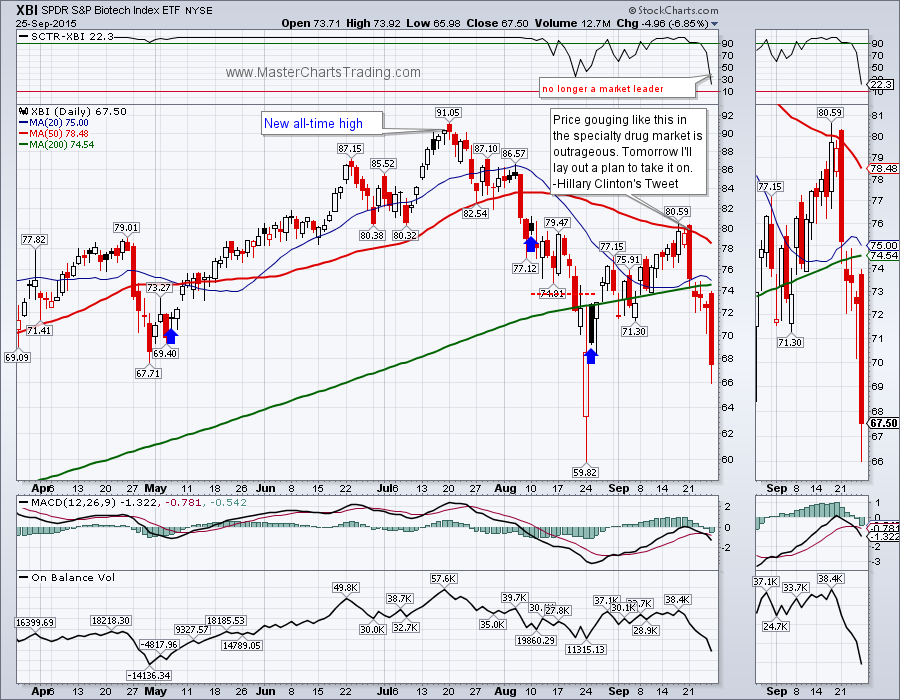
Chart of XBI
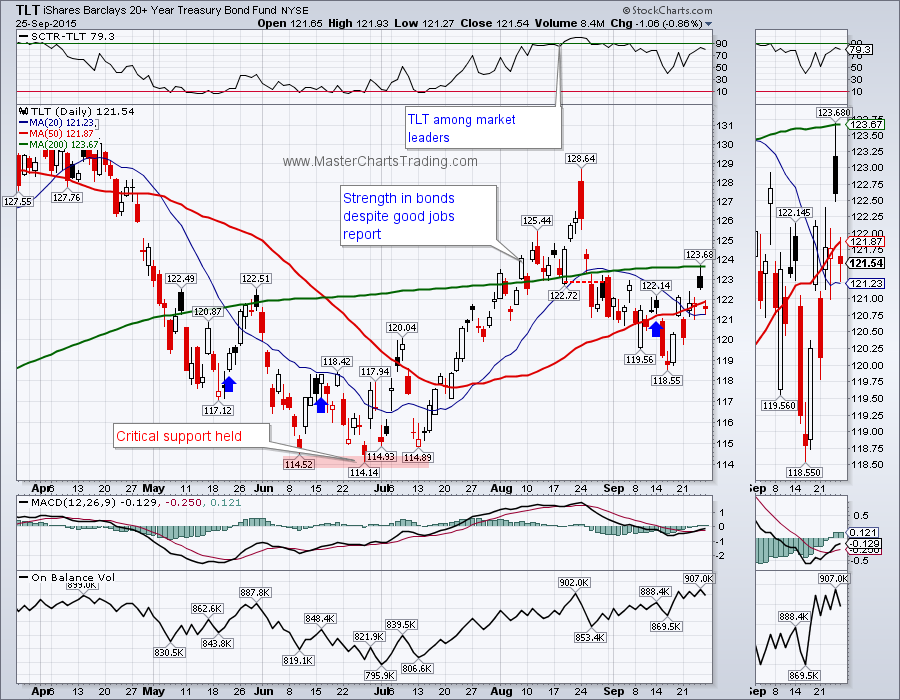
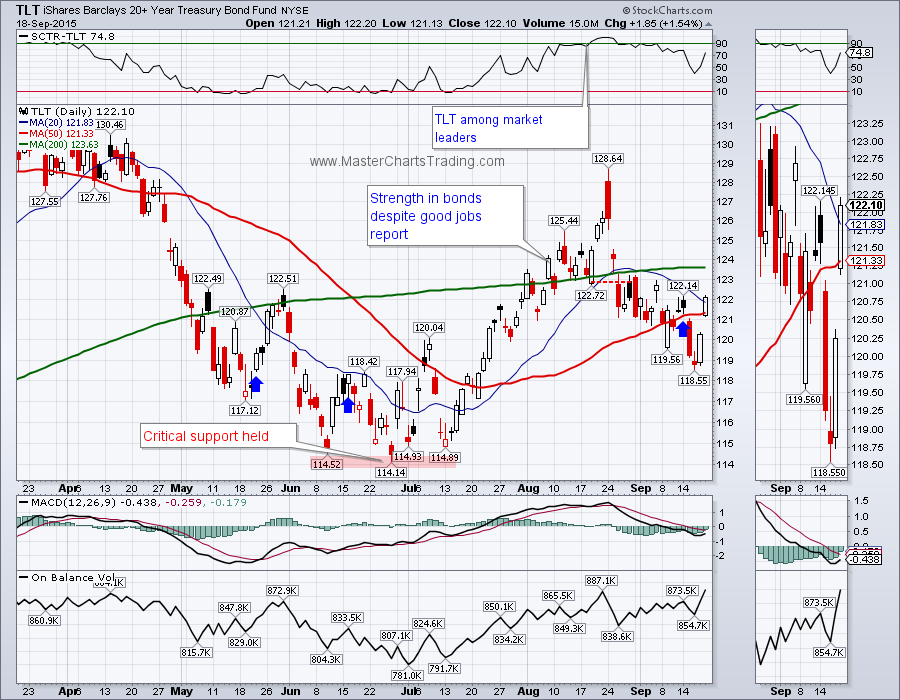
Chart of TLT
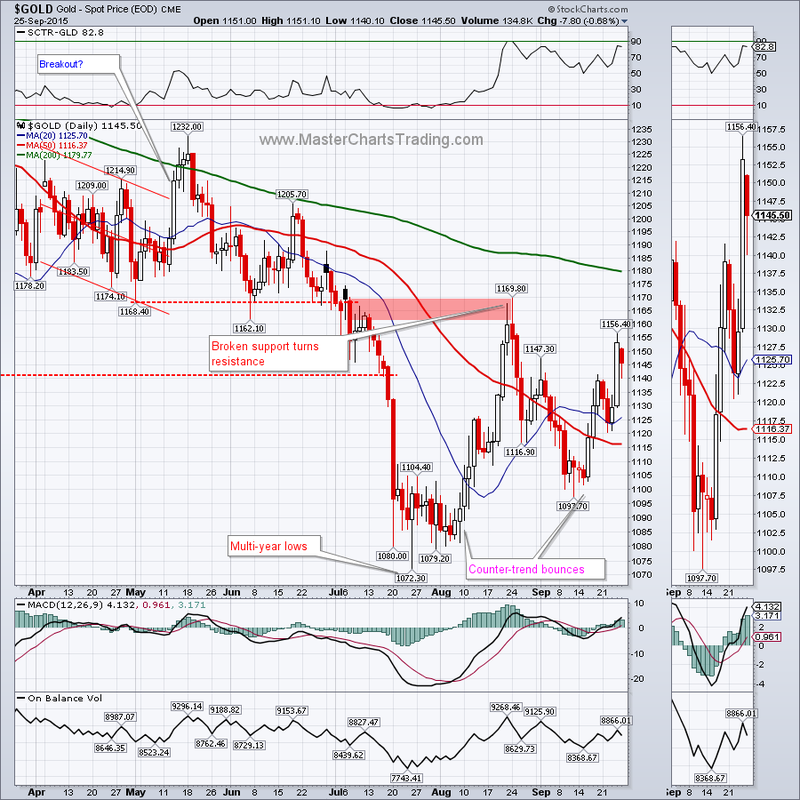
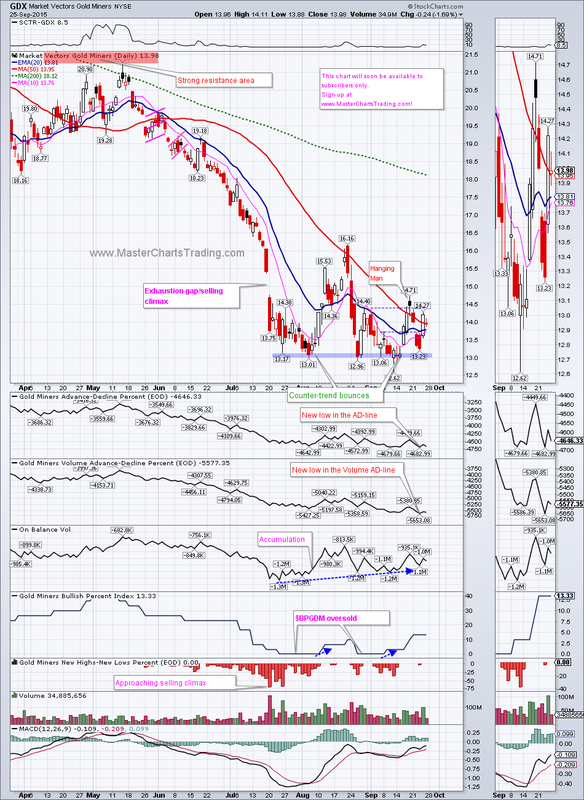
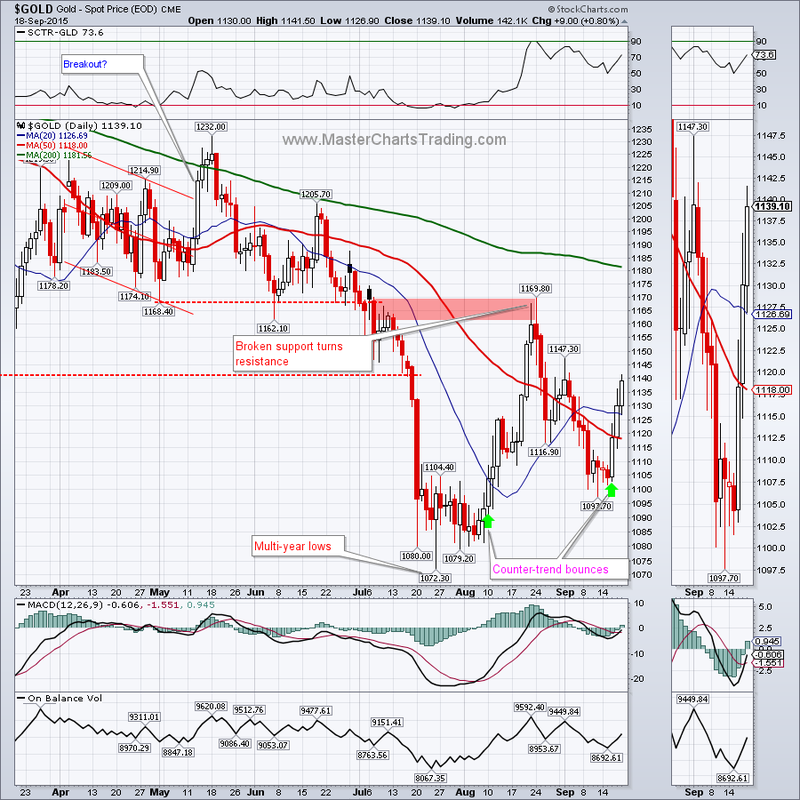
Charts of gold and precious metals
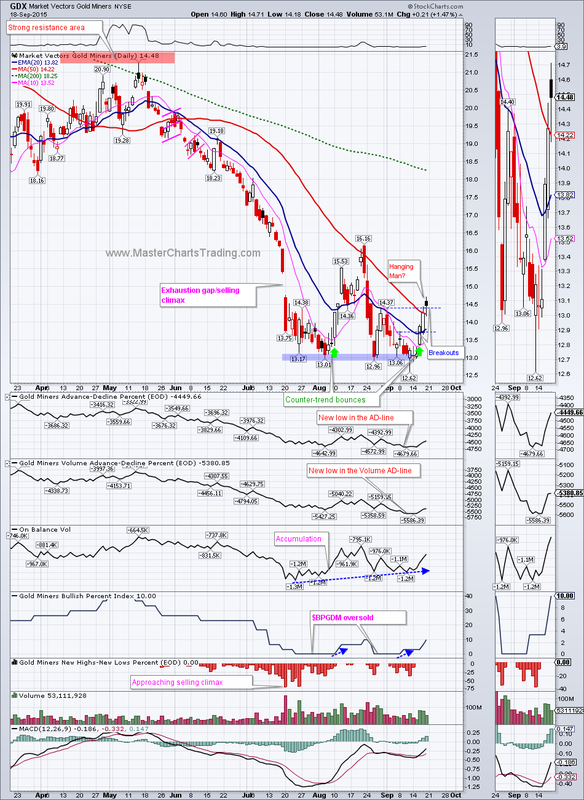
Chart of GDX
Best Regards and have another great trading week!
** Special Announcement**
We are close (hopefully October 10th) to launching a stocks alert service. Please sign-up for our mailing list to be the first to take advantage of the discounted membership once it becomes available!
Alexander Berger (www.MasterChartsTrading.com)


 RSS Feed