|
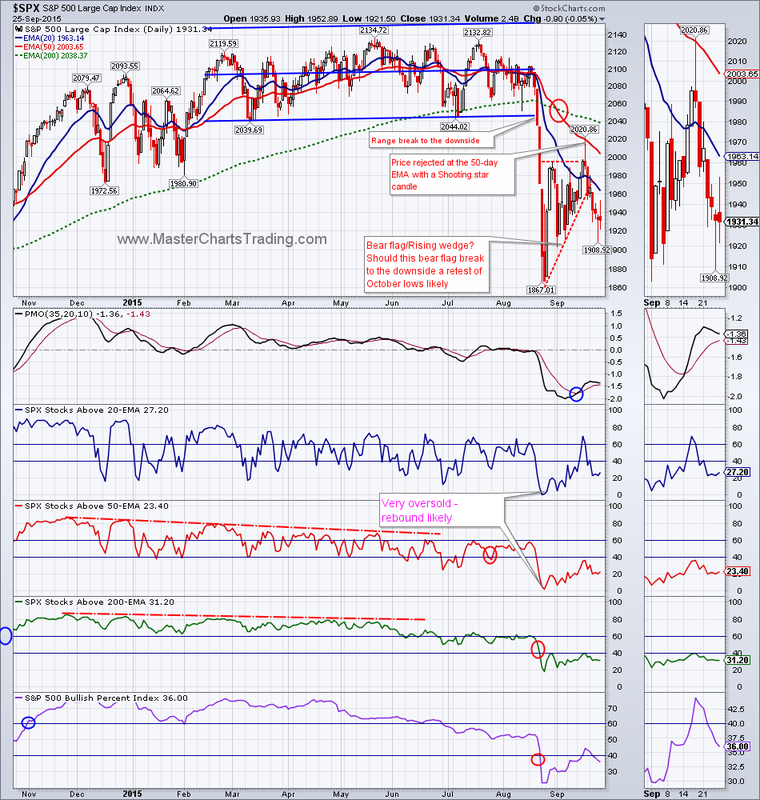
Last week I mentioned that we had a rising wedge break on the chart of $SPX. This week the above-mentioned wedge break continued to play out as $SPX dropped further. I think a re-test of August lows around 1860 is still very much in play here.
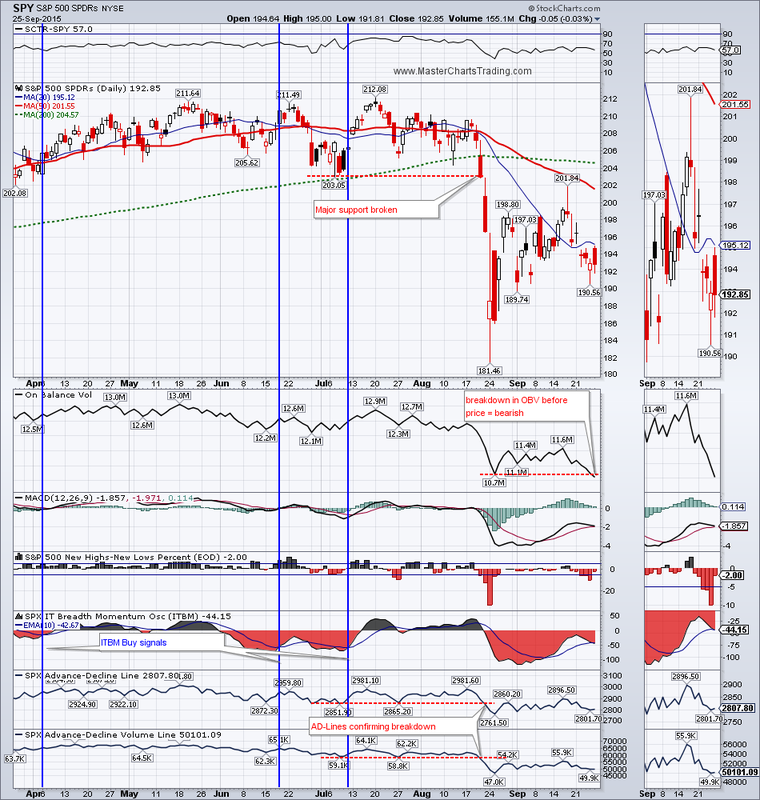
The chart of SPY (S&P 500 ETF) features further evidence of distribution that is taking place right now. The On Balance volume indicator broke below the low it set in late August on Friday, while the price itself is still over 3% above the August low. As an old Wall Street saying goes: “Volume leads price”, will this time be different? Charts of $SPX and SPY |
|
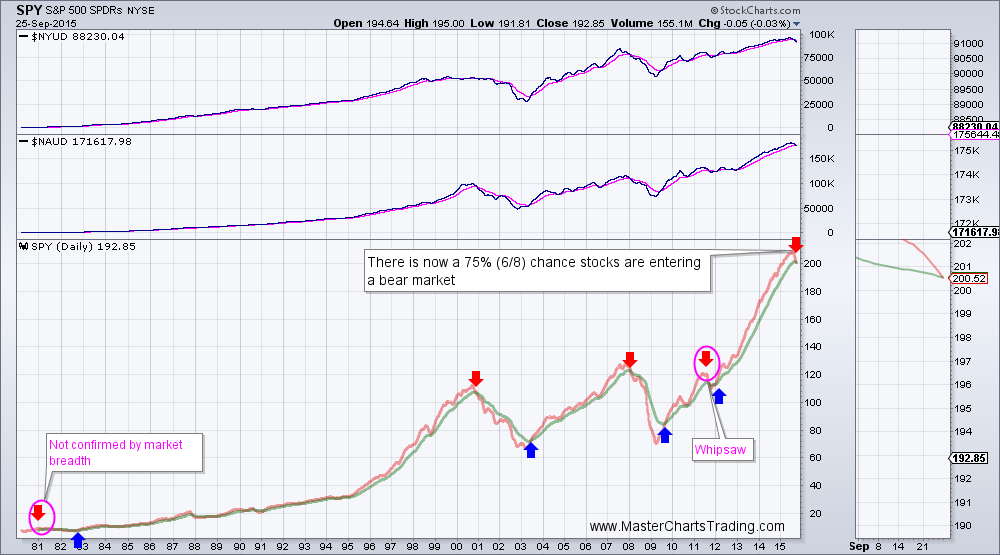
Zooming out to a very long-term chart of SPY. Going back to January 1980 we are looking at a chart that is showing long-term trading bias. Today we had a change in the bias from bullish to bearish, when the faster moving average (red) crossed below the slower moving average (green). Notice that we are using market breadth to either confirm or deny our premise of the major bias change. Two of those signals were not confirmed by market breadth, but the rest were. Therefore this setup now gives us a 6 out of 8 (75%) chances that today’s bias change from bullish to bearish would be valid.
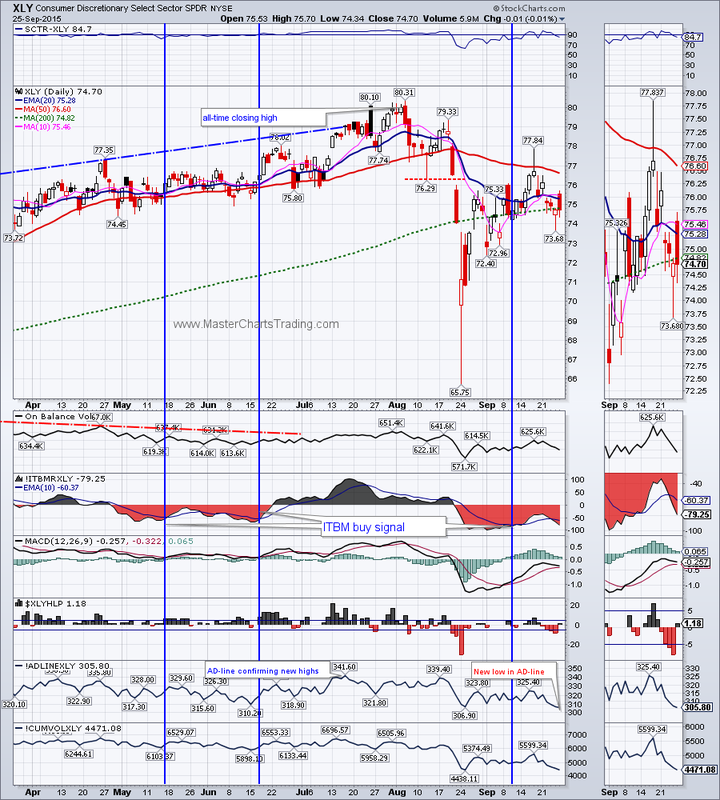
Looking further under the hood of the market. The Advance-Decline line for XLY hit a new low for the past 6 months, while the price of XLY is still well above the August lows. It is often the case for market breadth (AD-Line) to be the leading indicator of the move to come.
Chart of XLY
Chart of XLY
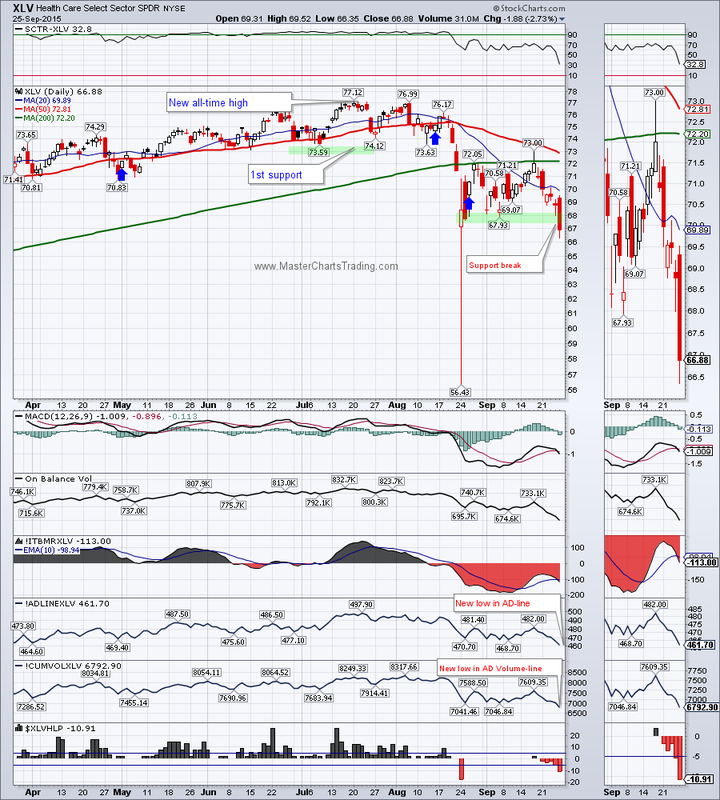
Of the nine SPDR sector ETFs, XLV was the worst performer this week, loosing -5.68%. XLV also closed below its August closing low, while its AD-Line and AD-Volume lines moved to new lows for the move thus confirming the breakdown.
_Chart of XLV
_Chart of XLV
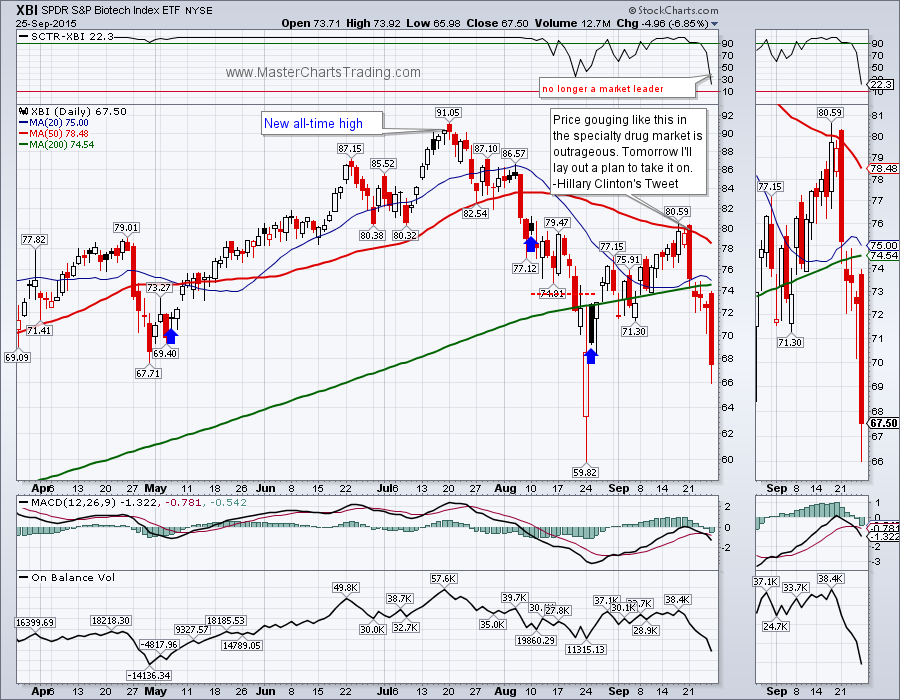
Biotech got taken out to the woodshed and given a beating. First on Monday, Hillary Clinton tweeted about price gouging by the drug companies, then Friday more selling followed. Overall XBI, a broad biotech ETF, lost over 15% for the week also closing below the closing low set in late August. Perhaps selling is overdone for now, but biotech may have lost its status as the market leader.
Chart of XBI
Chart of XBI
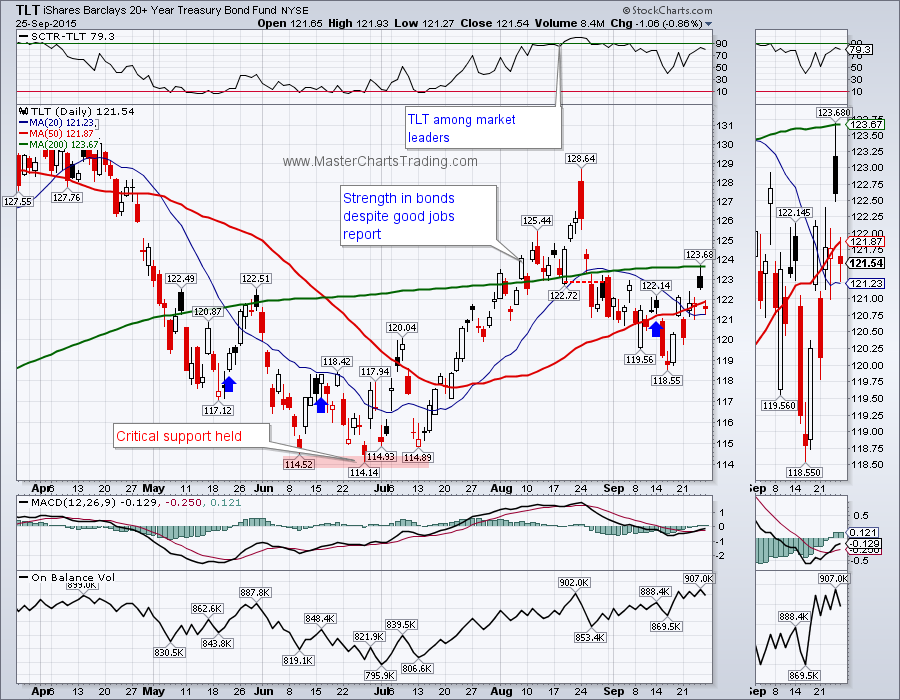
Bonds (TLT) ran into resistance below the 200-day moving average and pulled back. Usually when money is rotating out stocks it finds its way into the bond market. This is happening, but not to the extent I was expecting. Perhaps both bonds and stocks are overvalued and cash is the place to be?
Chart of TLT
Chart of TLT
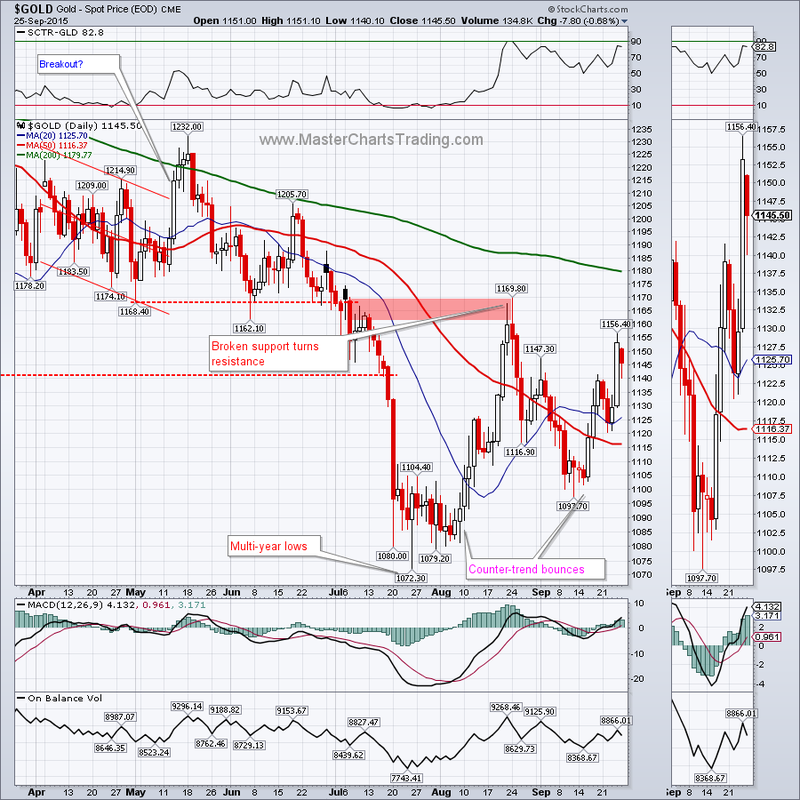
Perhaps commodities are benefiting from the money coming out of stocks. Gold gained for the 2nd consecutive week and is up over 8% from the low set in August. Gold managed to close above resistance at $1140, and managed to briefly touch the next resistance level at $1156. Long-term gold is still bearish, but this counter-trend rally may still have some room to run.
Charts of gold and precious metals
Charts of gold and precious metals
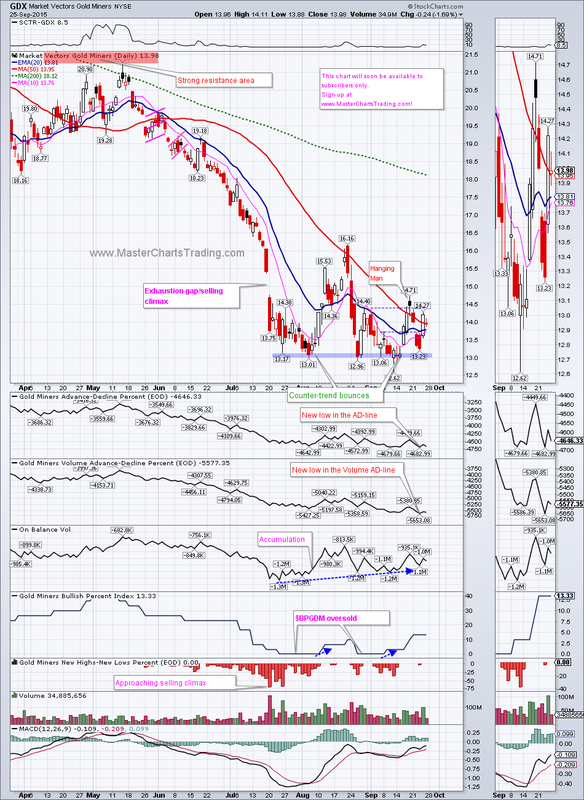
Moving on to GDX, gold’s volatile brother, we notice that it is actually down -3.45% for the week, while gold itself is up about ½ percent. Last week on Friday, I pointed out that GDX printed what looked like a “hanging man” candlestick, and if confirmed another re-test of the $13 area is likely. This indeed happened this week as GDX pulled back again to support only to rebound strongly on Thursday. While Friday’s action in GDX leaves much to be desired, it managed to close above the 50-day moving average for the second day in a row – a fit GDX wasn’t able to do since May. This is a positive sign, and as with gold, we may see higher prices in the short term.
Chart of GDX
Chart of GDX
That’s it for this week’s market recap,
Best Regards and have another great trading week!
** Special Announcement**
We are close (hopefully October 10th) to launching a stocks alert service. Please sign-up for our mailing list to be the first to take advantage of the discounted membership once it becomes available!
Alexander Berger (www.MasterChartsTrading.com)


 RSS Feed