Master Charts Trading - Stock Market Indicators & Trade Alerts
Connect To Us!
  • MasterChartsTrading
  • Blog
  • Sign-Up
  • Members
    • Elite Trading Blog
    • Stock Speculator Blog
    • Training Library >
      • Basics of Trading
      • Risk & Trading Psych
      • Trend Identification
  • Help
    • Hall of Fame
    • Social
    • About Us
    • Contact
    • FAQs
    • Disclaimer
    • Refund Policy
    • Privacy Policy
    • What We Trade
    • Newsletter samples

Market Recap For The Week Ending Friday May 29th, 2015 - SPY TLT GLD GDX USO RSX EWZ

5/29/2015

0 Comments

 
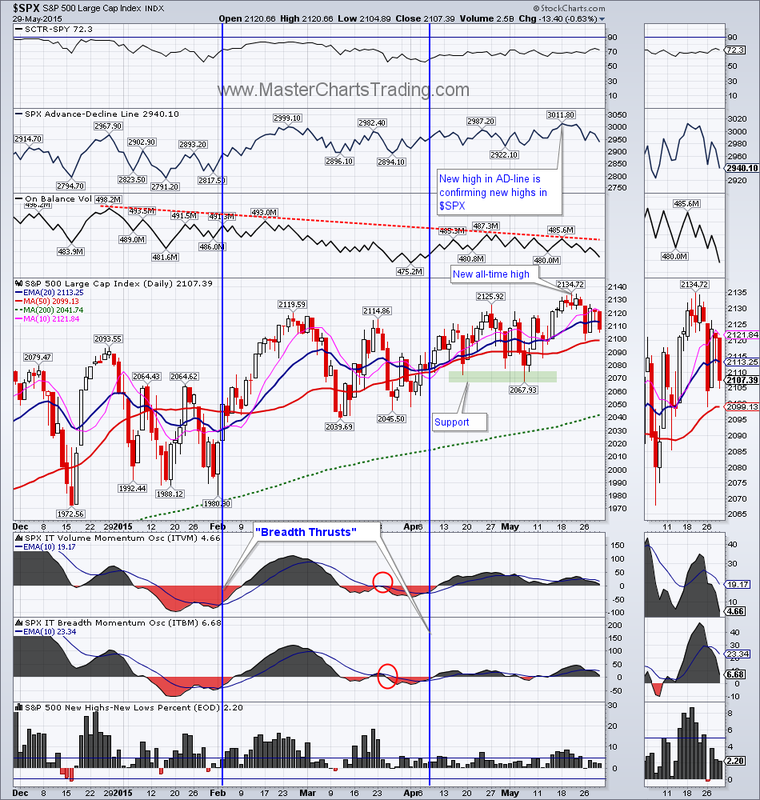
S&P 500 was down for the week as it digested the all-time highs of last week. There was some wild action at the beginning of the week as stocks plunged Tuesday only recoup most of the losses on Wednesday. 

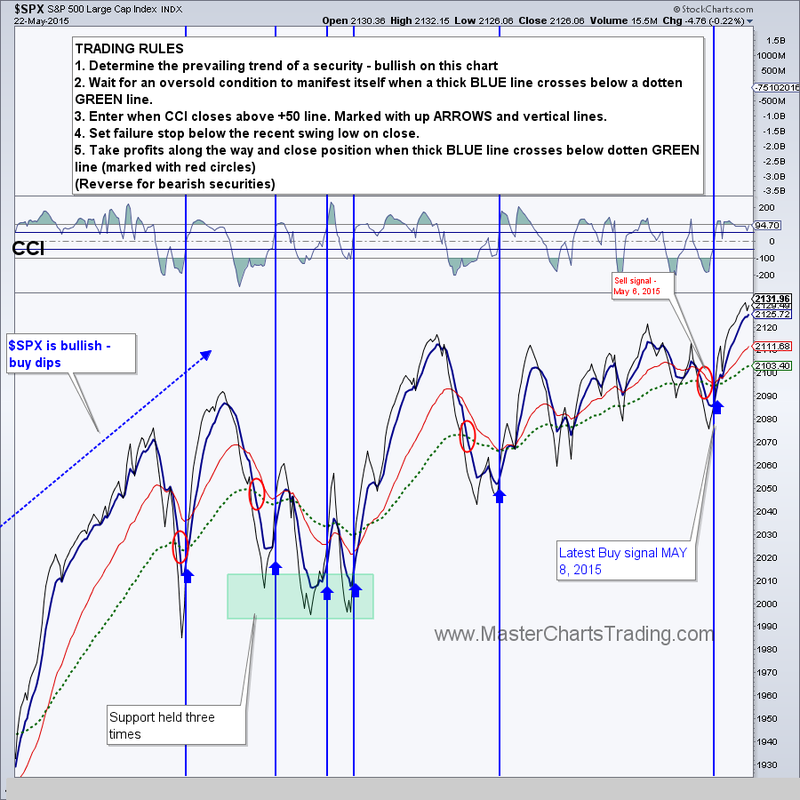
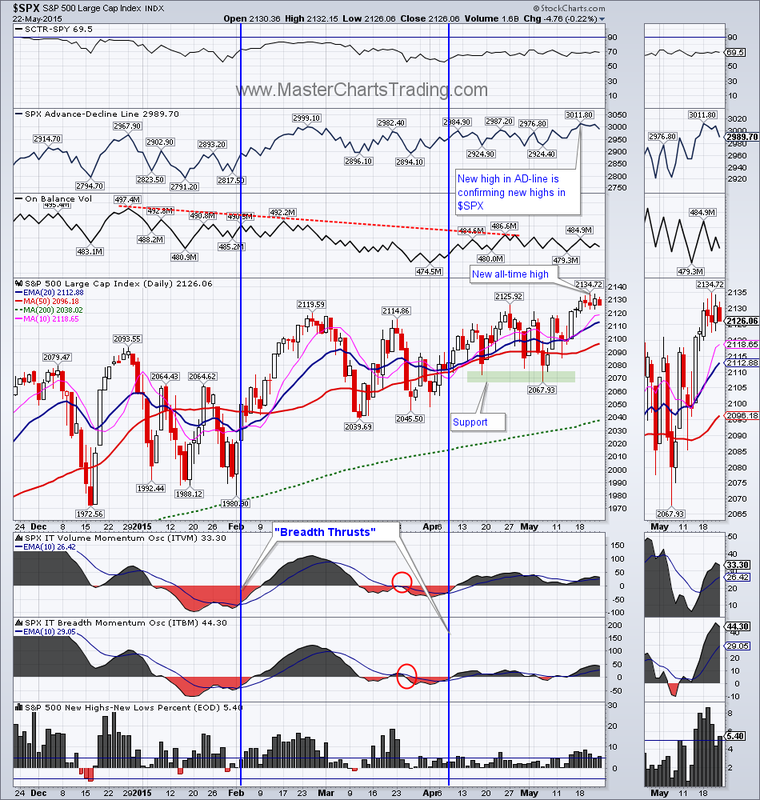
There is now an obvious divergence in the $SPX and the on-balance volume indicator – $SPX is making higher highs while the on-balance volume is pushing lower instead. It’s difficult to say where this will lead. For the time being stocks are pushing higher, $SPX is still on a breadth thrust up and the market is generally bullish.    
Chart of S&P 500
Picture
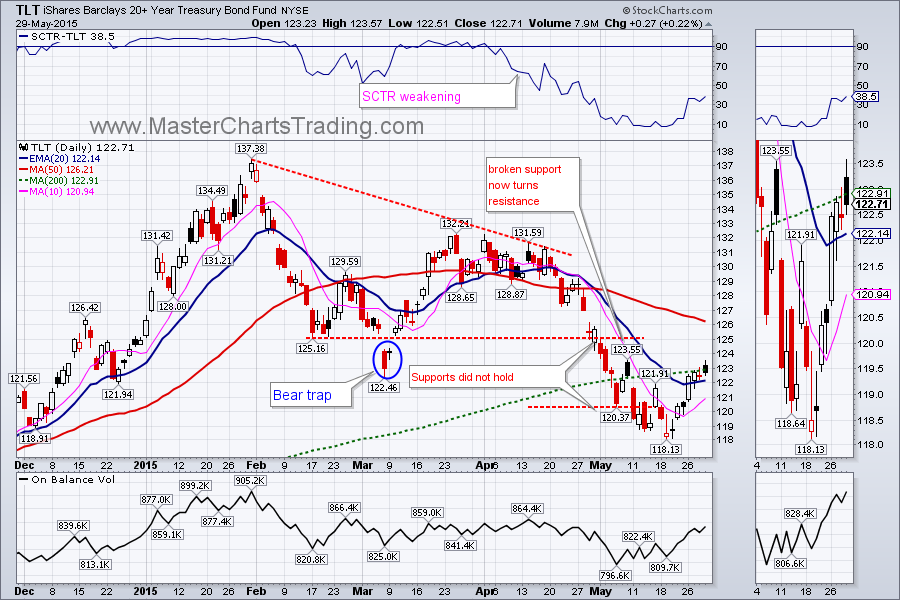
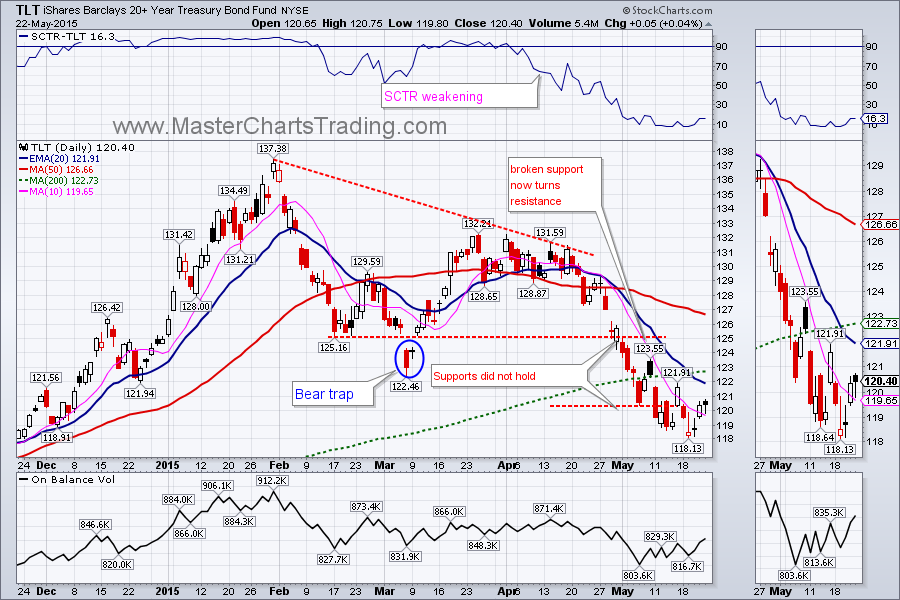
Bonds (TLT) came back from the dead and gained almost 2 percent for the week. TLT is right at the 200-day moving average, challenging it from below. As I mentioned in my last week’s market recap there is now lots and lots of overhead resistance for bonds. A close above the 200-day would help TLT overcome one the first resistance levels. 
Picture
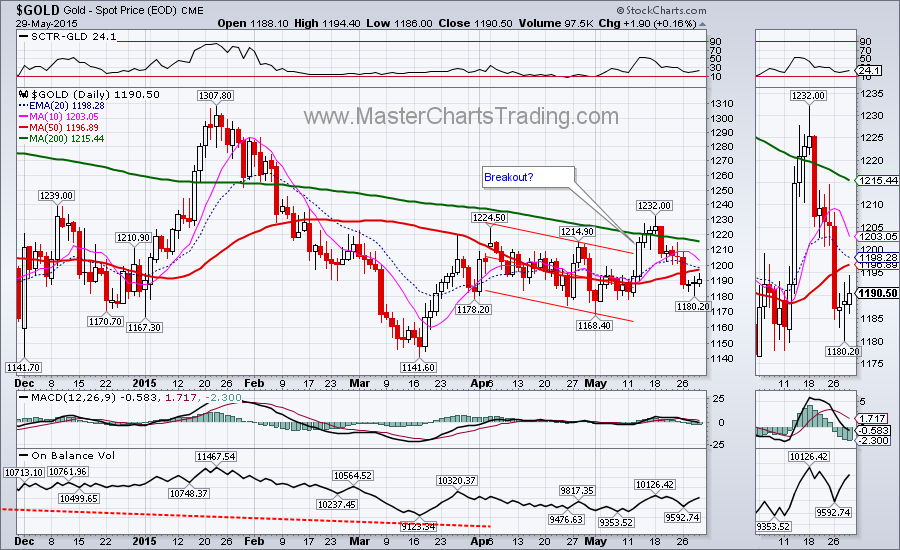
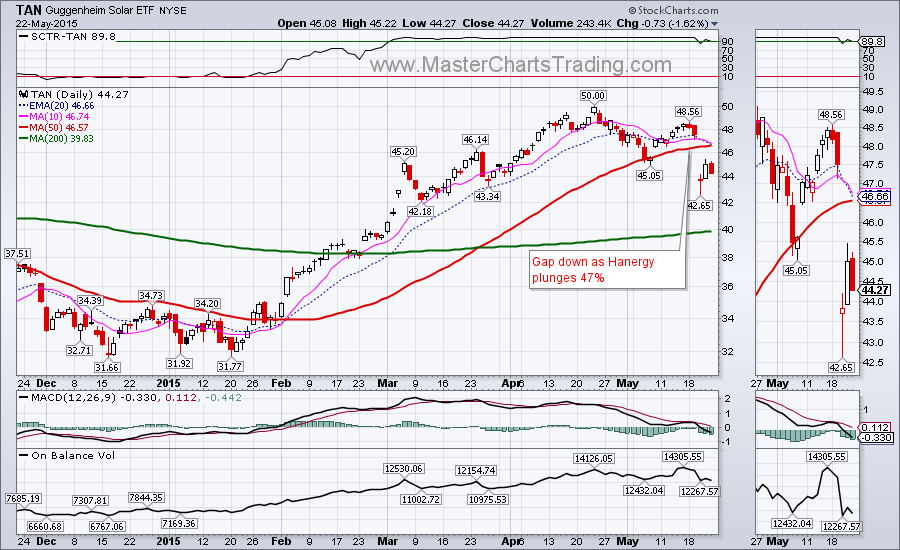
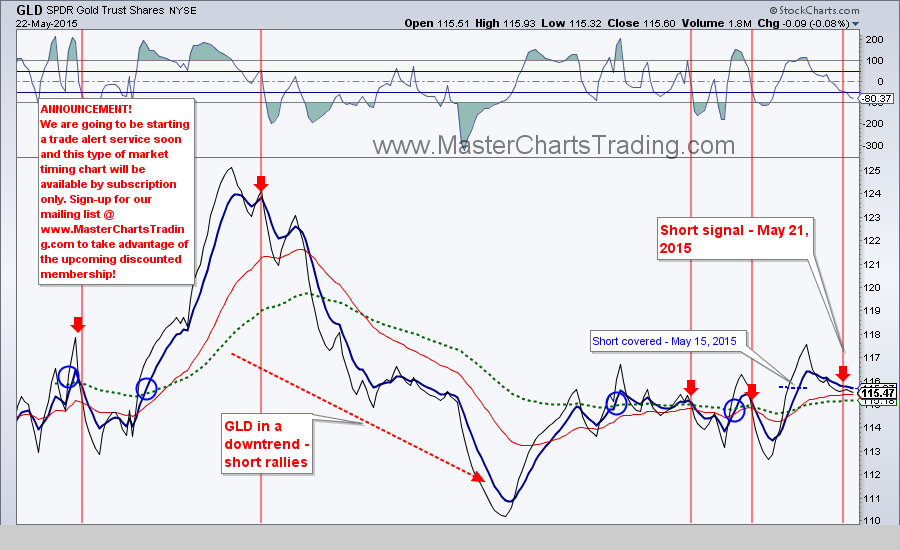
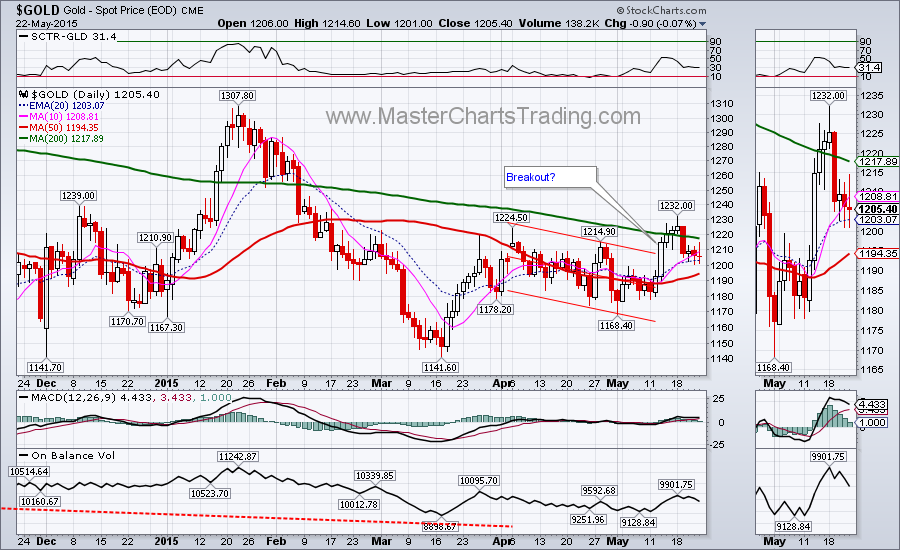
Gold lost a little over 1% for the week as it continued with a plunge from the last week. For the past 2 weeks gold is down as much as 4%. With dollar hitting new highs, gold may be poised for further weakness and a retest of at least May 1st low ($1168) is very much in the cards. 

Picture
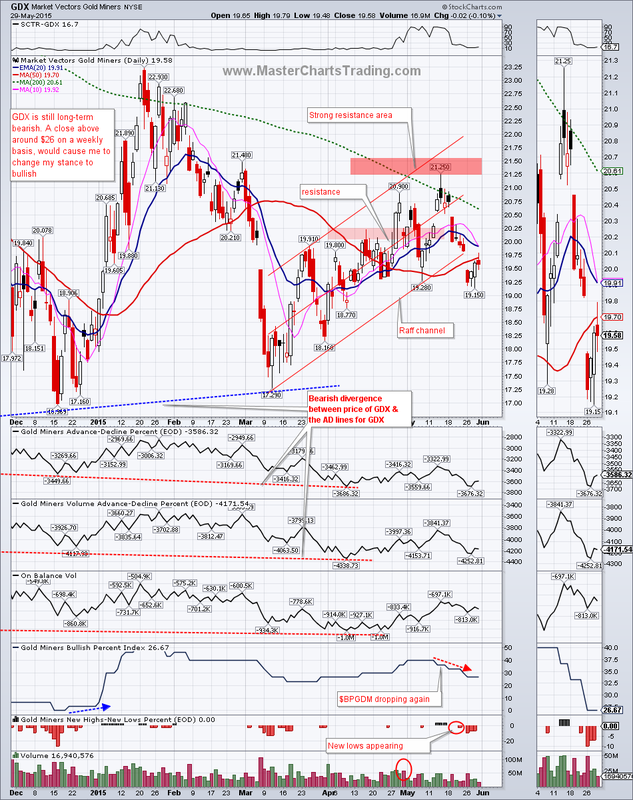
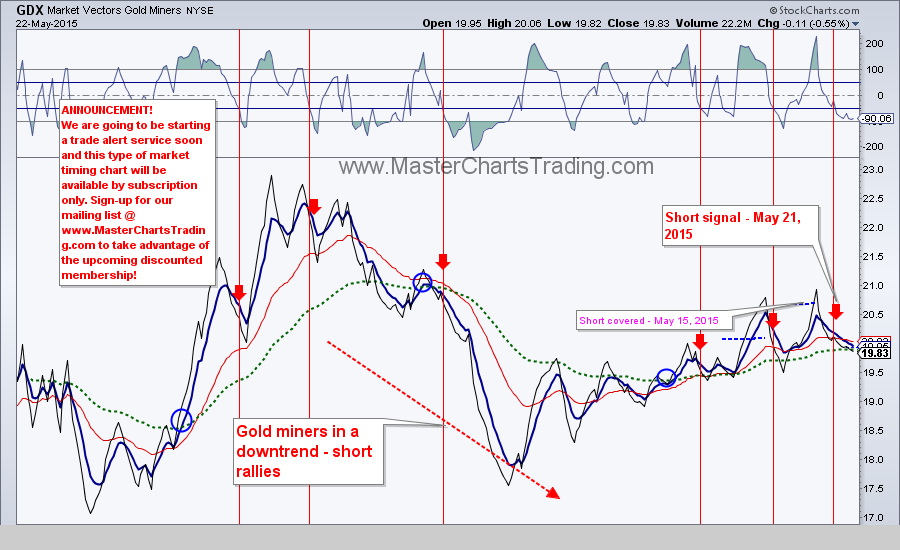
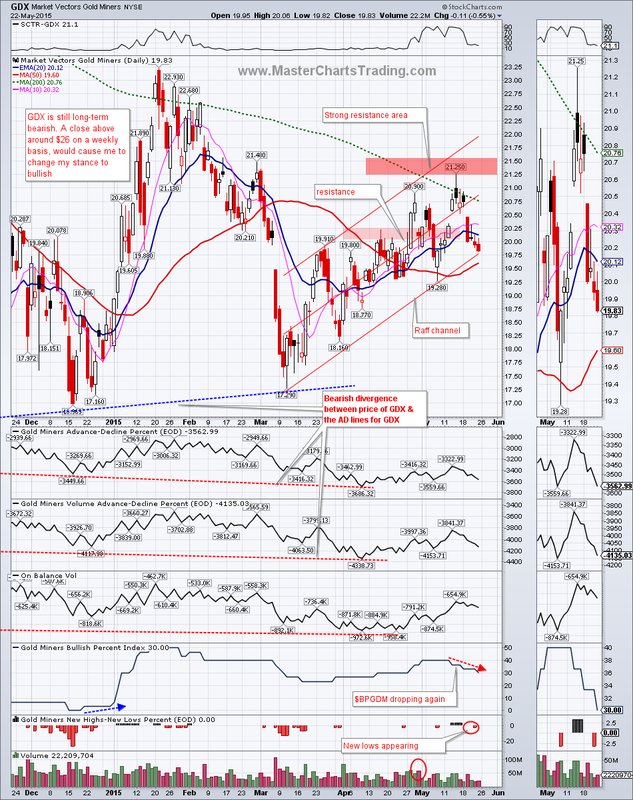
Gold miners (GDX) followed gold lower with a loss of over 8% for the past 2 weeks. On Tuesday GDX closed below early May low at $19.25, but since rebounded. There is now resistance for GDX at the 50-day moving average currently at $19.70. Again, should gold continue its slide, GDX is surely to follow and a retest of March and possibly December lows may occur. 
Chart of GDX
Picture
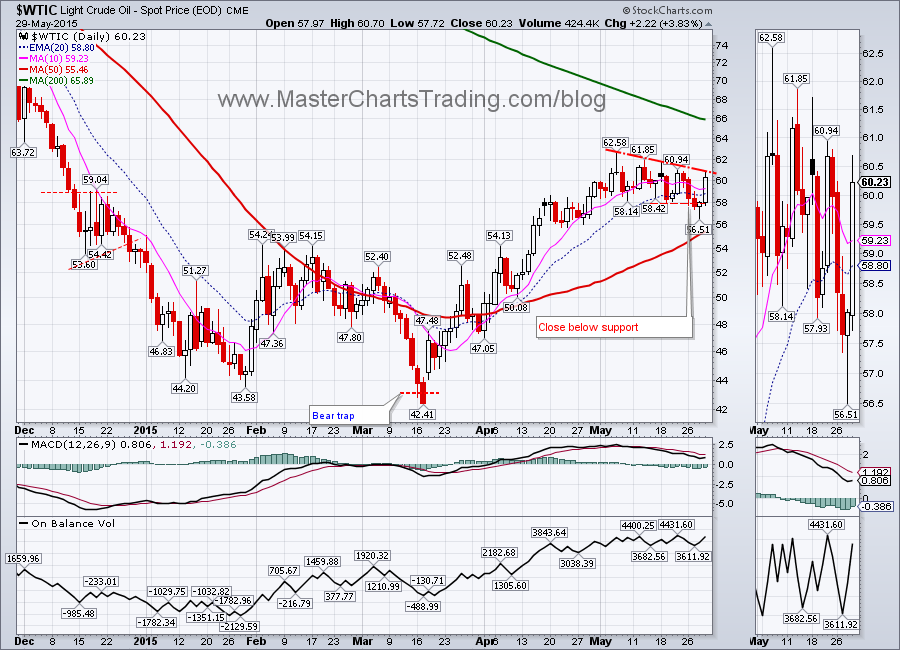
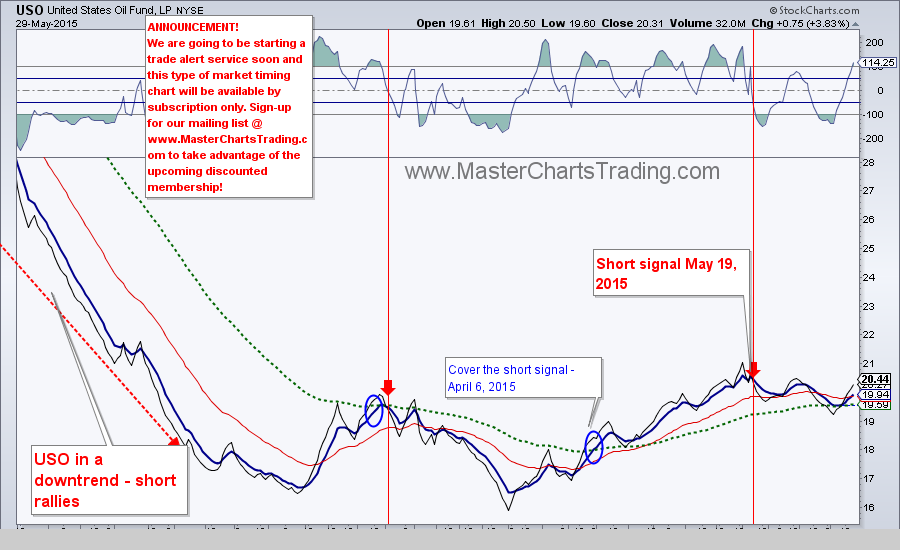
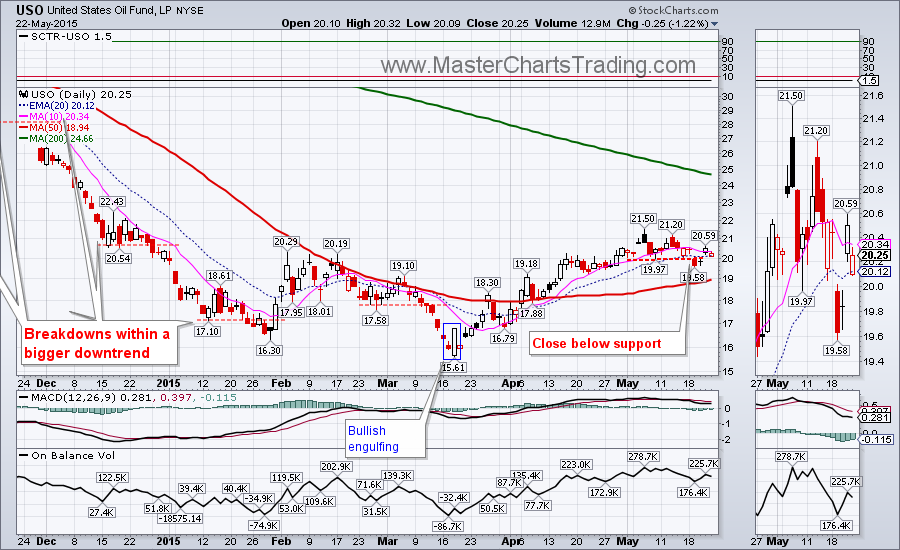
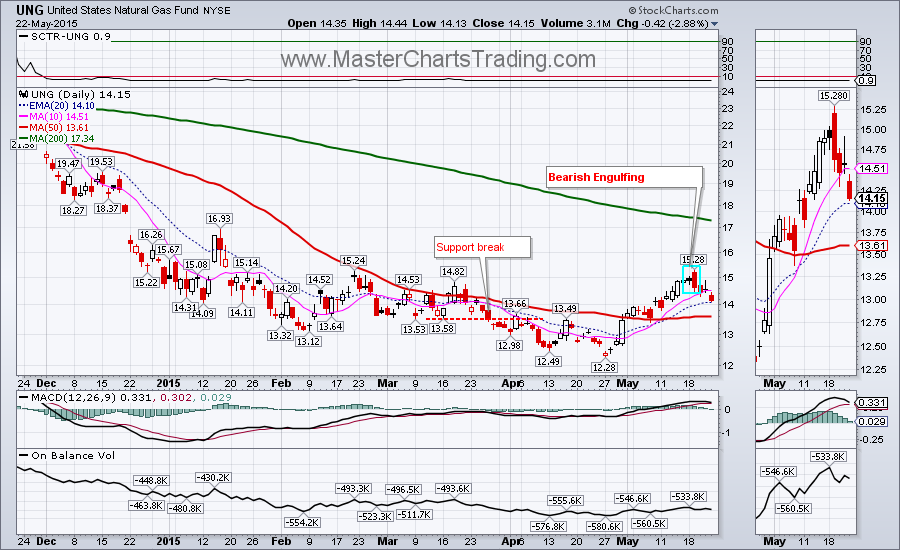
       Oil started the week miserably, but had a strong finish. We have an open position in SCO (inverse crude oil) ETF still open with a stop-loss if oil closes above $62.  Charts of oil and other commodities

Picture
Picture
With oil possibly resuming its slide, I thought I would cover a couple of countries’ ETFs that are heavily dependent upon oil exports: Russia and Brazil.

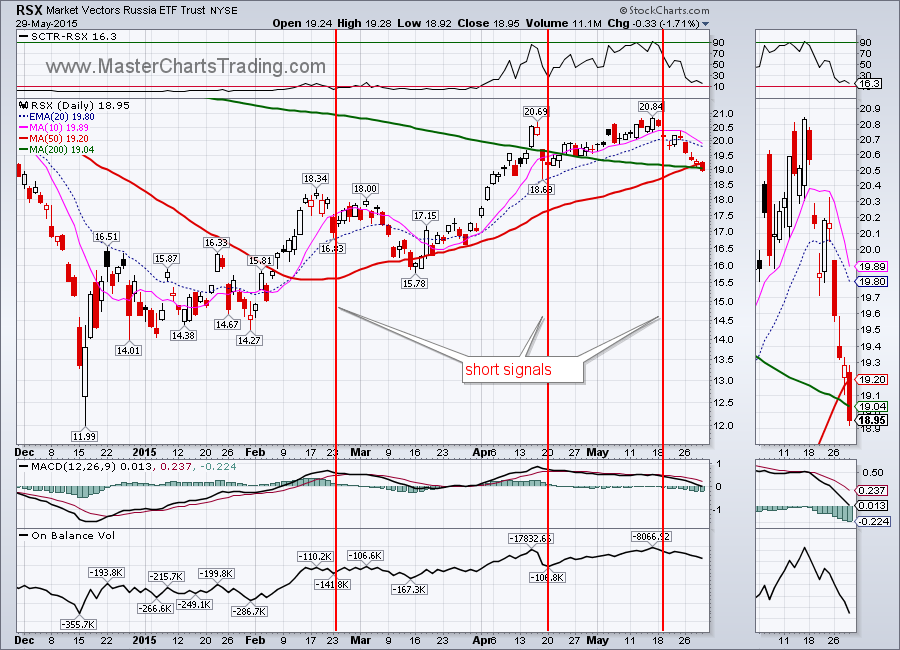
         RSX – the Russia ETF is in a long-term downtrend that started at least a year ago. I am therefore ignoring all bullish setups and only looking for bearish once. RSX put in a low last December and then had a powerful rebound. Along the way there were 3 setups that appealed to me. Last setup happened on May 19th with a gap down/rebound/gap down pattern. Today RSX closed below both the 50-day and the 200-day moving averages. My best guess at this point is that we will get a weak rebound followed by more selling in RSX.
RSX chart
Picture
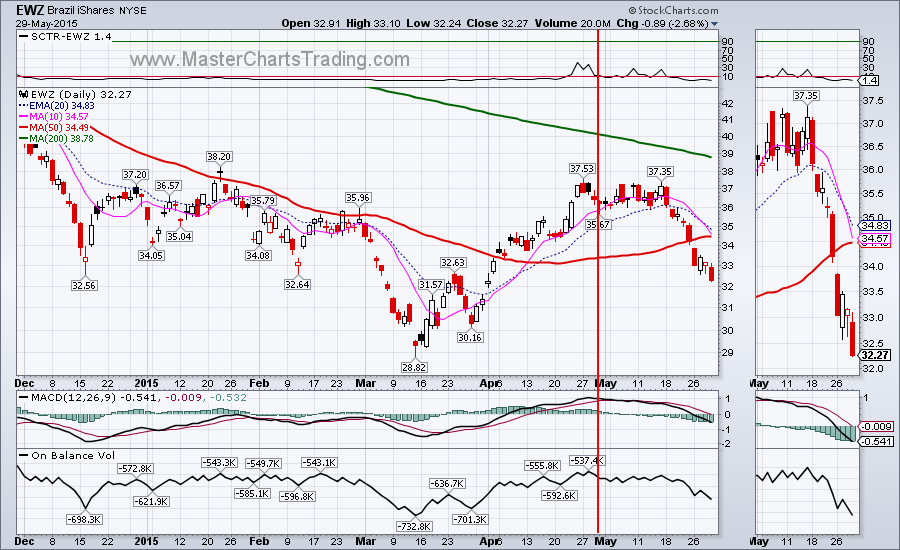
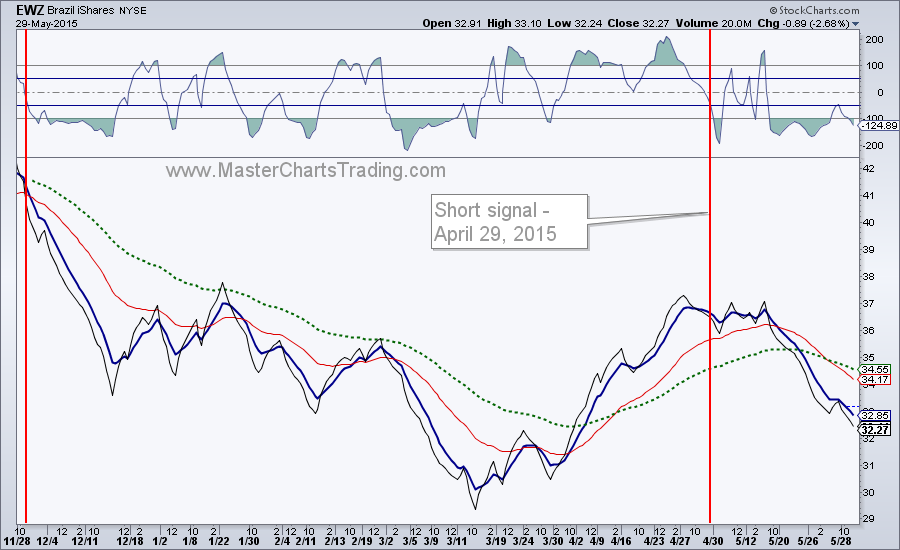
       EWZ – the Brazil ETF is also in a long-term downtrend that started at least last October. Again, for bearish securities I ignore all bullish setups. Last good short setup for EWZ happened in late April as a short signal was generated per our trading system. Since then, EWZ is down over 10%. EWZ is weak, oversold and staying oversold – a sign of possibly more downside to come.  
Chart for EWZand EWZ market timing chart
Picture
Picture
That’s it for this week’s market recap,

Best Regards and have another great trading week!

 ** Special Announcement**

We are weeks away from launching a stocks alert service. Please sign-up for our mailing list to be the first to take advantage of the discounted membership!


Alexander Berger (www.MasterChartsTrading.com)

Disclaimer, we have:

Open positions: IBB, XSD, IWM, IYR, TLT, DUST

New position: SCO

Closed position: LULU (stop-loss hit)

0 Comments

Market Recap For The Week Ending Friday May 22nd, 2015 - SPY QQQ aSHR TAN TLT GLD GDX USO UNG

5/23/2015

0 Comments

 
Friday, May 22nd, 2015 Weekly Market Recap.  

        The S&P 500 index hit an intraday all-time high on Wednesday and an all-time closing high on Thursday. The NASDAQ 100 ETF – QQQ, hit an all time high back in April, corrected into May and hit another all-time closing high on Thursday. This again reaffirms that stocks are still very much bullish.
Market breadth is uninspiring, but is on the upswing - consistent with a slow grind higher vs. a melt-up in prices. The Advance-Decline line for $SPX hit an all-time high this week. I wrote about a divergence between the AD-line and price of $SPX for past few weeks. This seems to have resolved in the bullish direction.  Charts for S&P 500, QQQ
Many world markets are similarly bullish to various degrees. For example Chinese ETF – ASHR hit an all time high on Friday. An over 40% move up in just about 2 month! Clearly Chinese equities are overbought, but very bullish nonetheless. For me this is not a good entry point for me. I would wait for a pullback to around the 50-day moving average to even consider entering this ETF.

Picture
We had an open position in solar ETF – TAN. On Wednesday this ETF plunged down as much as 10%! A very large move for an ETF. This just goes to show that it is very important to be aware of the ETF composition. Turns out that TAN had as much as 20% of the holdings in Hanergy (a Chinese solar panel maker) making TAN a poorly diversified ETF. Wednesday Hanergy plunged 47% and trading in this stock was suspended. We exited TAN with a small loss.
Picture
Bonds (TLT) are getting perilously close to my definition of an entry into a bear market. TLT has started its rebound, but there is now quite a bit of overhead resistance around $122, $125 and $126 price levels. A failure there and a break below the May 19th low could spell more trouble for bonds.
Picture
Gold has been very choppy of late. Last week gold seemed on the verge of bona fide breakout as it closed above the 200-day moving average. This week it is back below, now with a possible support break. Since beginning of April we had no less then 3 short signals in gold. Two of the signals did not work out. Is the latest short signal from yesterday the charm?
Gold charts

Gold miners ETF – GDX has a more constructive chart as of Friday close (if you are a gold bear). It is only a couple of percentage points away from the 50-day moving average. A close below it, and especially below the May 7th low could trigger a retest of March lows.
A rebound in the dollar is putting additional pressure on commodities of all sorts. Oil was already acting weak at the beginning of the month, but broke support on Tuesday – thus triggering our short signal. USO has rallied since but is having a difficult time. I think a retest of the 50-day moving average is very much likely in the near term. 

Picture
Finally natural gas had a confirmed Bearish Engulfing pattern on its chart on Wednesday, followed by a further breakdown on Friday. Long-term natural gas (UNG) is bearish, so I am treating this rally from late April low as a rebound within a bigger downtrend. Our system gave us a short signal on Friday. We may see a partial retrace to $14.80 area and a failure there could be a nice entry point for a short. 
UNG candlestick chart and market timing chart

Picture
Picture
That’s it for this week’s market recap,

Best Regards and have another great trading week!

 ** Special Announcement**

We are weeks away from launching a stocks alert service. Please sign-up for our mailing list to be the first to take advantage of the discounted membership!


Alexander Berger (www.MasterChartsTrading.com)

Disclaimer, we have:

Open positions: IBB, XSD, IWM, IYR, LULU, TLT

New position: DUST

Closed position: TAN

0 Comments
<<Previous
    Picture
    Picture

    Subscribe to our mailing list!

    * indicates required
    /* real people should not fill this in and expect good things - do not remove this or risk form bot signups */

    Intuit Mailchimp

    Click to set custom HTML
    Picture
    Picture

    Archives

    January 2025
    December 2024
    November 2024
    October 2024
    September 2024
    August 2024
    July 2024
    June 2024
    May 2024
    April 2024
    March 2024
    February 2024
    January 2024
    December 2023
    November 2023
    October 2023
    September 2023
    August 2023
    July 2023
    June 2023
    May 2023
    April 2023
    March 2023
    February 2023
    January 2023
    December 2022
    November 2022
    October 2022
    September 2022
    August 2022
    July 2022
    June 2022
    May 2022
    April 2022
    March 2022
    February 2022
    January 2022
    December 2021
    November 2021
    October 2021
    September 2021
    August 2021
    July 2021
    June 2021
    May 2021
    April 2021
    March 2021
    February 2021
    January 2021
    December 2020
    November 2020
    October 2020
    September 2020
    August 2020
    July 2020
    June 2020
    May 2020
    April 2020
    March 2020
    February 2020
    January 2020
    December 2019
    November 2019
    October 2019
    September 2019
    August 2019
    July 2019
    June 2019
    May 2019
    April 2019
    March 2019
    February 2019
    January 2019
    December 2018
    November 2018
    October 2018
    September 2018
    August 2018
    July 2018
    June 2018
    May 2018
    April 2018
    March 2018
    February 2018
    January 2018
    December 2017
    November 2017
    October 2017
    September 2017
    August 2017
    July 2017
    June 2017
    May 2017
    April 2017
    March 2017
    February 2017
    January 2017
    December 2016
    November 2016
    October 2016
    September 2016
    August 2016
    July 2016
    June 2016
    May 2016
    April 2016
    March 2016
    February 2016
    January 2016
    December 2015
    November 2015
    October 2015
    September 2015
    August 2015
    July 2015
    June 2015
    May 2015
    April 2015
    March 2015
    February 2015
    January 2015
    December 2014
    November 2014
    October 2014
    September 2014
    August 2014
    June 2014
    May 2014
    April 2014
    March 2014
    February 2014
    January 2014

    RSS Feed

  All information on MasterChartsTrading.com is for educational and entertainment purposes only, and should not be construed as a recommendation to buy, sell or sell-short said securities. Read full disclaimer.