|
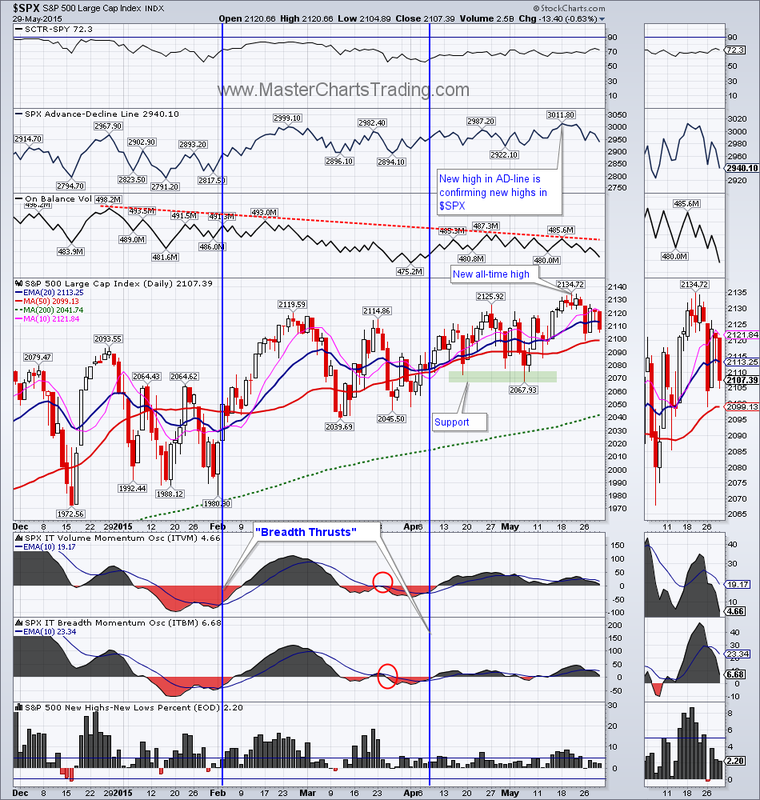
S&P 500 was down for the week as it digested the all-time highs of last week. There was some wild action at the beginning of the week as stocks plunged Tuesday only recoup most of the losses on Wednesday.
There is now an obvious divergence in the $SPX and the on-balance volume indicator – $SPX is making higher highs while the on-balance volume is pushing lower instead. It’s difficult to say where this will lead. For the time being stocks are pushing higher, $SPX is still on a breadth thrust up and the market is generally bullish. Chart of S&P 500 |
|
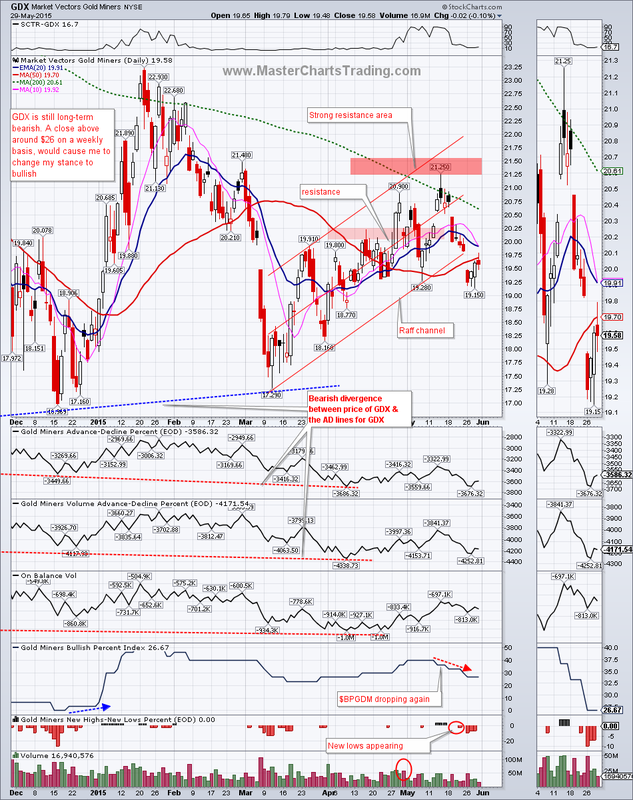
Chart of GDX
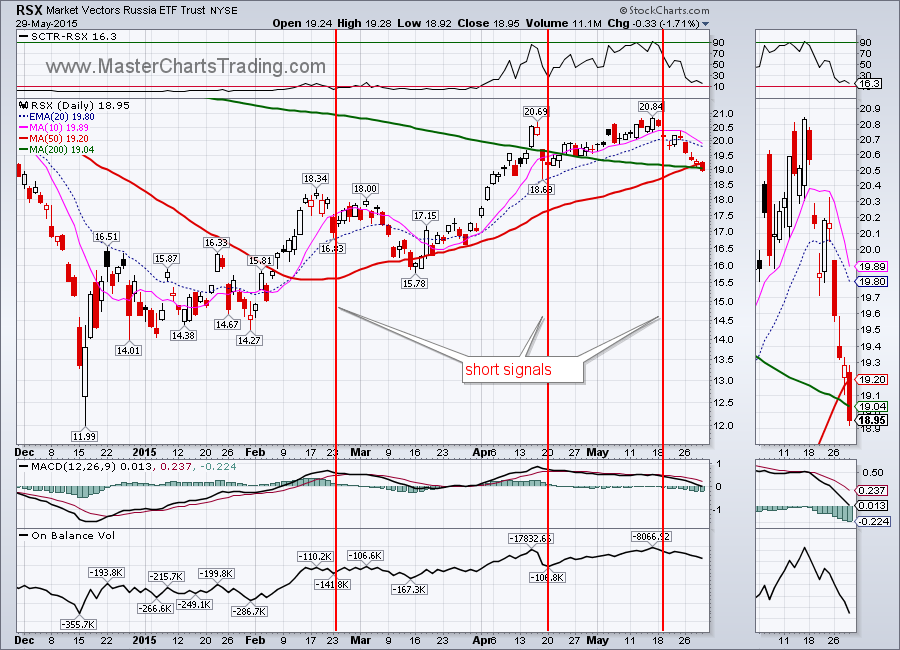
RSX – the Russia ETF is in a long-term downtrend that started at least a year ago. I am therefore ignoring all bullish setups and only looking for bearish once. RSX put in a low last December and then had a powerful rebound. Along the way there were 3 setups that appealed to me. Last setup happened on May 19th with a gap down/rebound/gap down pattern. Today RSX closed below both the 50-day and the 200-day moving averages. My best guess at this point is that we will get a weak rebound followed by more selling in RSX.
RSX chart
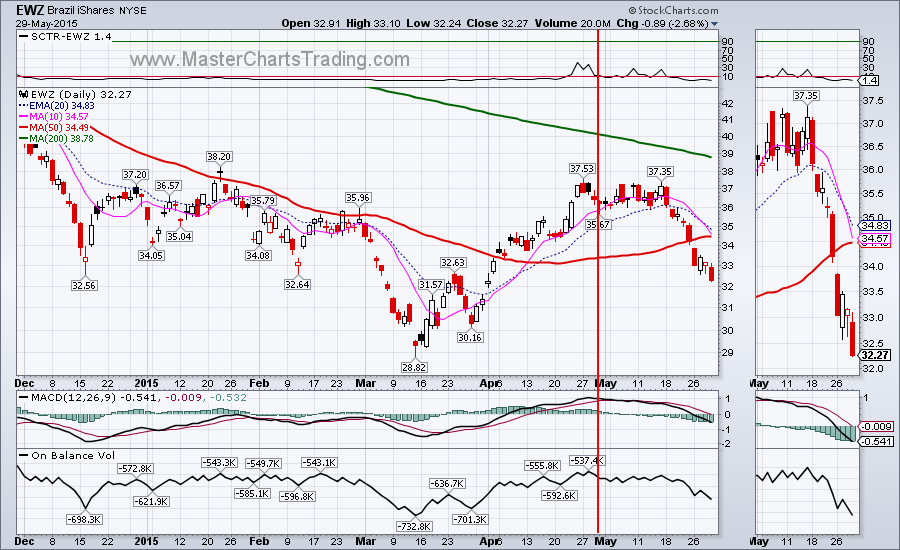
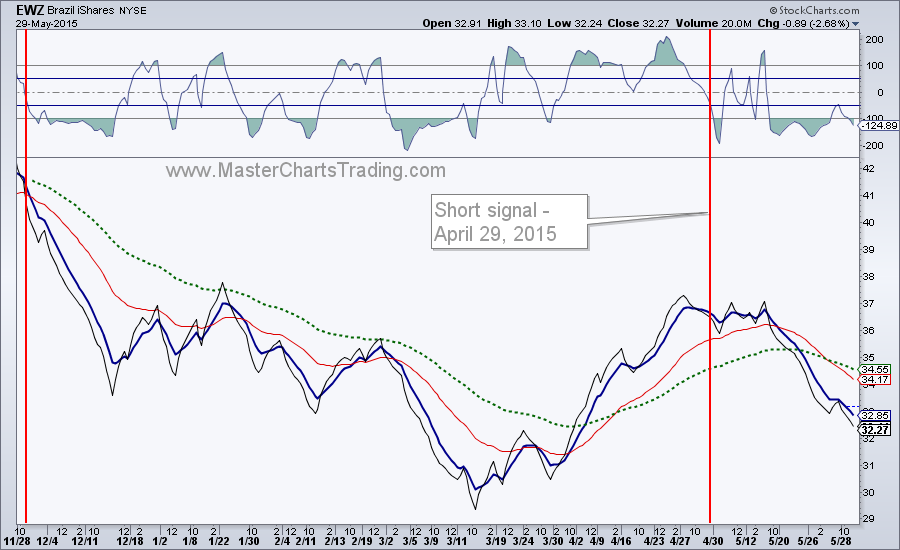
Chart for EWZand EWZ market timing chart
Best Regards and have another great trading week!
** Special Announcement**
We are weeks away from launching a stocks alert service. Please sign-up for our mailing list to be the first to take advantage of the discounted membership!
Alexander Berger (www.MasterChartsTrading.com)
Disclaimer, we have:
Open positions: IBB, XSD, IWM, IYR, TLT, DUST
New position: SCO
Closed position: LULU (stop-loss hit)


 RSS Feed