|
Friday, May 22nd, 2015 Weekly Market Recap.
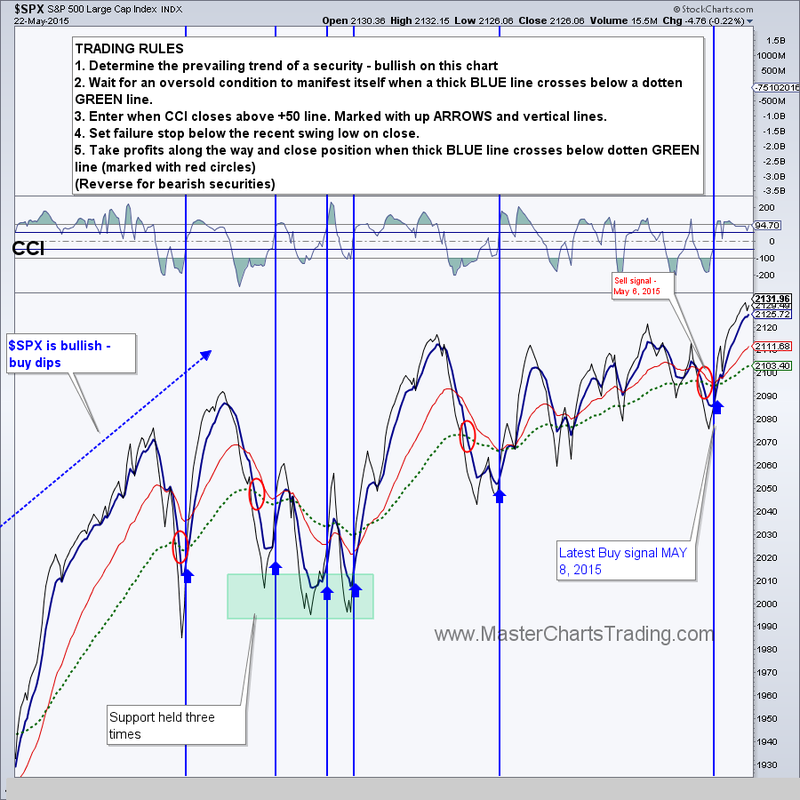
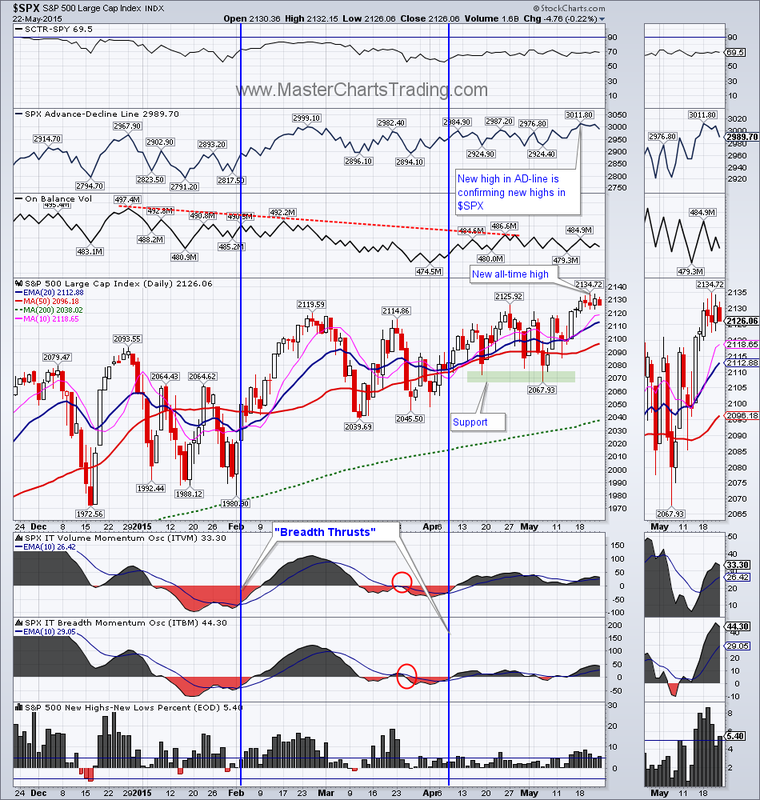
The S&P 500 index hit an intraday all-time high on Wednesday and an all-time closing high on Thursday. The NASDAQ 100 ETF – QQQ, hit an all time high back in April, corrected into May and hit another all-time closing high on Thursday. This again reaffirms that stocks are still very much bullish. Market breadth is uninspiring, but is on the upswing - consistent with a slow grind higher vs. a melt-up in prices. The Advance-Decline line for $SPX hit an all-time high this week. I wrote about a divergence between the AD-line and price of $SPX for past few weeks. This seems to have resolved in the bullish direction. Charts for S&P 500, QQQ |
|

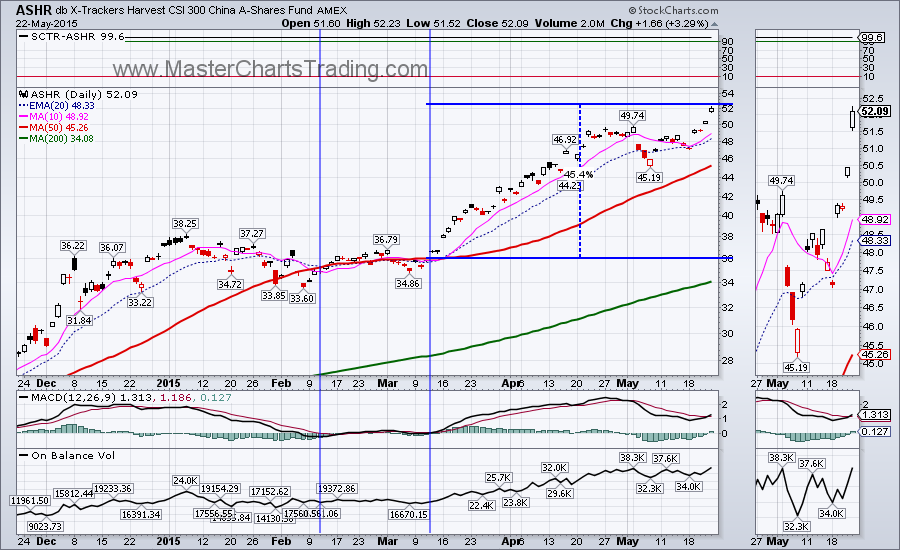
Many world markets are similarly bullish to various degrees. For example Chinese ETF – ASHR hit an all time high on Friday. An over 40% move up in just about 2 month! Clearly Chinese equities are overbought, but very bullish nonetheless. For me this is not a good entry point for me. I would wait for a pullback to around the 50-day moving average to even consider entering this ETF.
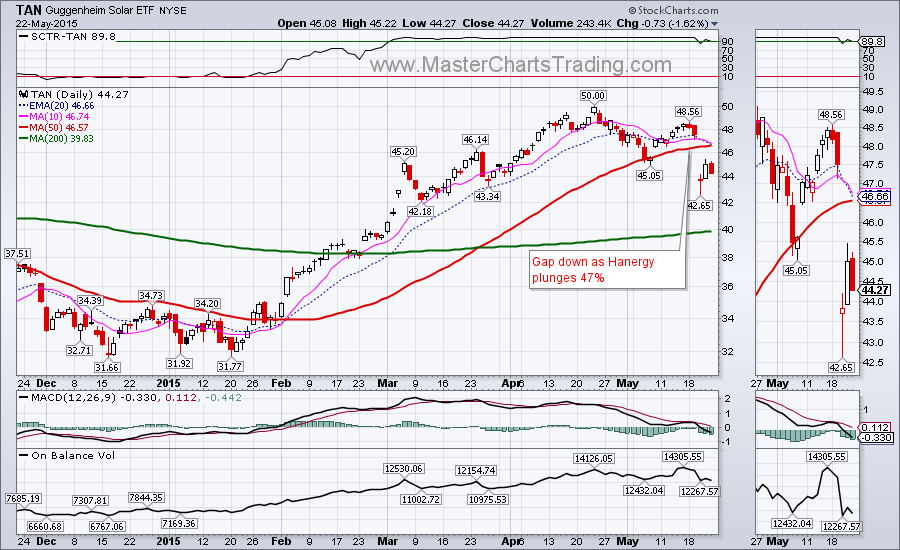
We had an open position in solar ETF – TAN. On Wednesday this ETF plunged down as much as 10%! A very large move for an ETF. This just goes to show that it is very important to be aware of the ETF composition. Turns out that TAN had as much as 20% of the holdings in Hanergy (a Chinese solar panel maker) making TAN a poorly diversified ETF. Wednesday Hanergy plunged 47% and trading in this stock was suspended. We exited TAN with a small loss.
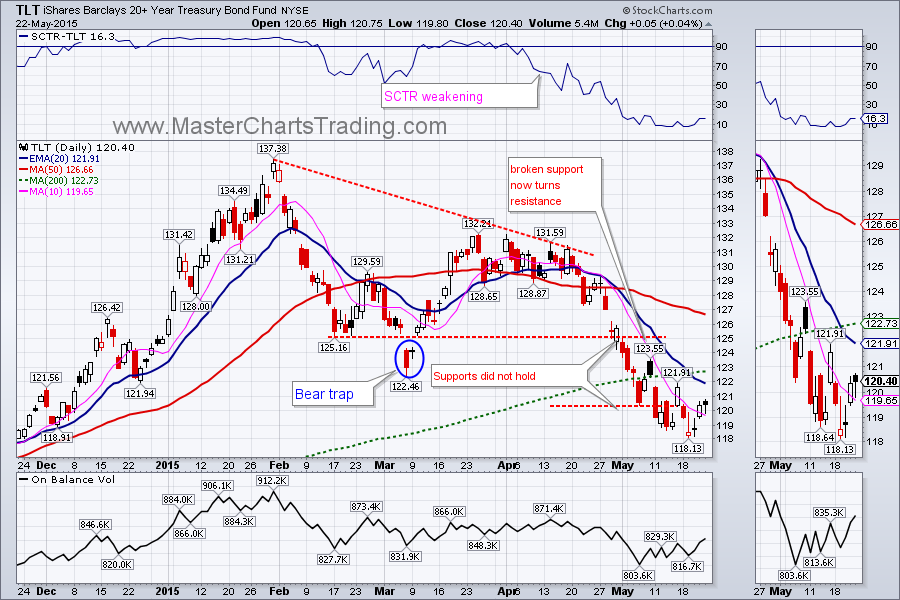
Bonds (TLT) are getting perilously close to my definition of an entry into a bear market. TLT has started its rebound, but there is now quite a bit of overhead resistance around $122, $125 and $126 price levels. A failure there and a break below the May 19th low could spell more trouble for bonds.
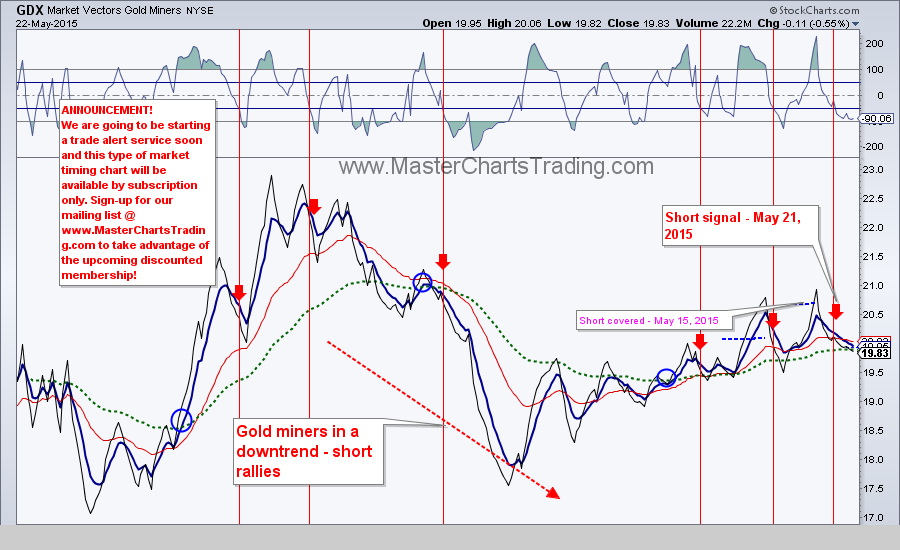
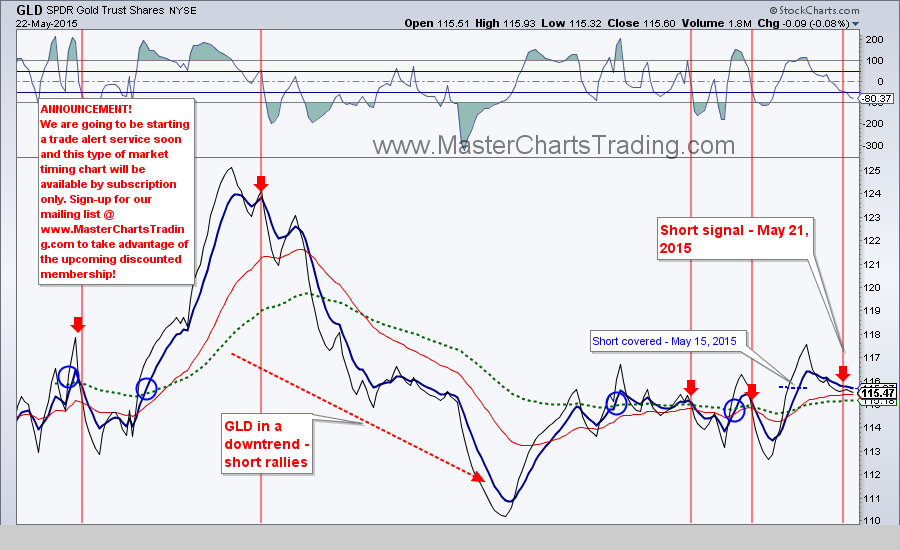
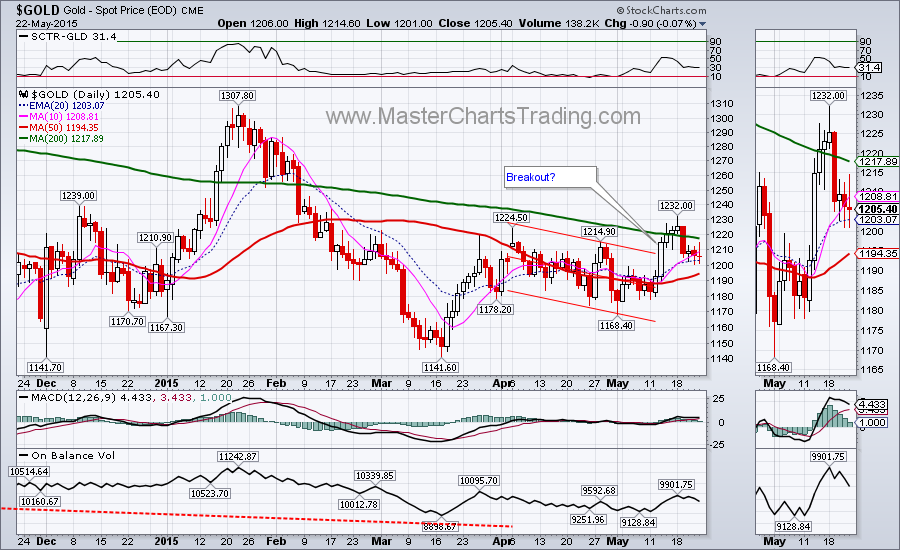
Gold has been very choppy of late. Last week gold seemed on the verge of bona fide breakout as it closed above the 200-day moving average. This week it is back below, now with a possible support break. Since beginning of April we had no less then 3 short signals in gold. Two of the signals did not work out. Is the latest short signal from yesterday the charm?
Gold charts
Gold charts
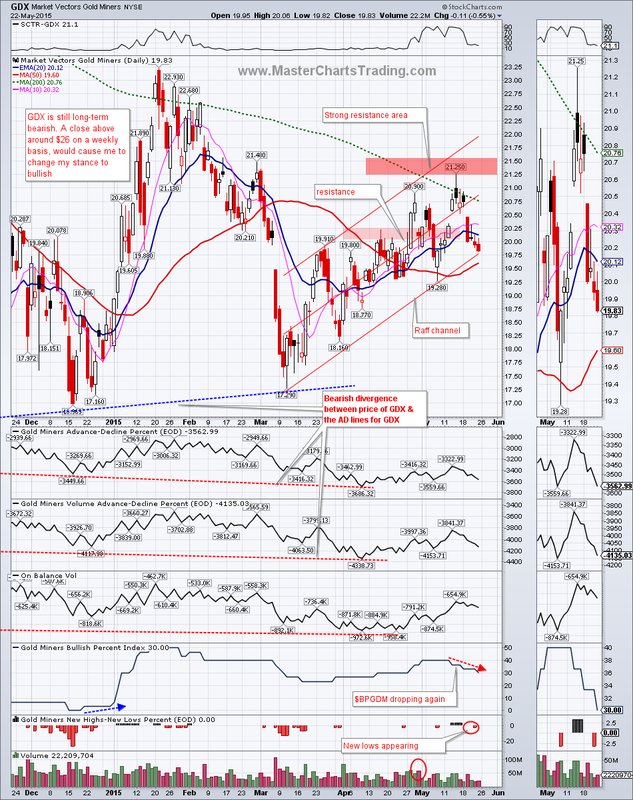
Gold miners ETF – GDX has a more constructive chart as of Friday close (if you are a gold bear). It is only a couple of percentage points away from the 50-day moving average. A close below it, and especially below the May 7th low could trigger a retest of March lows.
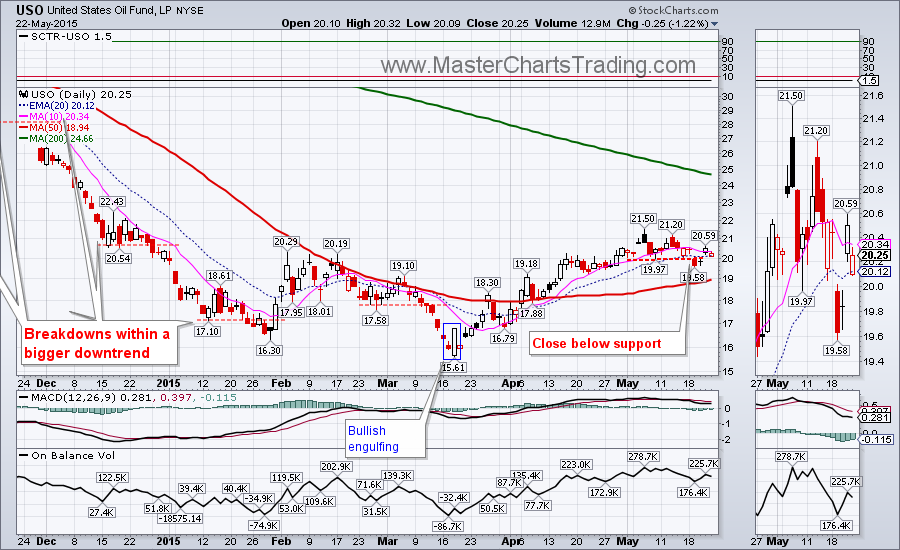
A rebound in the dollar is putting additional pressure on commodities of all sorts. Oil was already acting weak at the beginning of the month, but broke support on Tuesday – thus triggering our short signal. USO has rallied since but is having a difficult time. I think a retest of the 50-day moving average is very much likely in the near term.
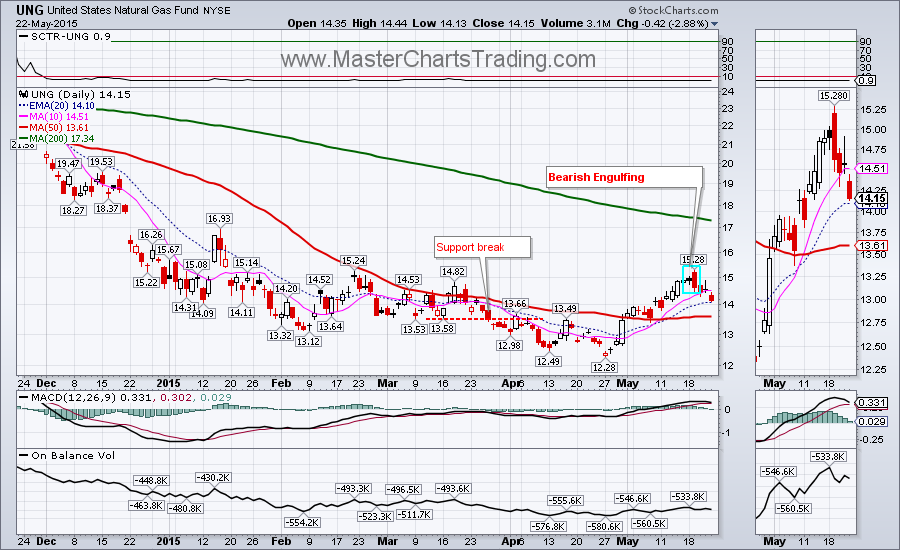
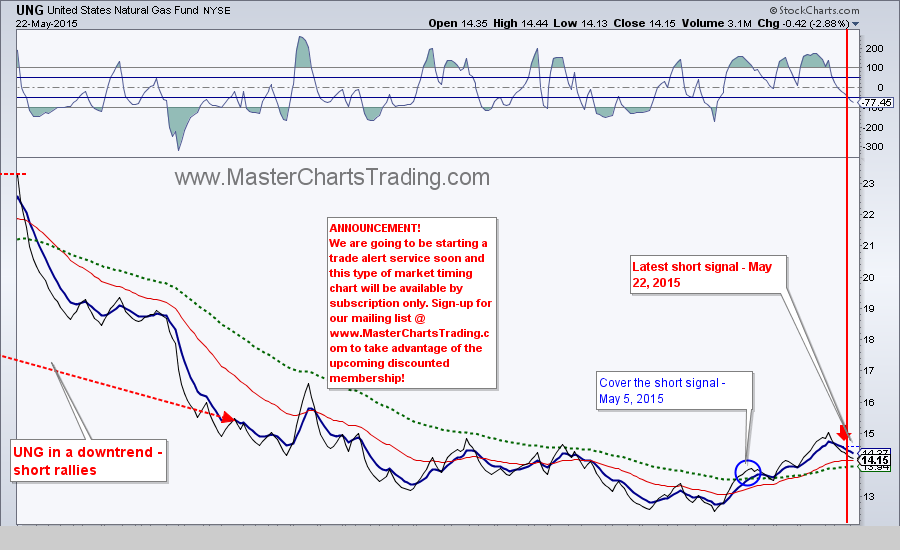
Finally natural gas had a confirmed Bearish Engulfing pattern on its chart on Wednesday, followed by a further breakdown on Friday. Long-term natural gas (UNG) is bearish, so I am treating this rally from late April low as a rebound within a bigger downtrend. Our system gave us a short signal on Friday. We may see a partial retrace to $14.80 area and a failure there could be a nice entry point for a short.
UNG candlestick chart and market timing chart
UNG candlestick chart and market timing chart
That’s it for this week’s market recap,
Best Regards and have another great trading week!
** Special Announcement**
We are weeks away from launching a stocks alert service. Please sign-up for our mailing list to be the first to take advantage of the discounted membership!
Alexander Berger (www.MasterChartsTrading.com)
Disclaimer, we have:
Open positions: IBB, XSD, IWM, IYR, LULU, TLT
New position: DUST
Closed position: TAN


 RSS Feed