|
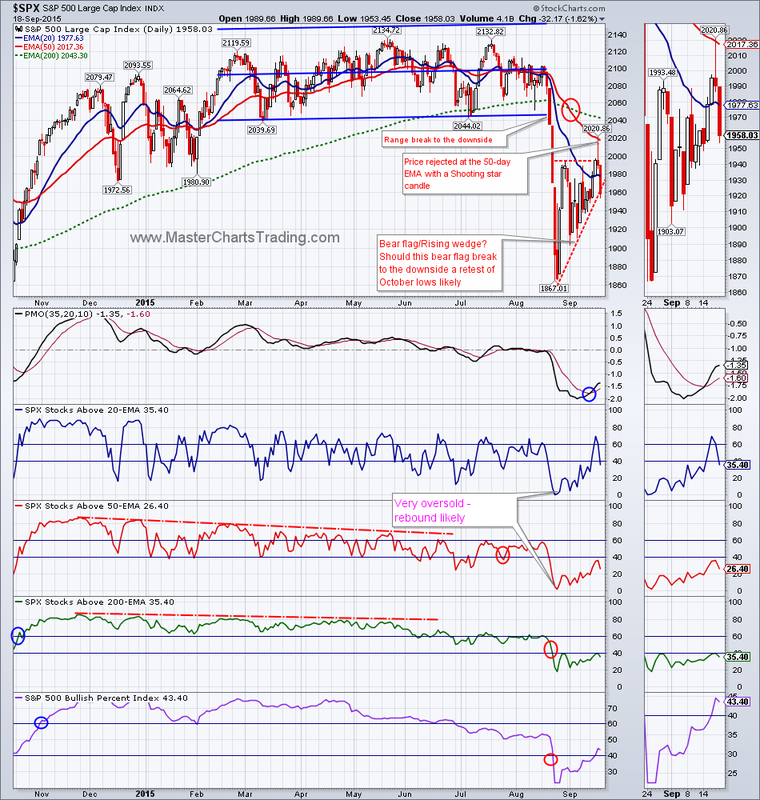
Following a support break in mid-August, the S&P 500 ($SPX) bottomed out in late August at 1867.01. It then went on to rebound over 8% to the high for the move set this Thursday at 2020.86. The Fed’s decision caused significant selling to take place and Thursday’s candlestick print was a classic Shooting Star – prices spiked intraday only to sell off and finish below the opening by the close. The Shooting star was later confirmed on Friday with more selling. We may now possibly have a rising wedge/bear flag break on the chart of $SPX. Should this break be confirmed, $SPX is likely to retest the October lows again.
Live chart of S&P 500 |
|
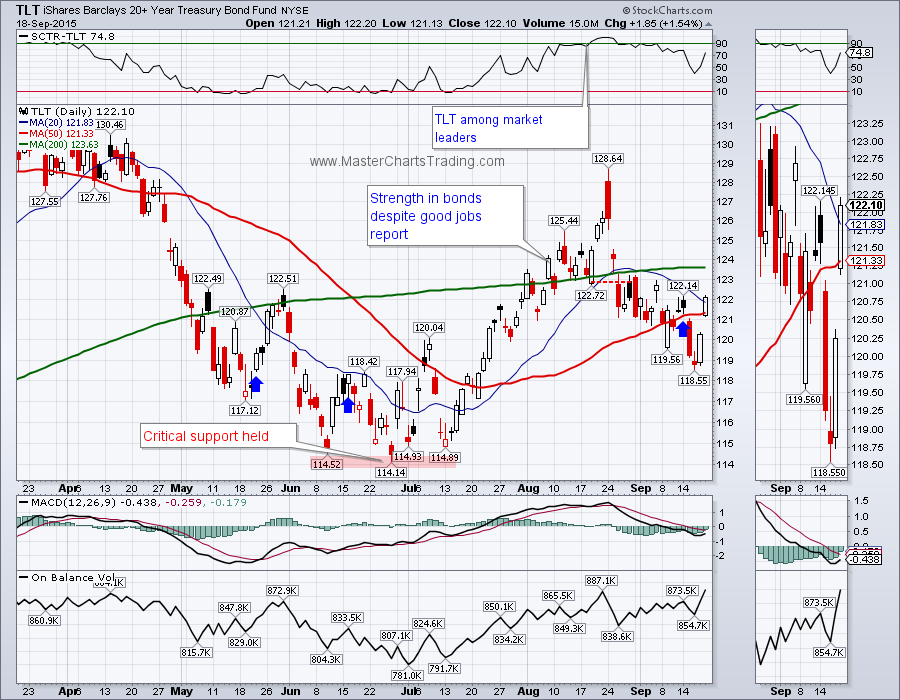
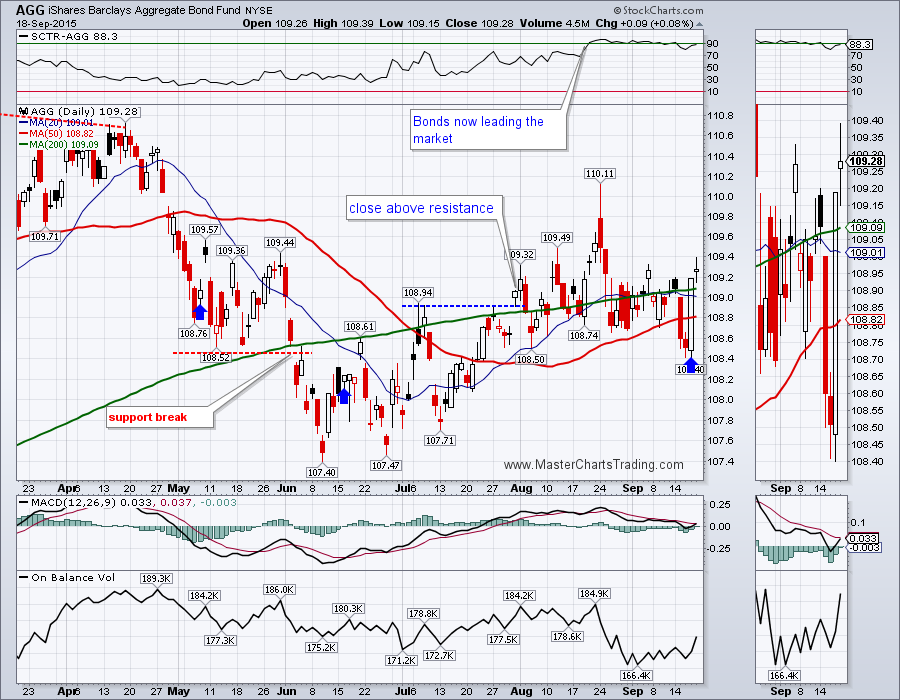
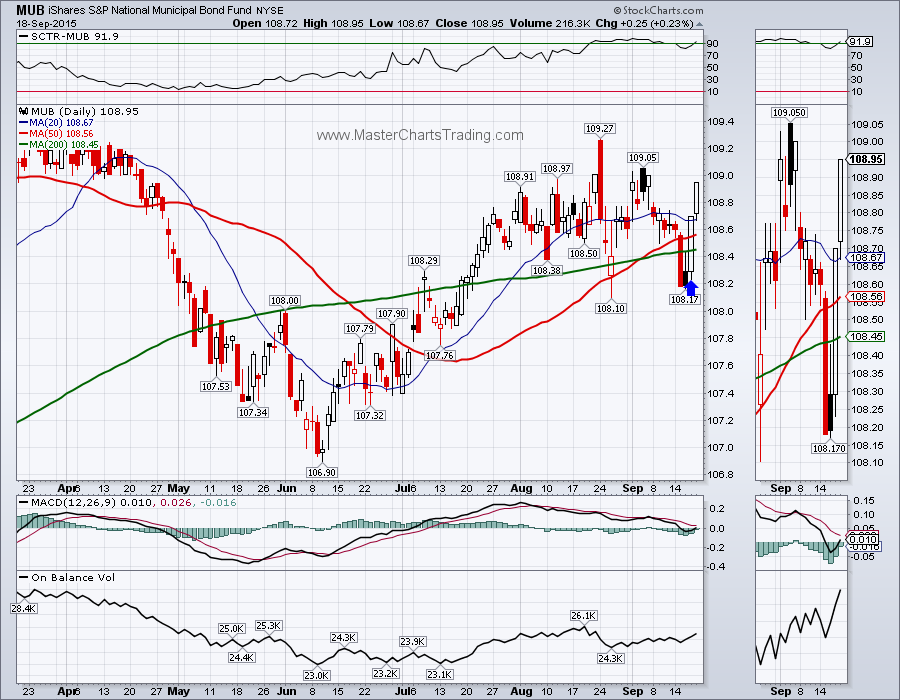
Fed’s decision to hold short-term interest rates steady was clearly greeted with enthusiasm by bond bulls. Bond funds across the board gained strongly on Thursday and followed through on Friday with more gains. This reaffirms my current defensive posture and I added to my open positions in TLT. Additionally I opened a position in MUB (municipal bonds). There is some overhead resistance for TLT around $123 where the 200-day moving average currently resides, but TLT could easily challenge the resent highs it set at $128, should stocks continue to come under pressure.
Charts of TLT, AGG and MUB
Charts of TLT, AGG and MUB
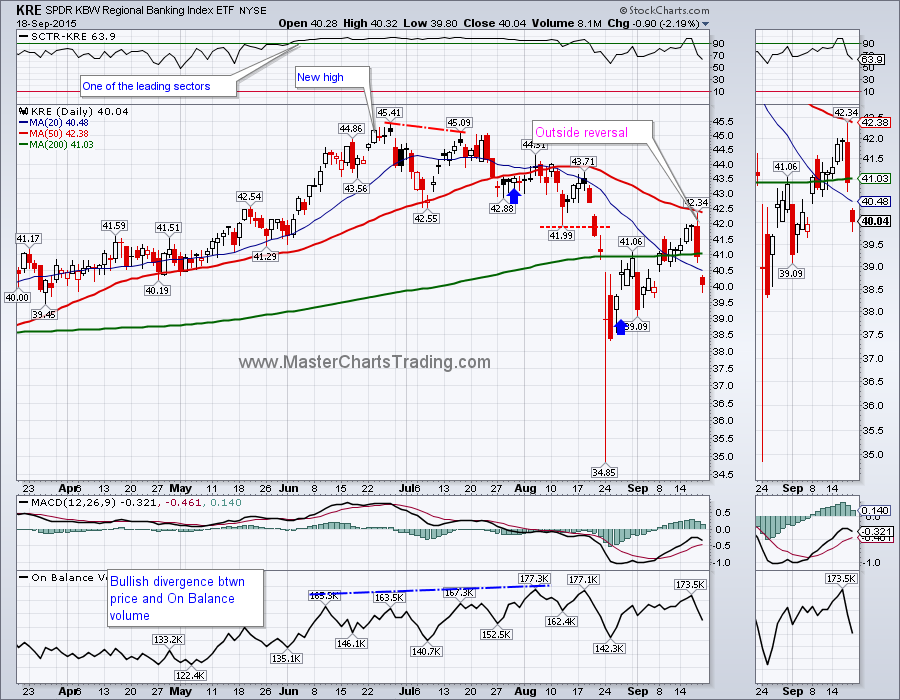
Bank funds saw some of the larger outflows of cash as stocks sold off and bonds rose. KRE – the regional banking ETF had a confirmed Outside Reversal on Thursday. An outside reversal happens when the previous day’s trading range lies completely within today’s trading range. Friday’s gap-and-run lower confirmed this reversal.
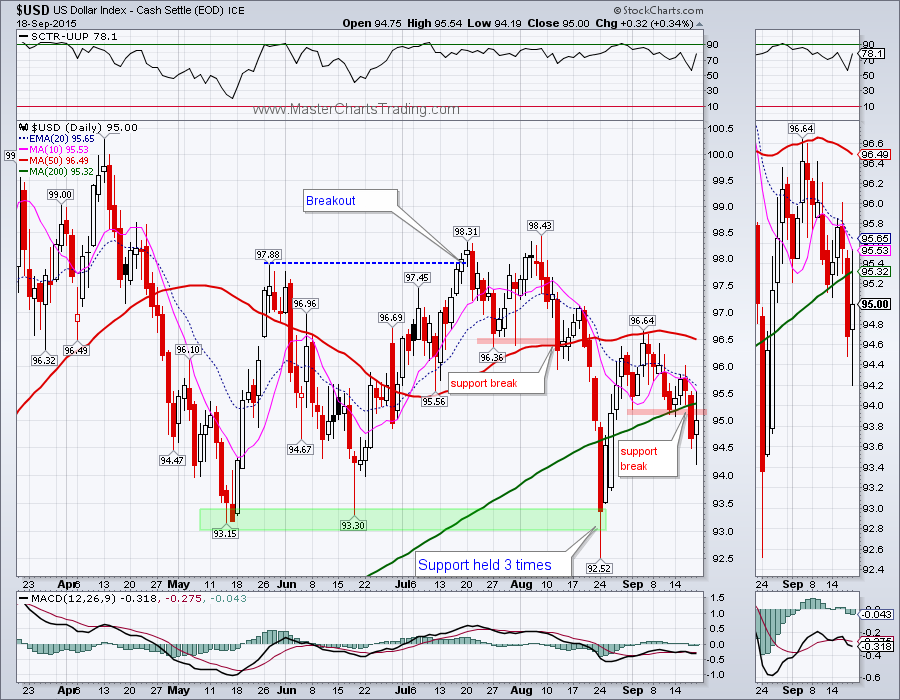
Before I get to gold, its worthwhile to take a look at the US dollar index ($USD). Fed’s failure to raise the interest rates put a downward pressure on the $USD. Thursday it broke support and closed below the 200-day moving average. My best guess is that it is going to retest major support in the $93 area for the 4th time in 5 month. For now $USD is still in an uptrend, but should that support at $93 give, this long-term uptrend would be called into question.
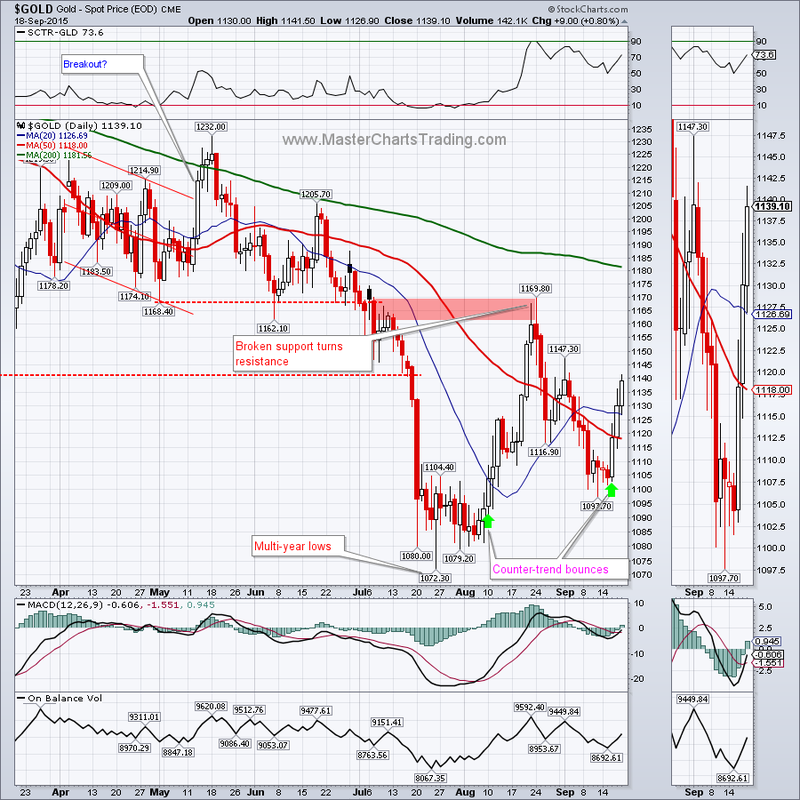
Gold prospers when the dollar is under pressure. Again this week we had a strong bounce that took gold to the previous broken support around $1140. Gold is still in a long-term downtrend and I will look for shorting opportunities. However there is no denying that price wants to go higher in the near term. Unless we fail here at $1140, gold could try to challenge the previous recent peak at $1169.
Charts of gold and precious metals
Charts of gold and precious metals
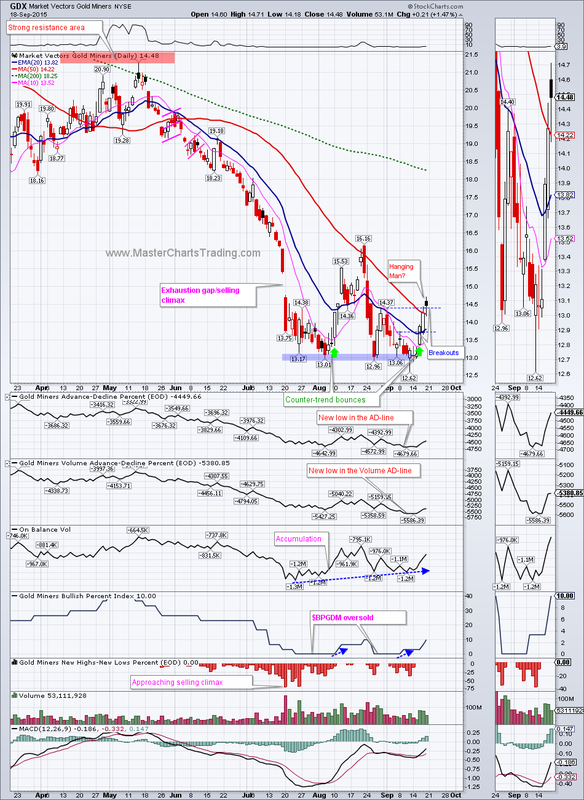
GDX followed suit, and rebounded strongly from support at $13. GDX managed to close above the 50-day moving average – a feat it wasn’t able to achieve since early June. This a positive sign for GDX bulls. On-Balance volume indicator is showing a bullish divergence - GDX traded flat, while the On-Balance volume made a higher low over the past couple of month. Similarly, the Bullish Percent index also is bouncing from extremely oversold level of zero. As with gold, GDX is in a long-term downtrend, but is currently in a middle of a counter-trend bounce.
Chart of GDX here
That’s it for this week’s market recap,
Best Regards and have another great trading week!
** Special Announcement**
We are close (hopefully October 10th) to launching a stocks alert service. Please sign-up for our mailing list to be the first to take advantage of the discounted membership once it becomes available!
Alexander Berger (www.MasterChartsTrading.com)


 RSS Feed