|
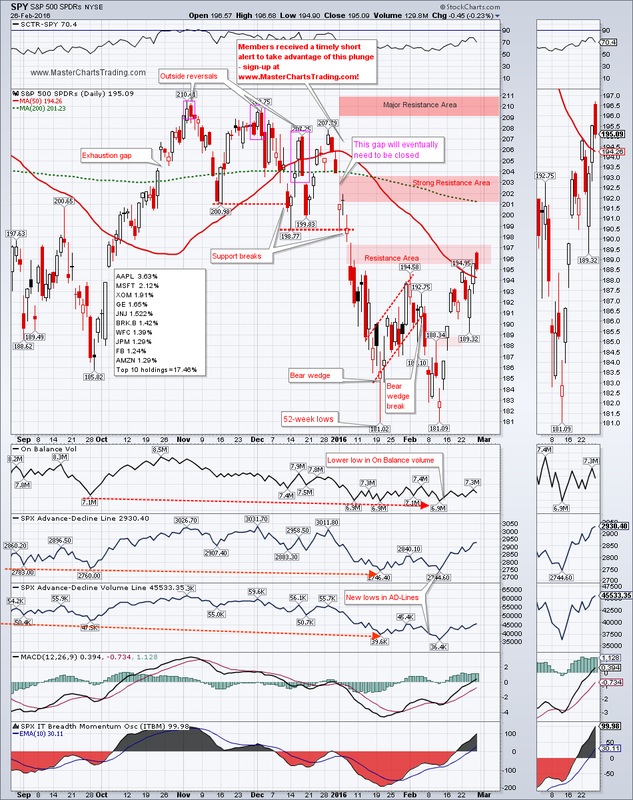
On Thursday, February 25, 2016, S&P 500 was finally able to close above the 50-day moving average for the first time this year. SPY gained 1.61% for the week.
On Friday, SPY attempted to push higher, but ran into a resistance and closed near the lows for the session. For now the resistance in the $197 area was reaffirmed. Further up in the $203 area is a large unfilled gap-down. Together with the declining 200-day moving average that area should now act as strong resistance. This is all provided if SPY even gets to that area. Even higher in the $210 area are the previous all-time highs. If the resistance around $203 gives, a run-up to all-time highs cannot be excluded. CHART OF SPY |
|
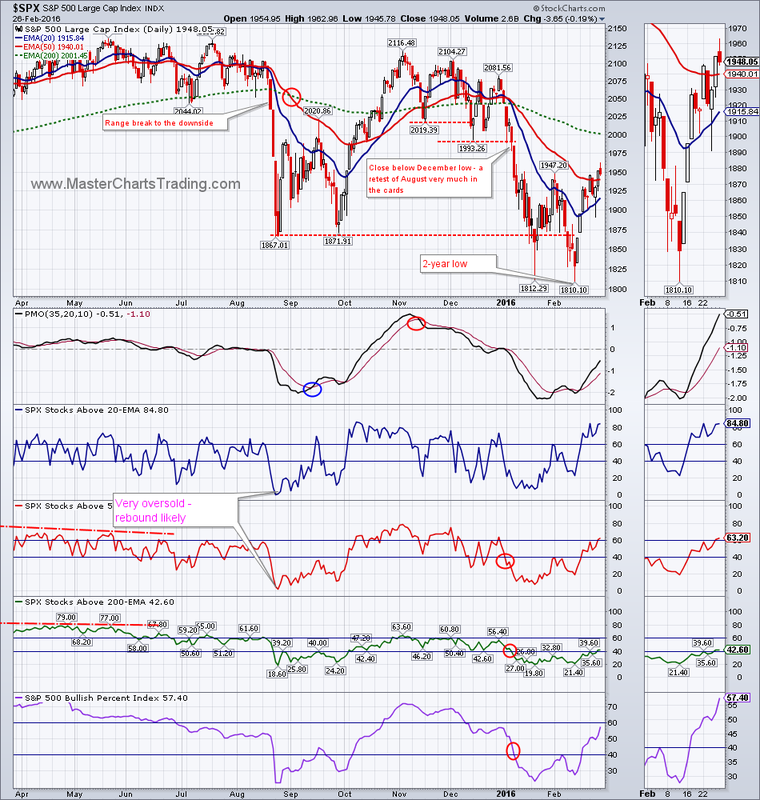
The various breadth measures are recovering from the somewhat oversold levels. For example: there are now over 40% of stocks within the $SPX that are above their 200-day exponential moving average. Also the Bullish Percent index for $SPX is approaching 60%. These are all positive signs, but…
CHART OF $SPX
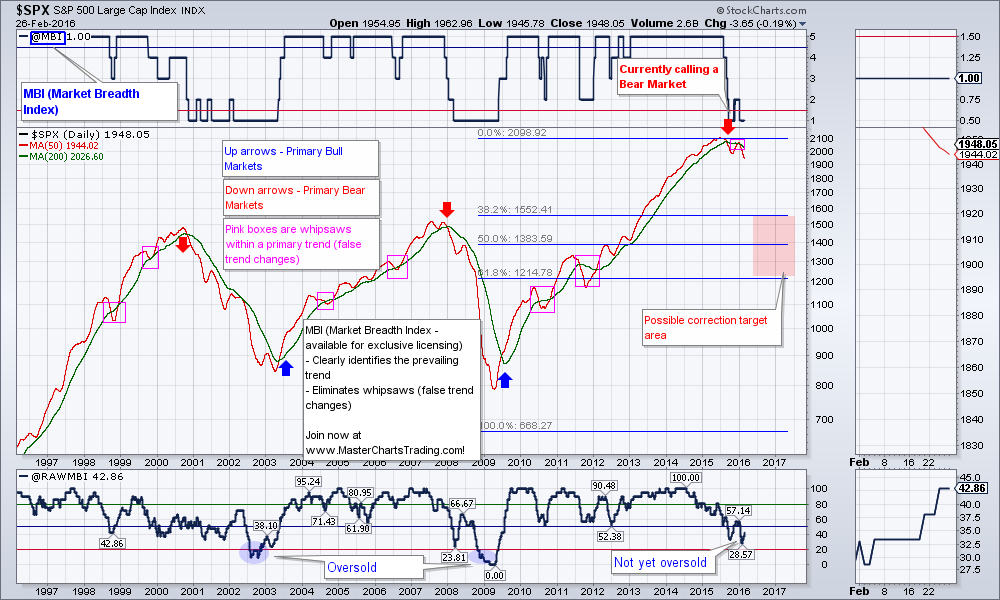
… if it wasn’t for the fact that stocks are in a bear market. My custom market indicator - the Market Breadth Index (MBI), entered into its bearish territory last September and is yet to turn bullish. MBI uses multiple inputs to make its determination of the general market trend with around a 90% accuracy going back to the 1970s. For now, not a single one of those inputs has flipped into the bullish camp.
CHART OF $SPX
… if it wasn’t for the fact that stocks are in a bear market. My custom market indicator - the Market Breadth Index (MBI), entered into its bearish territory last September and is yet to turn bullish. MBI uses multiple inputs to make its determination of the general market trend with around a 90% accuracy going back to the 1970s. For now, not a single one of those inputs has flipped into the bullish camp.
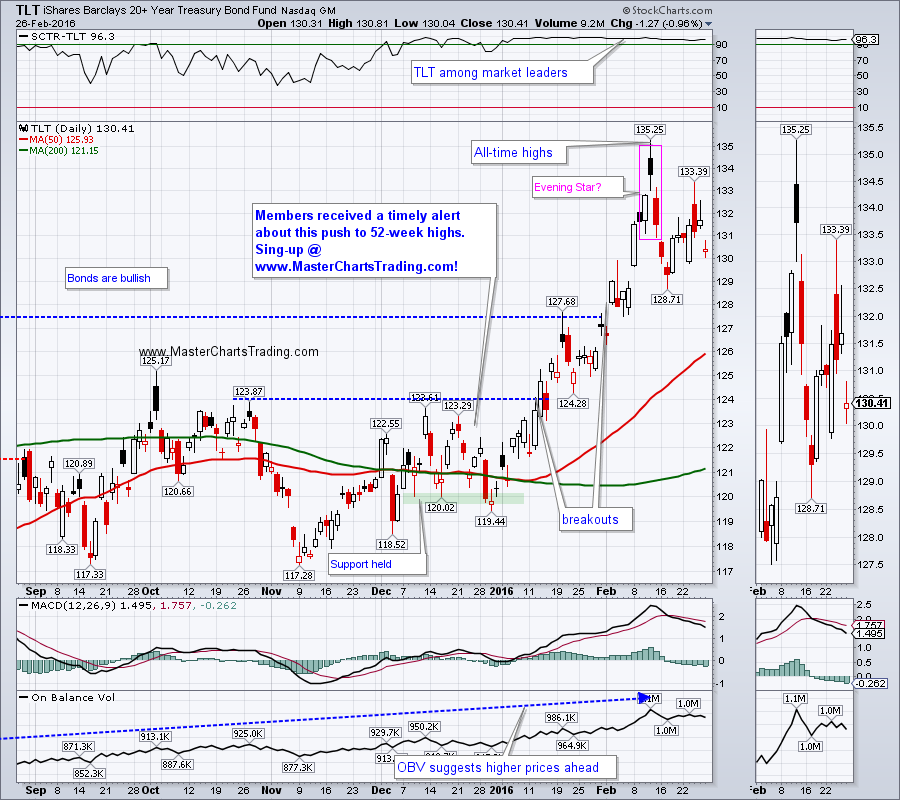
Bonds sold-off slightly from the all-time highs set two weeks ago. Still, despite a sizable run-up in stocks from the recently set 2-year lows, bonds are trading very near to their all-time highs. This is indicative of highly elevated levels of fear in the markets. Today TLT had a big gap down and this gap still remain unfilled. This shows that the initiative may have shifted to the bond bears in the short term and TLT still could retest its breakout above the $127 area. Dividends for the various iShares bond funds are also going to be disbursed in the beginning of the month, so we may see some selling around the ex-dividend date.
CHART OF TLT
CHART OF TLT
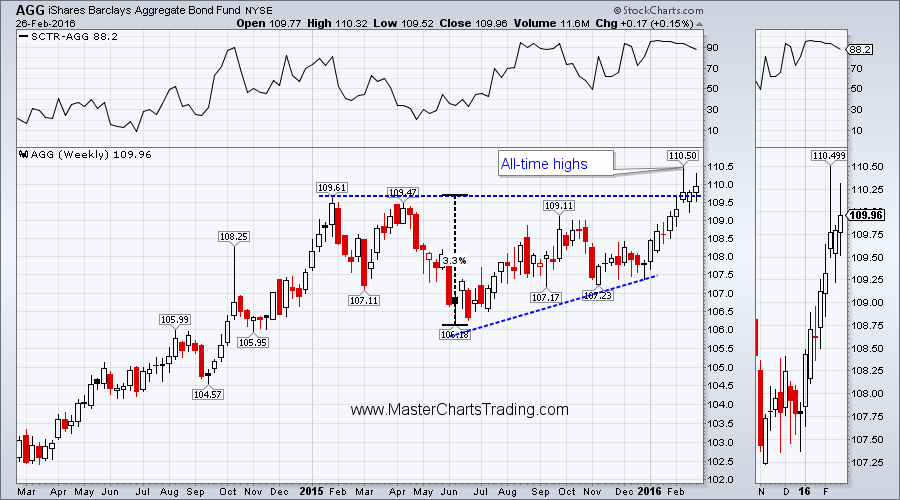
Bullish action in the bonds can further be visualized by looking at a long-term chart of AGG. As can be seen below, AGG is now trading above the breakout to all-time highs. Should stocks come under more selling pressure, AGG could easily run higher to the $114 area (based on the measured move target from the bottom of the pattern)
LONG-TERM CHART OF AGG
LONG-TERM CHART OF AGG
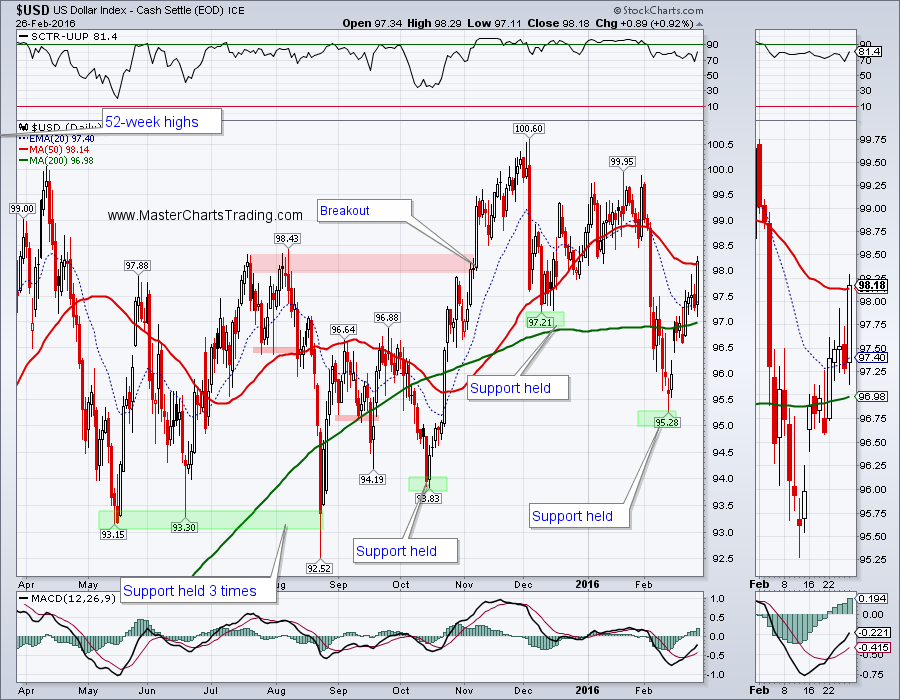
The US Dollar index held support following a plunge several weeks ago and now rallied to above both the 50-day and the 200-day moving averages. This is undoubtedly due to Euro loosing ground against the dollar.
CHART OF $USD
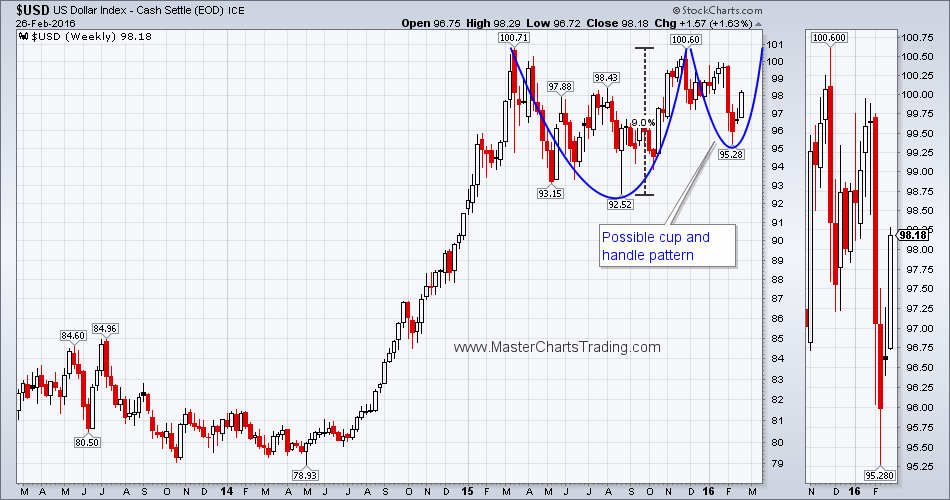
Long-term the dollar is bullish and may be poised for a major breakout to new 52-week highs. Please take a look at the chart below. This is a weekly chart of $USD going back 3 years. Notice that for the past year or so, $USD has been tracing out a potential Cup and Handle pattern. Should a breakout above the lip of the “handle” occur above 100.71, we could see a major run of another 9% or so (based on the measured move target from the bottom of the pattern). Any further strength in the US Dollar will weigh on commodities, especially gold.
LONG-TERM CHART OF $USD
CHART OF $USD
Long-term the dollar is bullish and may be poised for a major breakout to new 52-week highs. Please take a look at the chart below. This is a weekly chart of $USD going back 3 years. Notice that for the past year or so, $USD has been tracing out a potential Cup and Handle pattern. Should a breakout above the lip of the “handle” occur above 100.71, we could see a major run of another 9% or so (based on the measured move target from the bottom of the pattern). Any further strength in the US Dollar will weigh on commodities, especially gold.
LONG-TERM CHART OF $USD
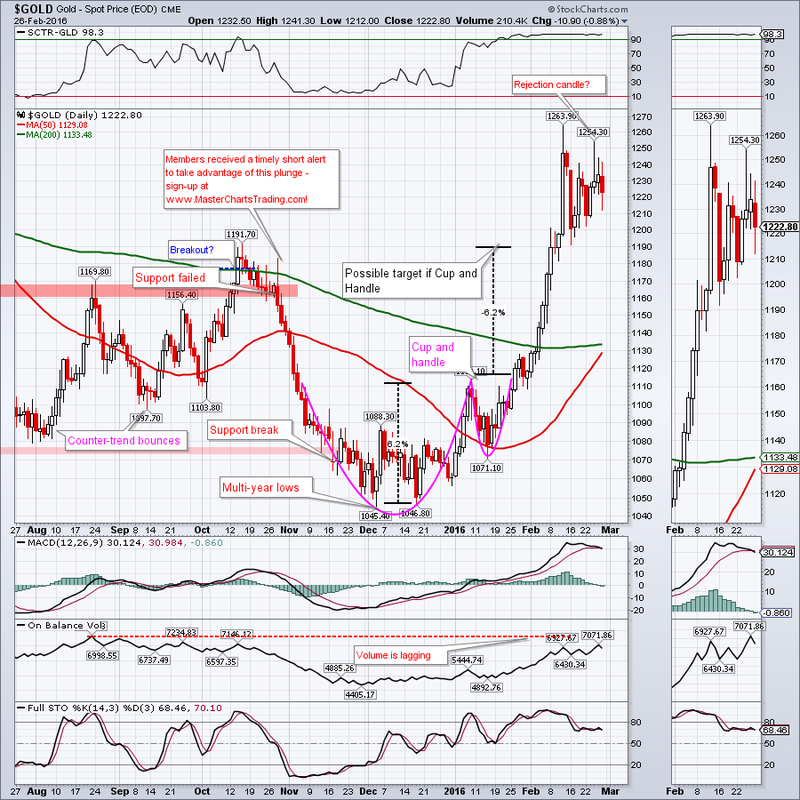
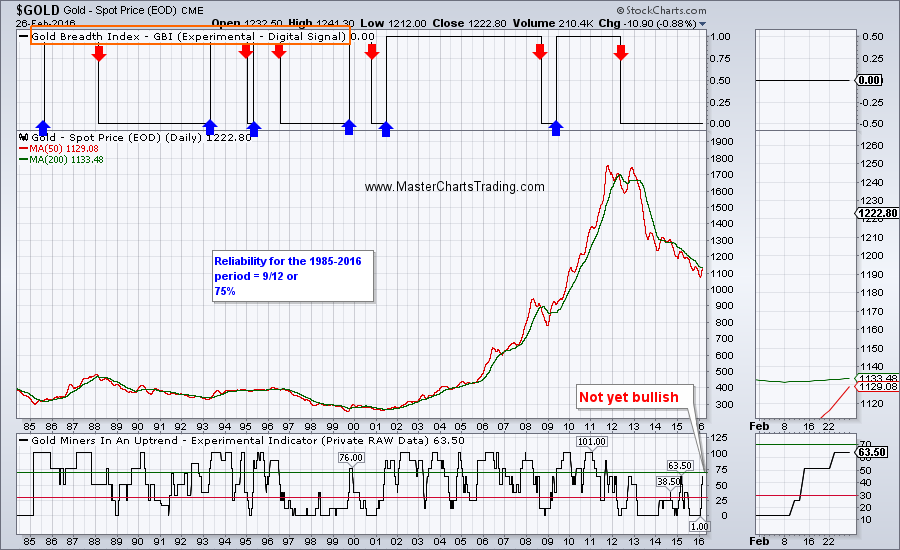
Gold as priced in the US Dollars attracted a lot of attention of late with its purported breakout. The move off the lows in December certainly looks strong, but is it strong enough to reverse the long-term downtrend that gold has been locked in? As of the writing of this blog post on Friday, February 26, 2016 I still don’t think so.
GOLD CHART
GOLD CHART
Last week I introduced a Gold Breadth Index (GBI) – a custom gold market indicator that was helpful in determining gold’s long-term trend. From the mid-1980s till now GBI enjoyed about a 75% success rate with 9 out of the 12 major trend signals being very good. GBI also was able to eliminate countless false trend changes (whipsaws). For now GBI has not yet given a bullish signal. It can do so in the very near future because one of the inputs for GBI (gold miners in an uptrend) is getting very close to flipping into the bullish camp.
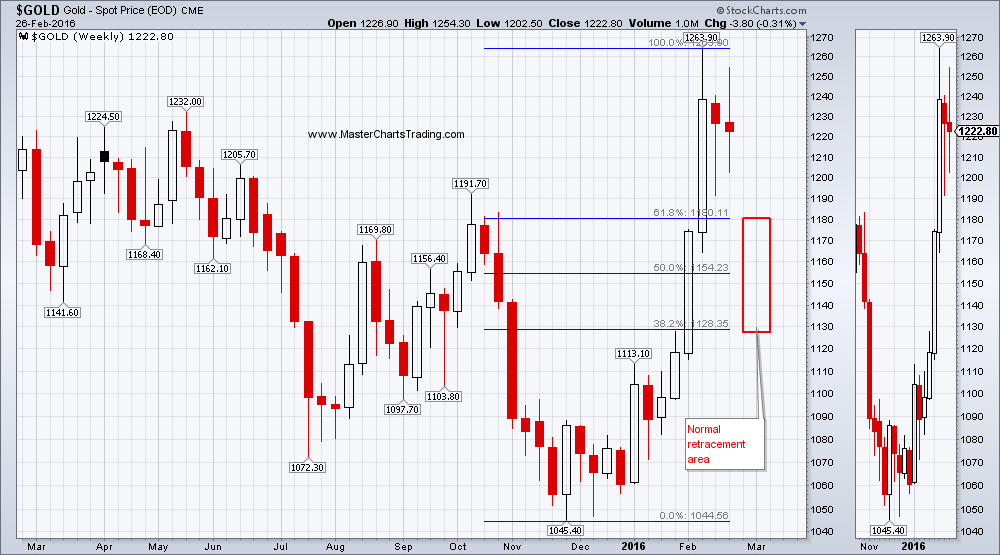
Even if gold did turn long-term bullish, a throwback to the breakout area around 1190 or even lower is almost a guarantee. An even more bearish scenario could see gold reverse and collapse to new multi-year lows.
LONG-TERM CHART OF GOLD
Even if gold did turn long-term bullish, a throwback to the breakout area around 1190 or even lower is almost a guarantee. An even more bearish scenario could see gold reverse and collapse to new multi-year lows.
LONG-TERM CHART OF GOLD
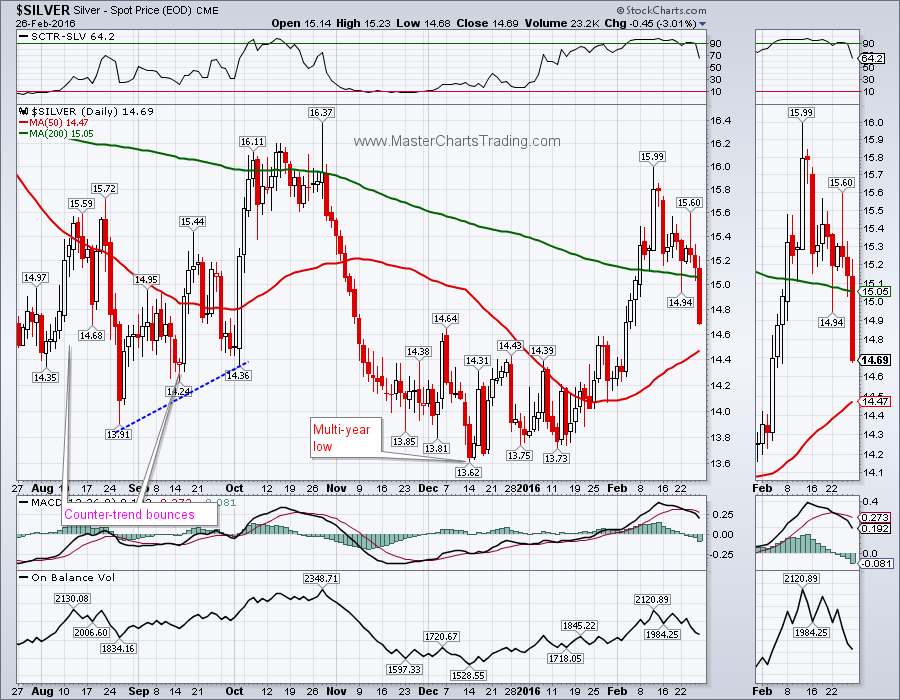
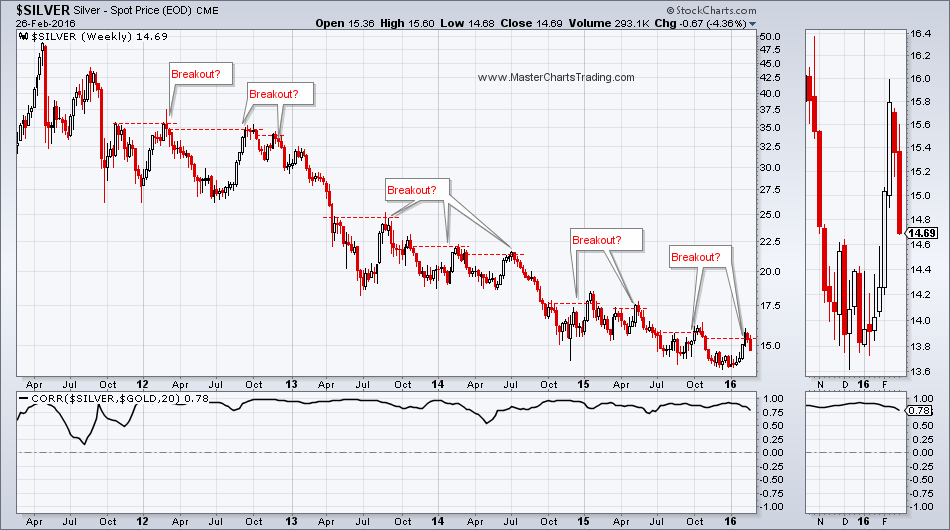
Interestingly, silver, which has been rallying together with gold, has collapsed below the last week’s low and is already retesting its breakout. The long-term chart of silver correlates extremely closely to gold. I wonder if silver is the canary in the coalmine and gold is now going to follow in silver’s footsteps lower.
CHART OF SILVER
LONG-TERM CHART OF SILVER
CHART OF SILVER
LONG-TERM CHART OF SILVER
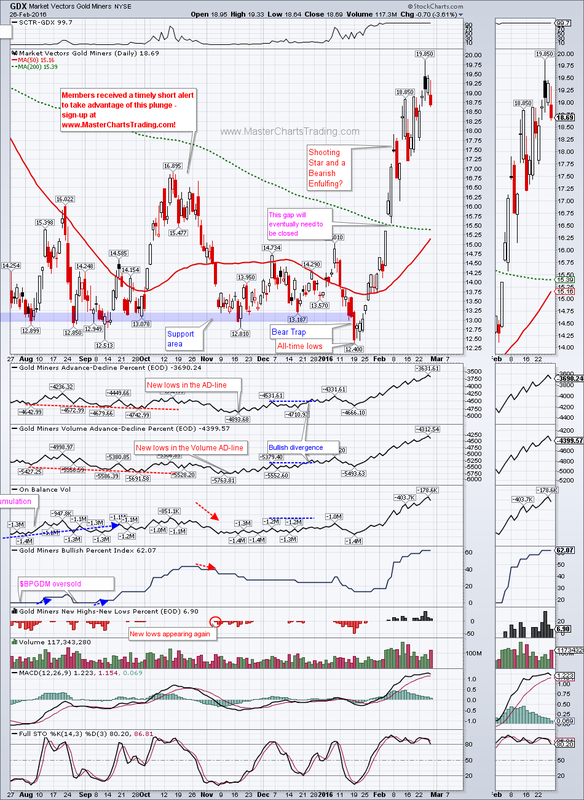
GDX rallied big together with gold. Again, as of the writing of this post, I am still treating this rally in GDX as a bear-market rally. This could change at any time should the GBI turn bullish, but it hasn’t done so yet. Should gold reverse; we could see a pandemonium out of GDX as traders unwind their long positions. At the very least GDX could retest its breakout by falling to around $17.
CHART OF GDX
CHART OF GDX
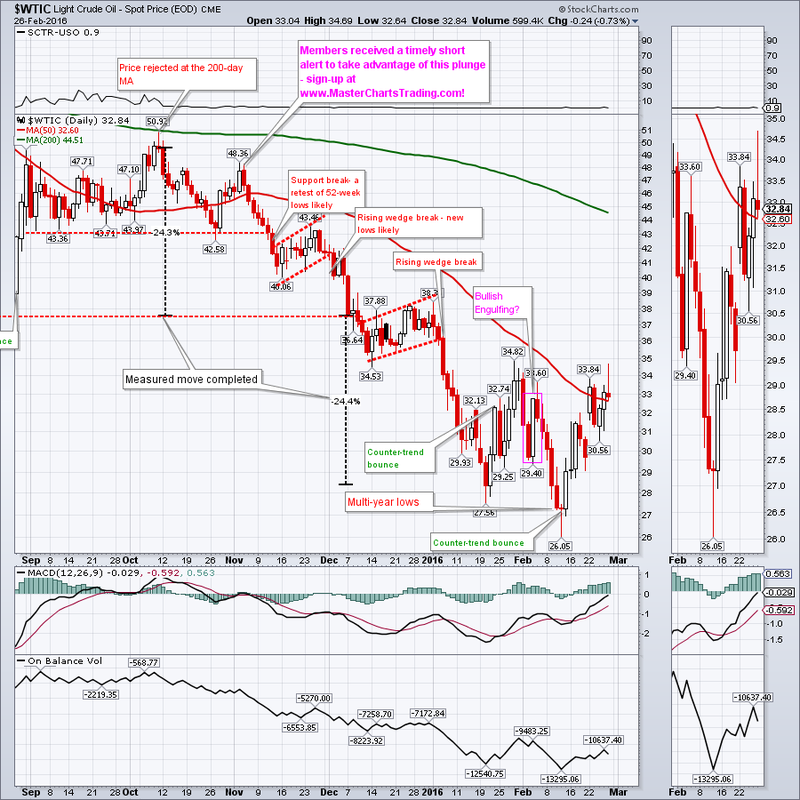
Oil ($WTIC) was finally able to close above the 50-day moving average this week – an achievement it hasn’t done since November of last year. Next logical resistance level is around $36. A failure there would mean another retest of multi-year lows. Should oil break above that resistance level, there is more resistance around $40-$42. Should that area give, oil could rally higher, but long-term oil is bearish, and I simply don’t see it going above the $50 mark anytime soon.
CHART OF $WTIC
CHART OF $WTIC
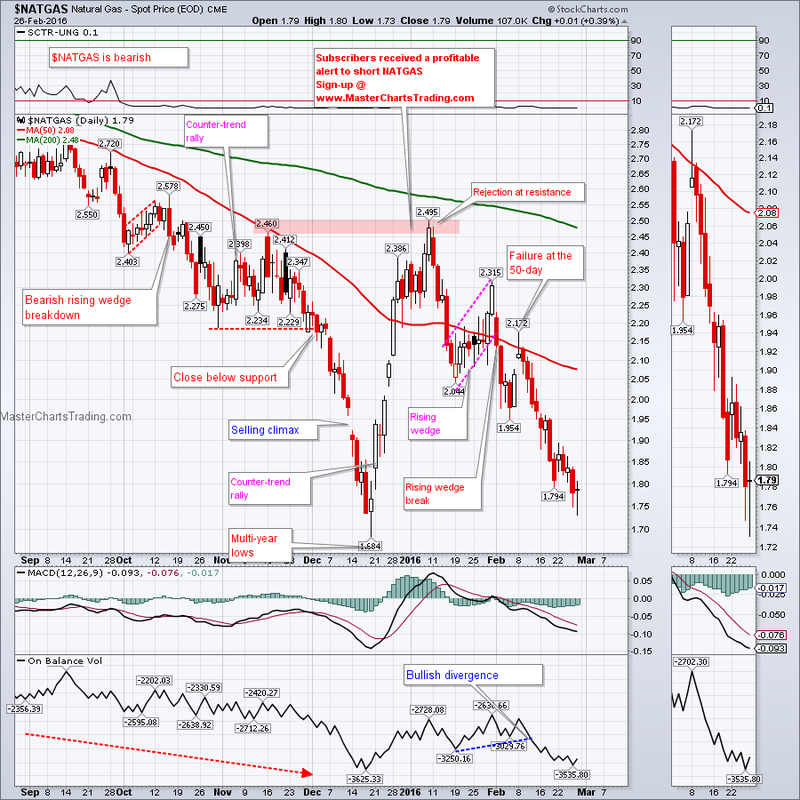
NATGAS had another bad week and is now in the process of retesting its multi-year lows set in December of last year. If the possible support in the $1.70 area holds, we may see NATGAS bounce again. An alternative scenario is a set of fresh multi-year lows.
CHART OF NATGAS
CHART OF NATGAS
Trade Alerts Service is now live – please sign-up here!
That’s it for this week’s market recap,
Best Regards and have another great trading week!
Alexander Berger (www.MasterChartsTrading.com)
That’s it for this week’s market recap,
Best Regards and have another great trading week!
Alexander Berger (www.MasterChartsTrading.com)


 RSS Feed