|
The rally off of the September lows surprised many market observers, myself included. As we get closer and closer to the all-time highs, is my bearish posture still warranted or not? Let us examine the bulk of evidence.
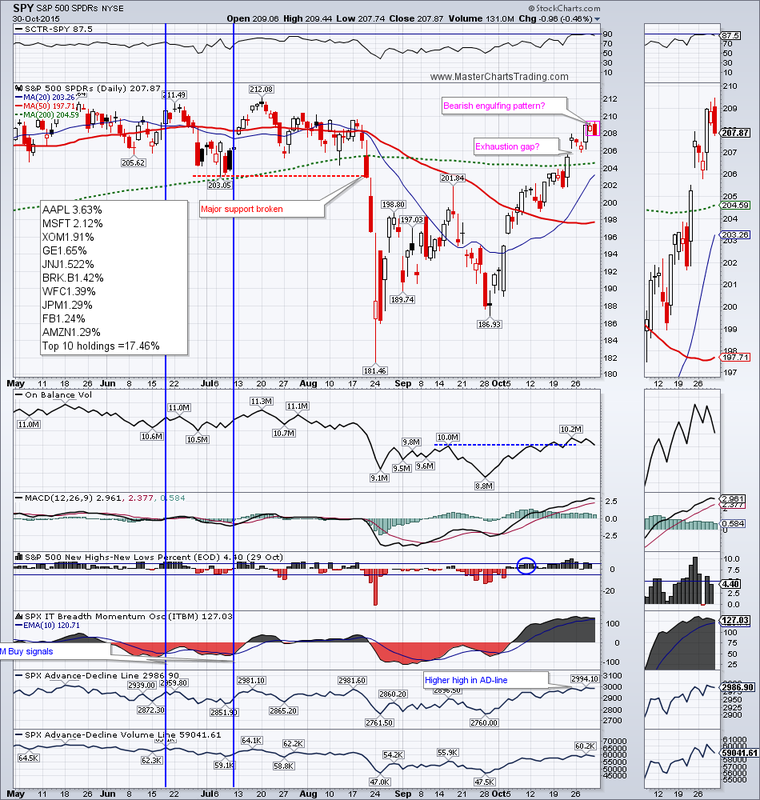
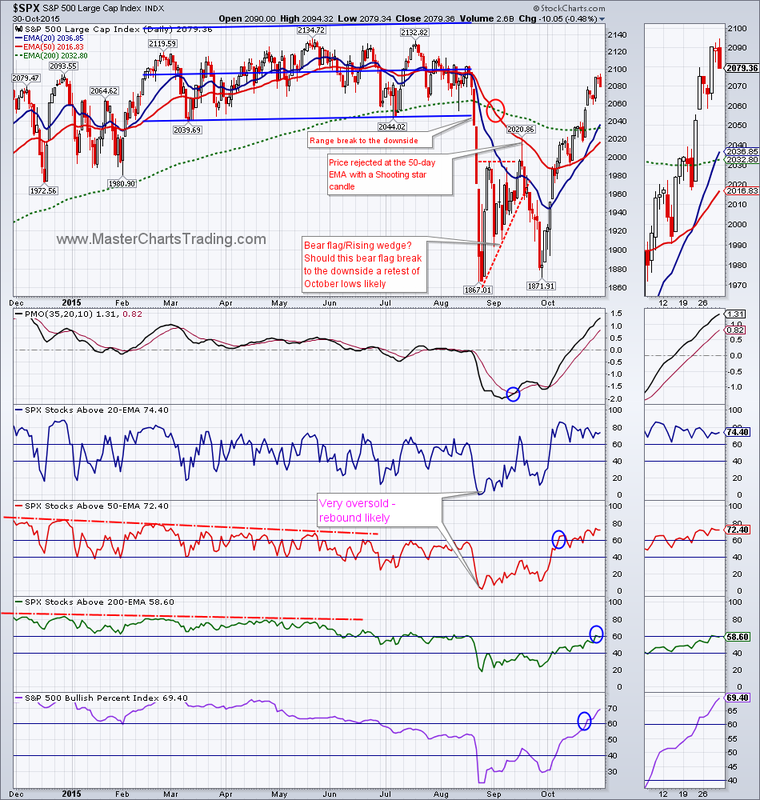
Trend indicators are still firmly in the bearish camp. If you look at the 50-day moving average, you will notice that it is still below the 200-day moving average. The same goes for 50-day and the 200-day exponential moving averages. These facts alone are enough to set a bearish bias. But as I will show, there are quite a bit of false signals with this system. Charts for SPY and $SPX |
|
New highs-new lows indicator for $SPX has pushed above the 5% threshold – it is a positive sign. Percent of stocks above the 50 and the 200-day exponential moving averages also are now in the bullish camps with closes above the 60 percent. Even the bullish percent index for the $SPX was able the clear the 60% mark – pretty amazing feat since just a few month ago it was hovering around 20!
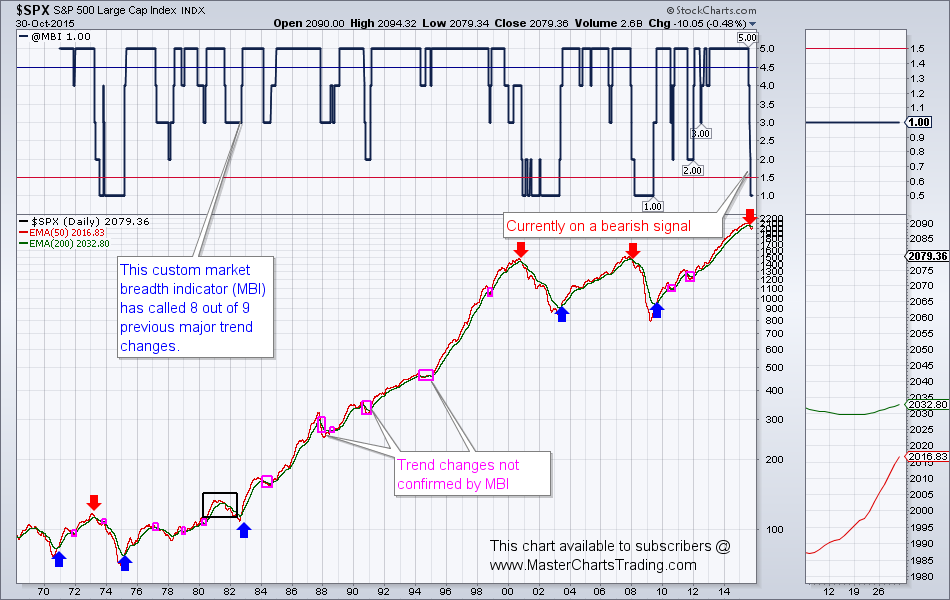
This chart available to subscribers at www.MasterChartsTrading.com
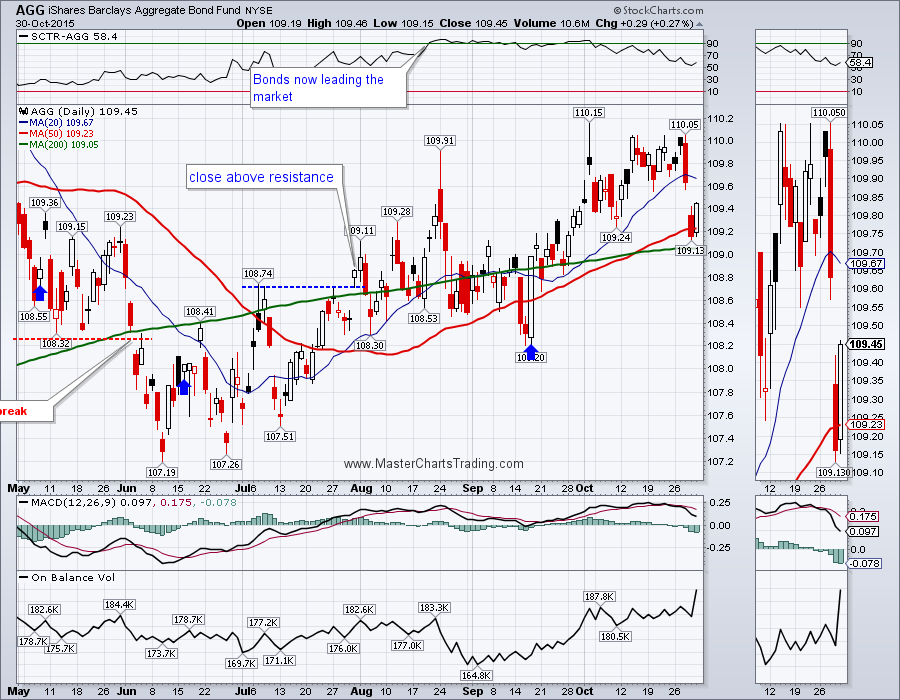
Chart of AGG
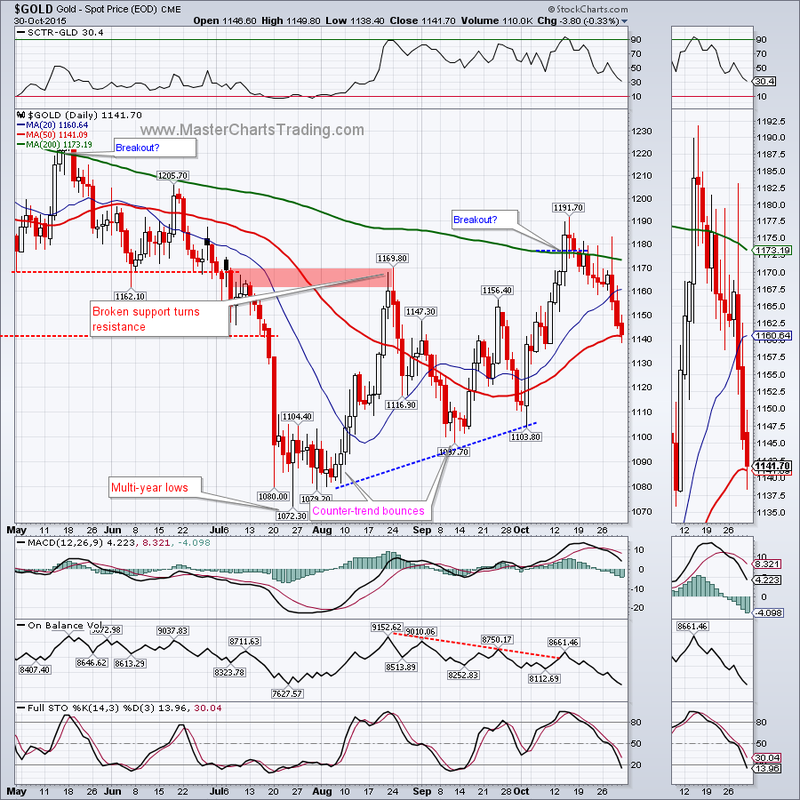
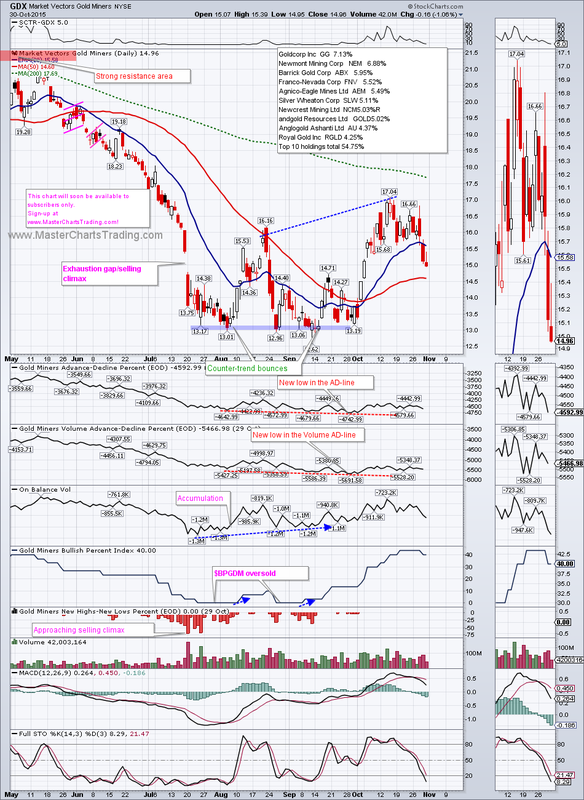
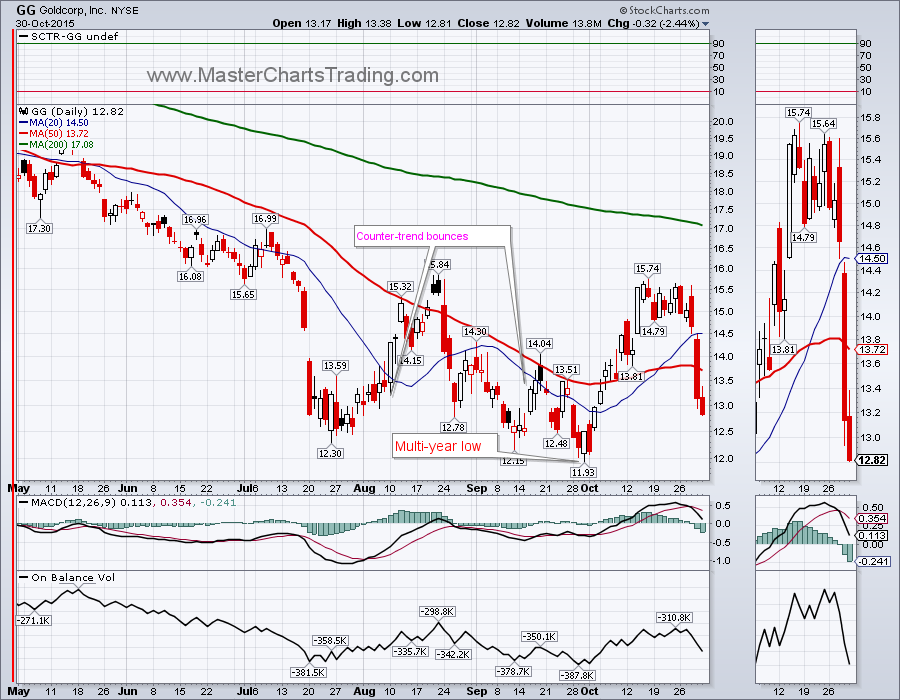
From its peak in mid-October, gold is down around 4.5%, for the same time period GDX is down a bit over 12%. (GoldCorp, ticker GG, is down over 19% for the same period). The internals for GDX are still somewhat mixed, but seem to be rolling over to the downside. The bullish percent index is down to 40% from its peak at 43. The AD-lines for GDX continue to trend lower. Now the On-balance volume seems to be breaking its uptrend as well. There is some decent support at $14.50, but should that give we can see another retest of the $13 area.
Gold, precious metals and miners charts
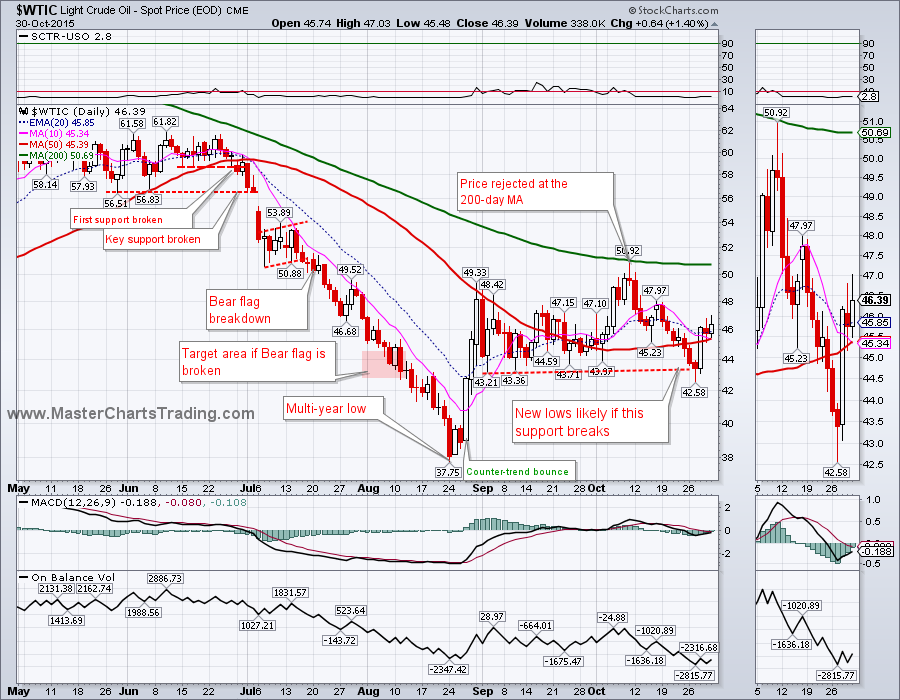
Chart of oil
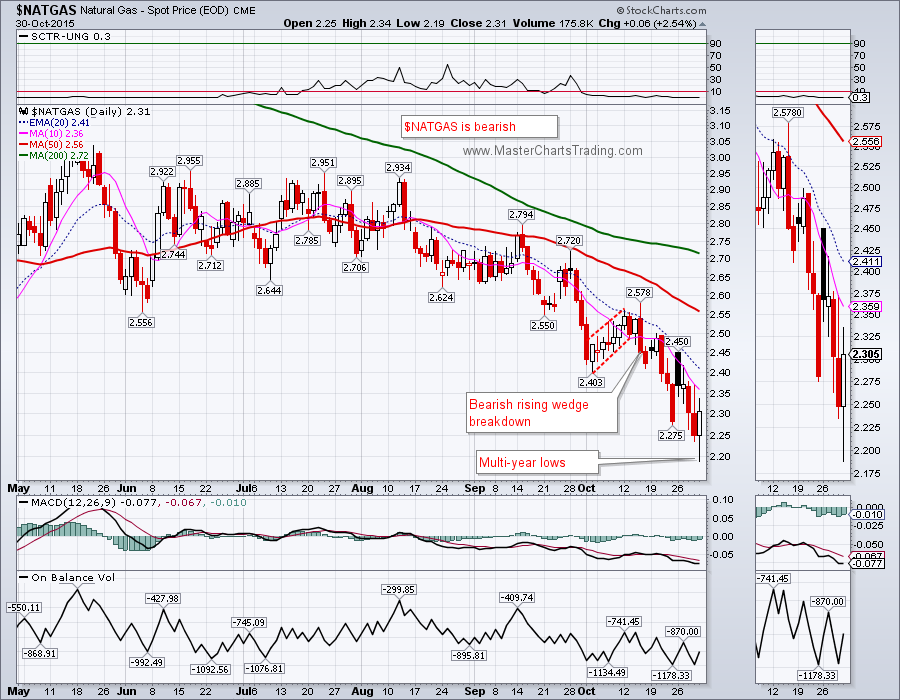
Chart of natural gas
Best Regards and have another great trading week!
Alexander Berger (www.MasterChartsTrading.com)


 RSS Feed