|
In trend-following strategies, such as the one I adhere to, you have to have a bullish or bearish bias. Is the stock you are trading in a long-term uptrend, or a long-term downtrend? If in an uptrend, it makes sense to look for oversold conditions and time your entries on the long side. Vice versa: if you stock is in a long-term downtrend, it makes sense to short the rallies.
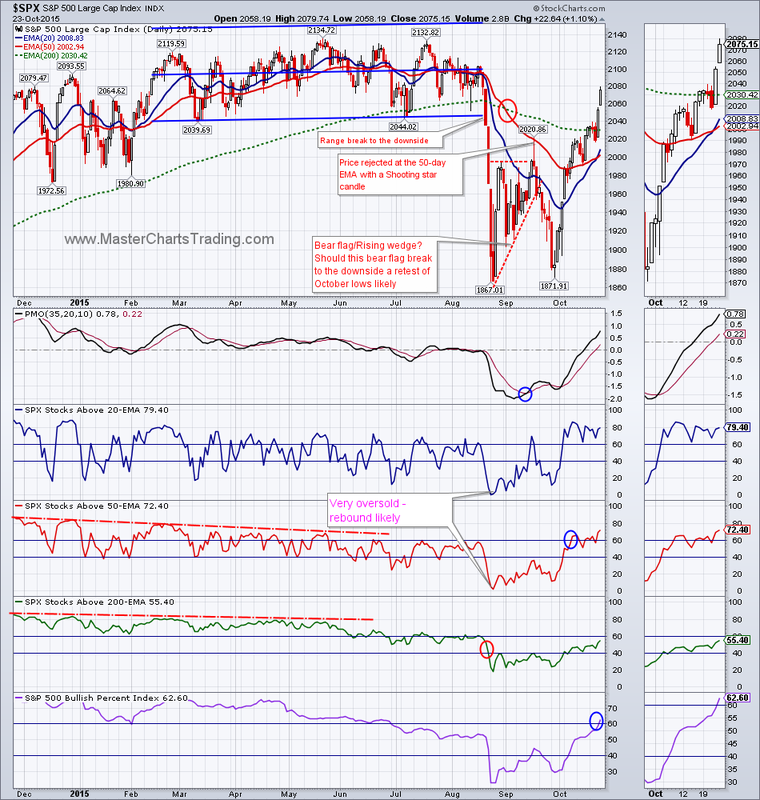
Charts of SPY and SPX |
|
Stocks broke down in August. As a result of this breakdown and further weakness in September, all of the indicators that I follow including those of the momentum, trend and breadth varieties turned decidedly bearish. This changed my bias from bullish to bearish. Although we had a strong rally off the September lows, and many of the market breadth indicators have indeed improved, the question is: what would it take to reverse my current bearish conviction and turn it bullish again?
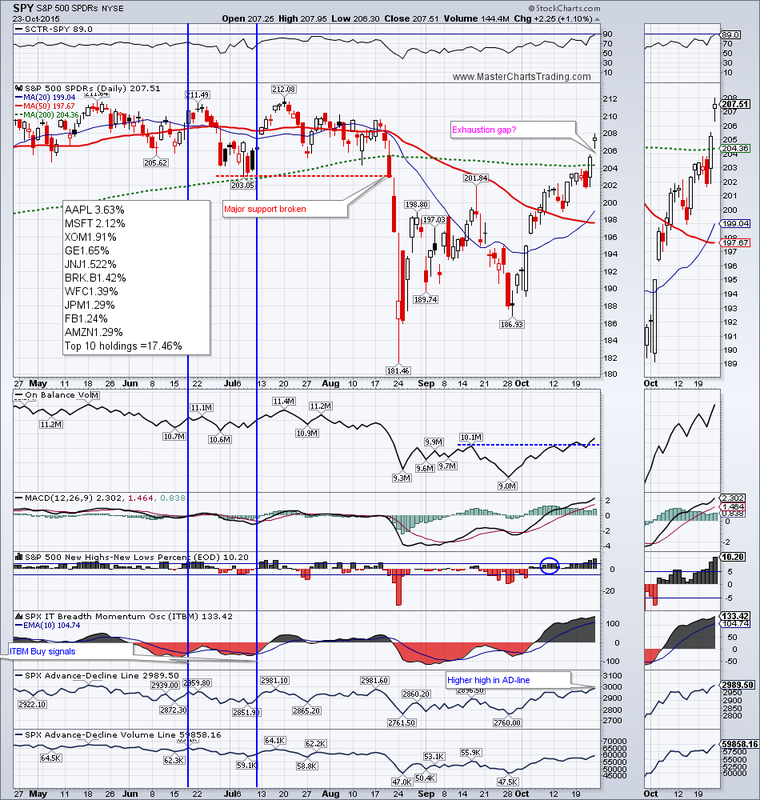
What about the market breadth? Market breadth has indeed improved as more stocks are now above their 200-day exponential moving average (EMA) and the Bullish Percent indices for $SPX and QQQ are again above the 60% bullish thresholds. However these breadth indicators are not as reliable as some of the other once I use.
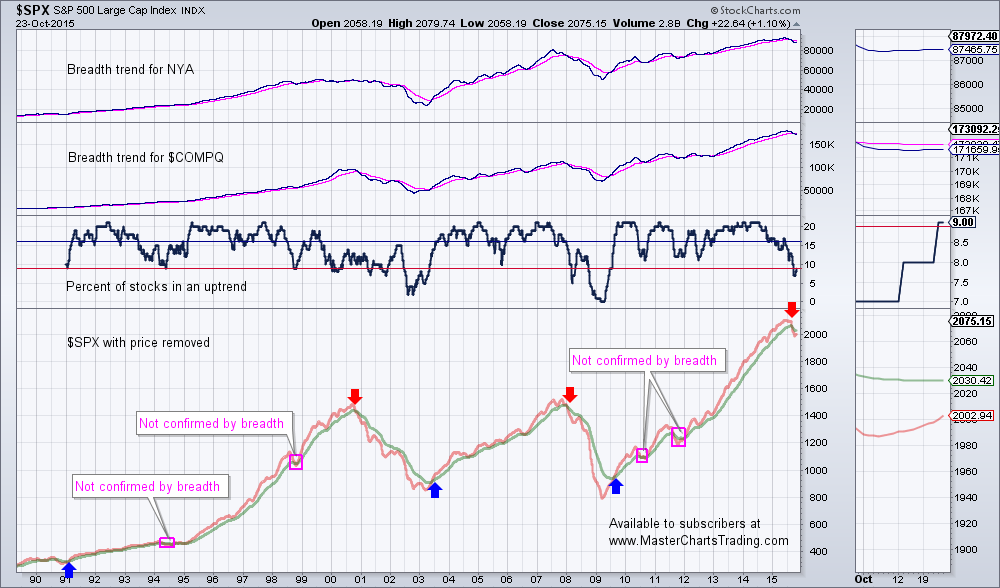
Below is a long-term daily chart of the S&P 500 ($SPX) going back all the way to 1990. During the past 25 years we had 3 bull markets and 2 bear markets. These are marked by up blue arrows and down red arrows, respectively. My 3 favorite indicators are the Breadth Trend for $NYA, Breadth Trend for $COMPQ and a third indicator that I created myself that I call – Percent of Stocks in an Uptrend. Notice that If I used only the moving average crossovers on the price chart of $SPX itself, I would have experienced 4 false signals (they are marked by pink squares). However, by using the breadth to confirm or deny my bias, as provided by moving average crossovers, I would have been able to avoid these false signals. Notice that currently breadth is confirming the signal provided by the moving average crossover and this bearish signal is yet to be negated.
Below is a long-term daily chart of the S&P 500 ($SPX) going back all the way to 1990. During the past 25 years we had 3 bull markets and 2 bear markets. These are marked by up blue arrows and down red arrows, respectively. My 3 favorite indicators are the Breadth Trend for $NYA, Breadth Trend for $COMPQ and a third indicator that I created myself that I call – Percent of Stocks in an Uptrend. Notice that If I used only the moving average crossovers on the price chart of $SPX itself, I would have experienced 4 false signals (they are marked by pink squares). However, by using the breadth to confirm or deny my bias, as provided by moving average crossovers, I would have been able to avoid these false signals. Notice that currently breadth is confirming the signal provided by the moving average crossover and this bearish signal is yet to be negated.
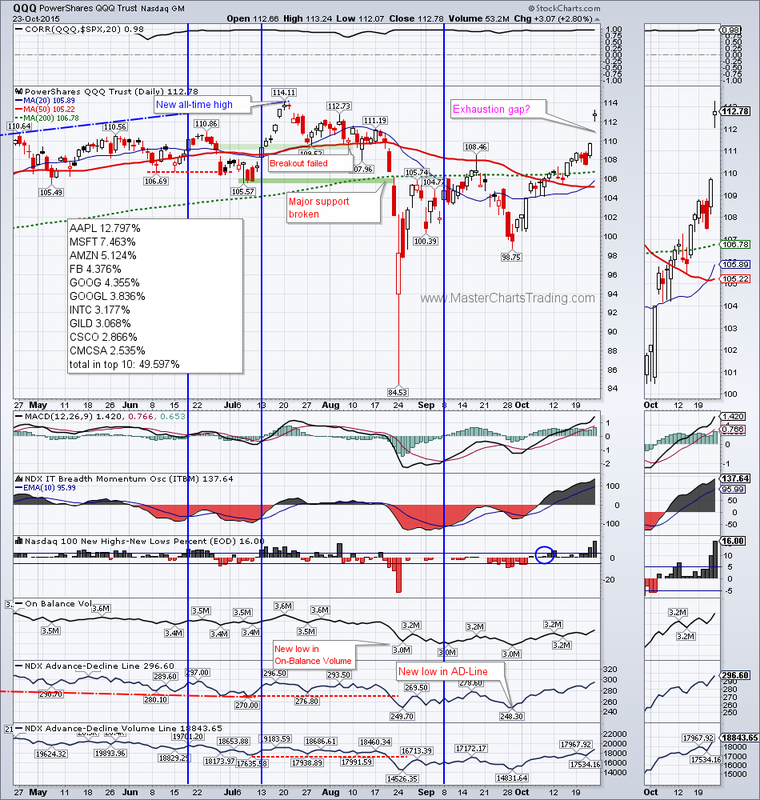
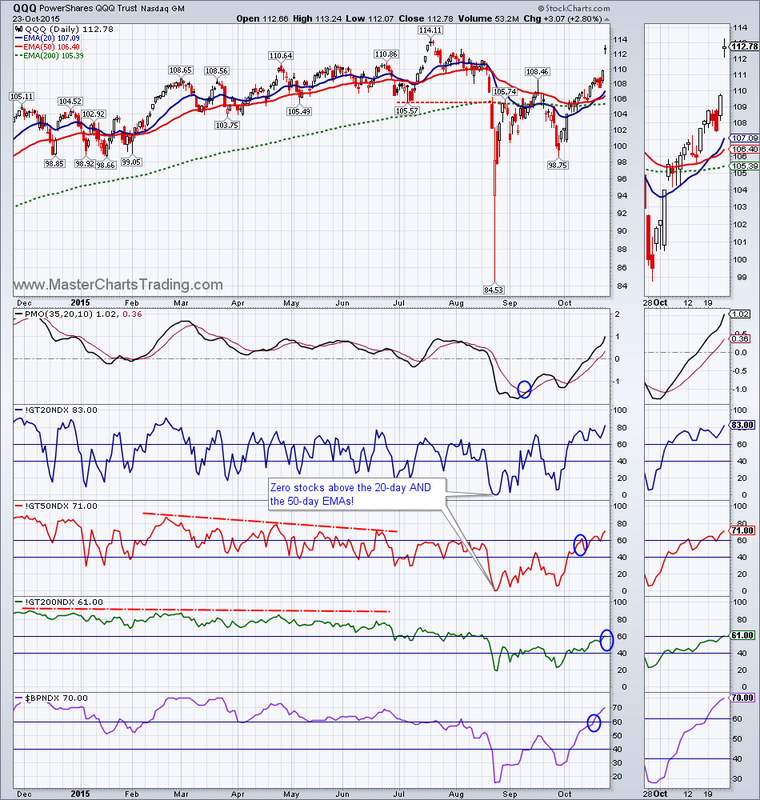
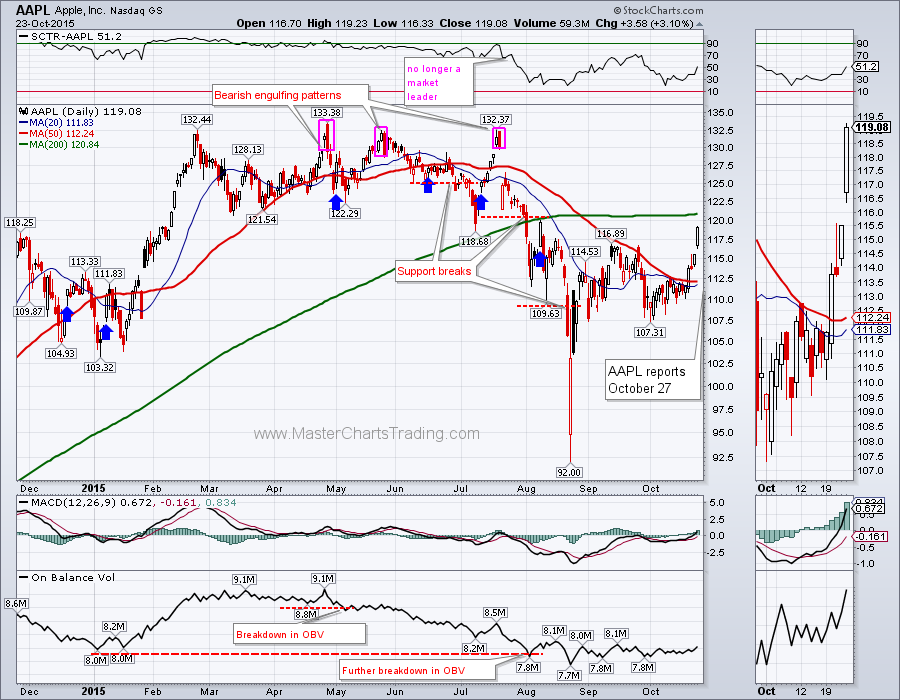
Moving on to the higher beta QQQ. On Friday QQQ gapped up on the heels of positive reports from several large-cap technology companies and closed within 1.5% of its all-time high. As you may have heard me say in the past – stocks are highly correlated. So my previous comments about the general market still liable to a correcting action apply to QQQ. Apple accounts for over 12% of QQQ holdings and reports on October 27. Could this be the classic buy the rumor, sell the news setup?
Charts of QQQ (scroll down) and AAPL
Charts of QQQ (scroll down) and AAPL
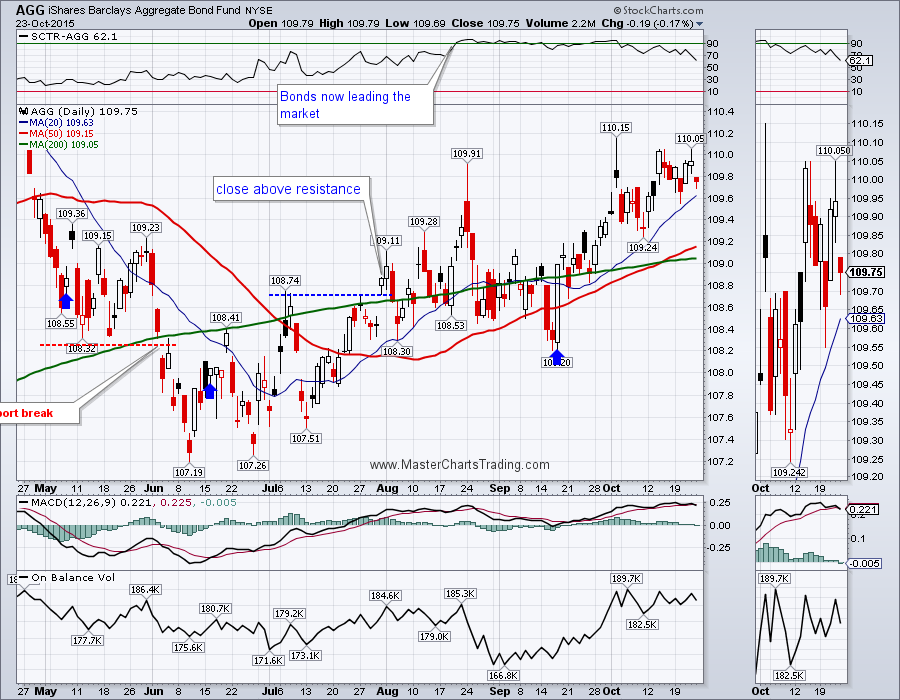
General bonds (AGG) were literally unmoved by all the excitement of the stock market. AGG was basically unchanged for the week (down 0.02%). Why would bonds be holding up so well, if stocks were nearing all-time highs again? Usually this indicates that a healthy amount of fear is still present in the markets.
Chart of AGG
Chart of AGG
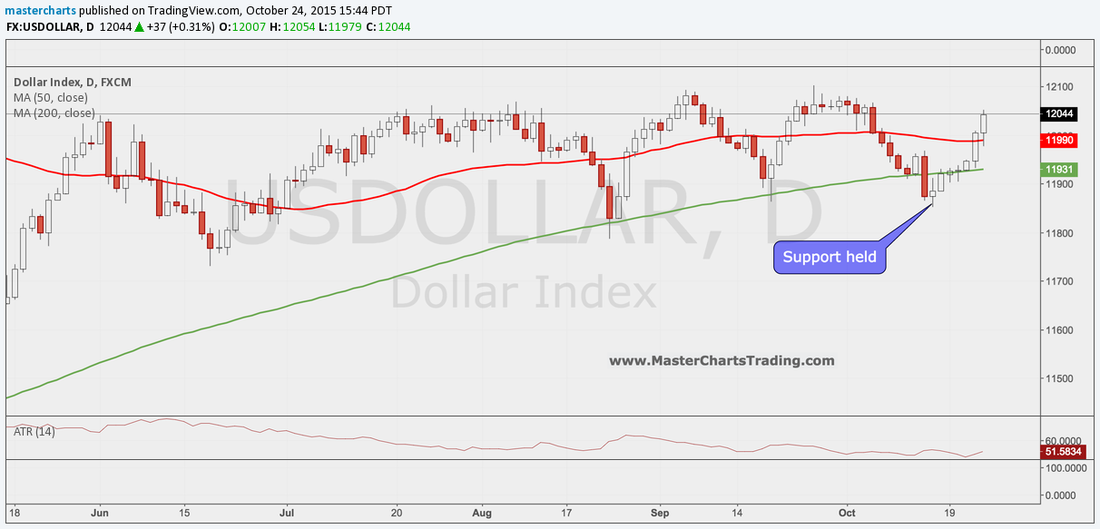
Last week I mentioned that the dollar may have held support, this week we saw a strong rally in the dollar. The dollar is not yet overbought, so we could easily see a breakout above the recent highs.
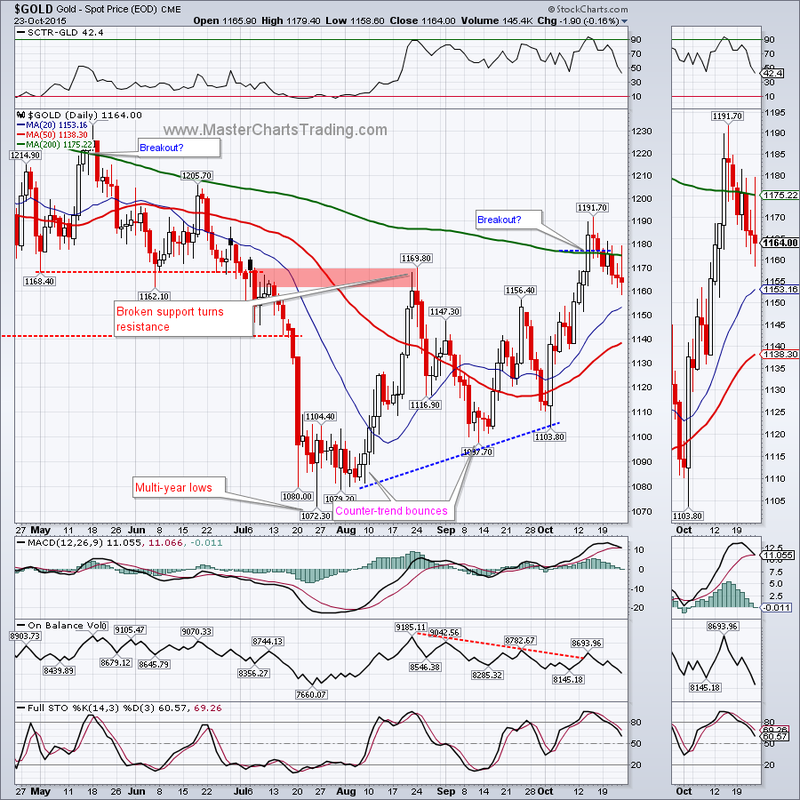
Strength in the dollar is again putting pressure on commodities. On October 14, gold broke above the 200-day moving average for the first time since May of this year. Since then gold was sliding down and is currently in the process of retesting the resistance level (now turned support). Should this support around $1160 give, we could easily see a pullback to the $1100 area, or even lower.
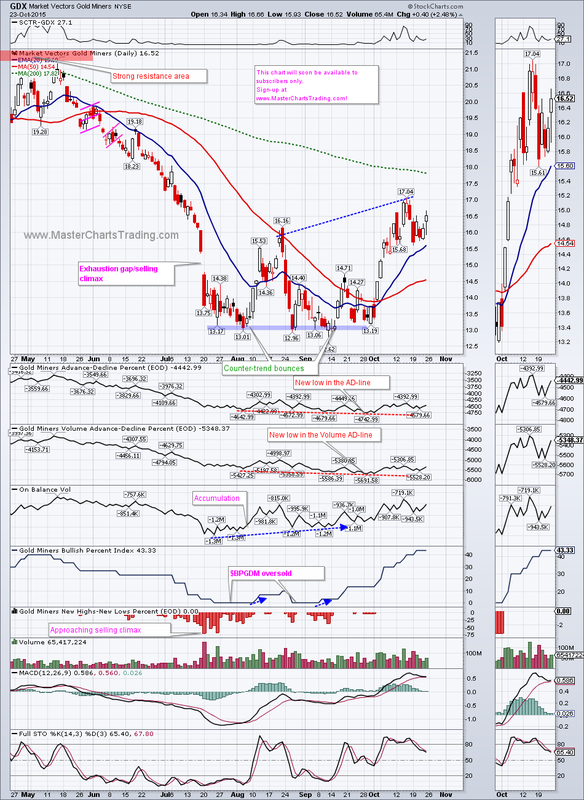
GDX was choppy and volatile, as various market forces pulled the gold miners up or down. The Chinese rate cut is bullish for gold, while strong dollar is bearish. GDX along with gold is long-term bearish and currently overbought – a recipe for a drop lower.
Charts of gold, gold miners and precious metals
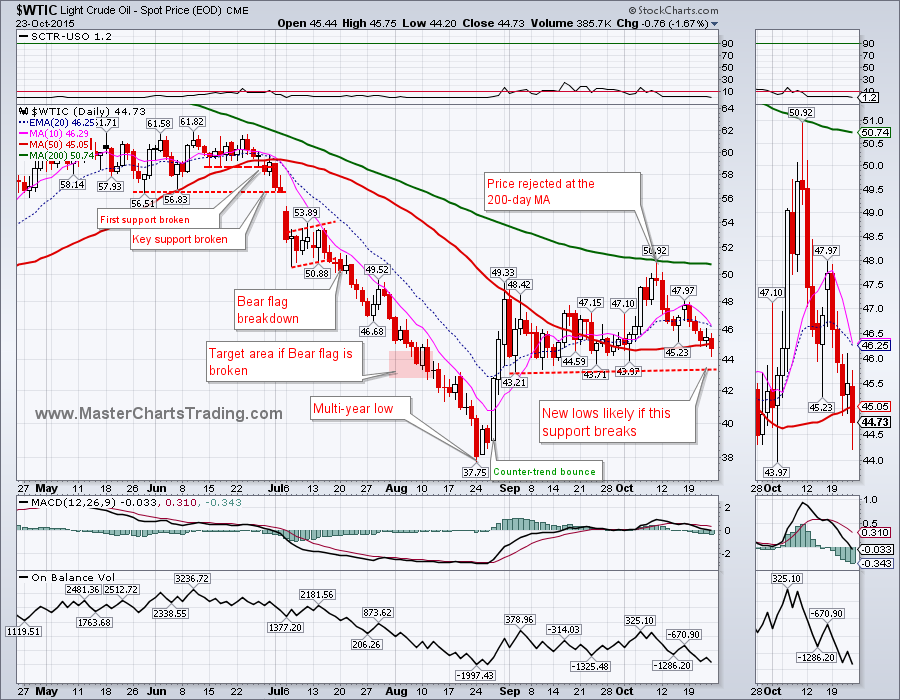
Strong dollar is not helping oil ($WTIC) either. Several weeks ago an attempted rally was stopped in its tracks by the 200-day moving average at around $50. Today oil closed below the 50-day moving average again. This is an ominous sign. It seems very likely that a retest of the breakout is at hand. A close below $43 would cause a flood of sell orders to execute and new lows would be likely thereafter.
Chart of oil
Chart of oil
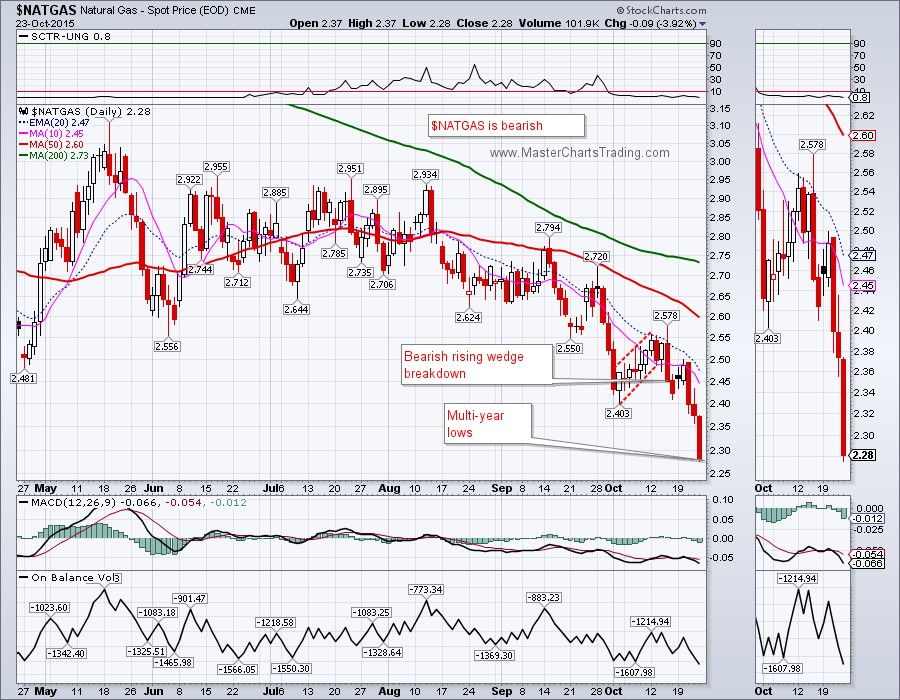
Several weeks ago I pointed out a bear wedge on the chart of natural gas ($NATGAS). We had a clear breakdown of that wedge last week, a small rebound and another plunge – to new multi-year lows. Multi-year lows are very bearish. However, a rebound of some sort is now likely, since $NATGAS is quite oversold following an over 20% drop since mid-August.
Chart of natural gas
Chart of natural gas
That’s it for this week’s market recap,
Best Regards and have another great trading week!
Alexander Berger (www.MasterChartsTrading.com)
Best Regards and have another great trading week!
Alexander Berger (www.MasterChartsTrading.com)


 RSS Feed