Master Charts Trading - Stock Market Indicators & Trade Alerts
Connect To Us!
  • MasterChartsTrading
  • Blog
  • Sign-Up
  • Members
    • Elite Trading Blog
    • Stock Speculator Blog
    • Training Library >
      • Basics of Trading
      • Risk & Trading Psych
      • Trend Identification
  • Help
    • Hall of Fame
    • Social
    • About Us
    • Contact
    • FAQs
    • Disclaimer
    • Refund Policy
    • Privacy Policy
    • What We Trade
    • Newsletter samples

Friday, November 21, 2014. Weekly Market Recap.

11/23/2014

0 Comments

 
Video link for this presentation
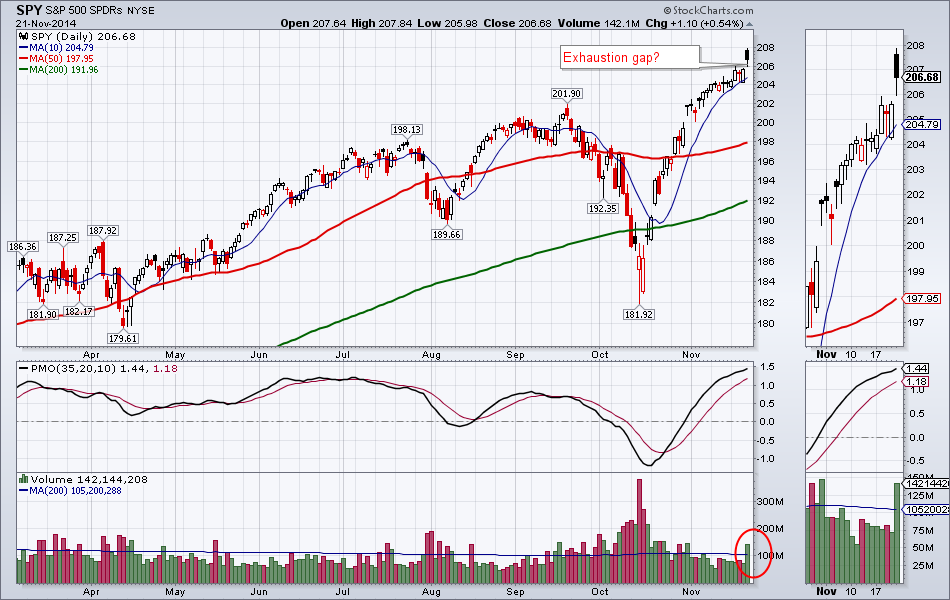
The S&P 500 and other large cap indices continued to make new all-time highs and surprise many analysts (including myself).

         In my view Friday’s action could look like an exhaustion gap. The S&P 500 gapped up at the open and then continued down all day to close near the day’s lows, all this on above average volume. Could it be the beginning of a long-awaited pull back? Only time will tell.

Picture
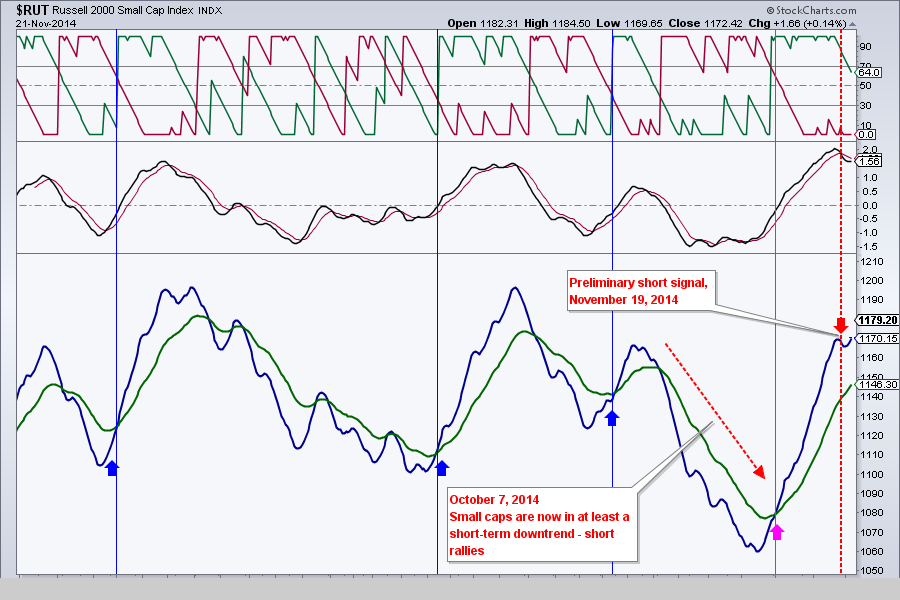
Market breadth for the S&P 500 is still bullish, but as I mentioned before very overbought. The overbought condition can persist for an extended period of time, so I am keeping my SPY position open after taking more profits recently.  The Russell 2000 feels different then the large caps. Our system generated a short signal on November 19 and I opened a very small position in TZA. 
Picture
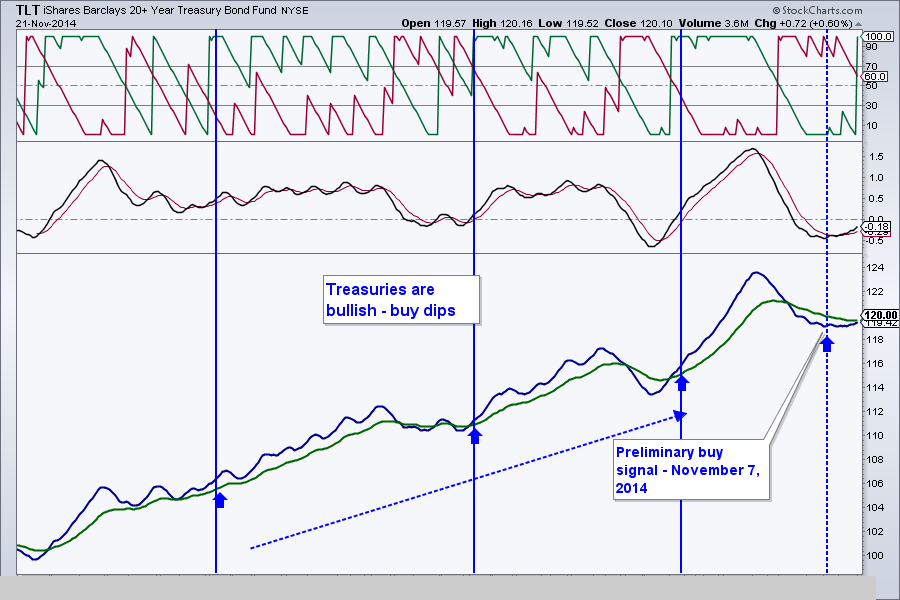
Bonds got a boost on Friday in the face of a surge in stocks. Why would investors be seeking safety of bonds when stocks are making all-time highs? I already have small positions open in AGG and TLT since November 7, but will add to them shortly should the conditions for addition to the position be met.
Picture
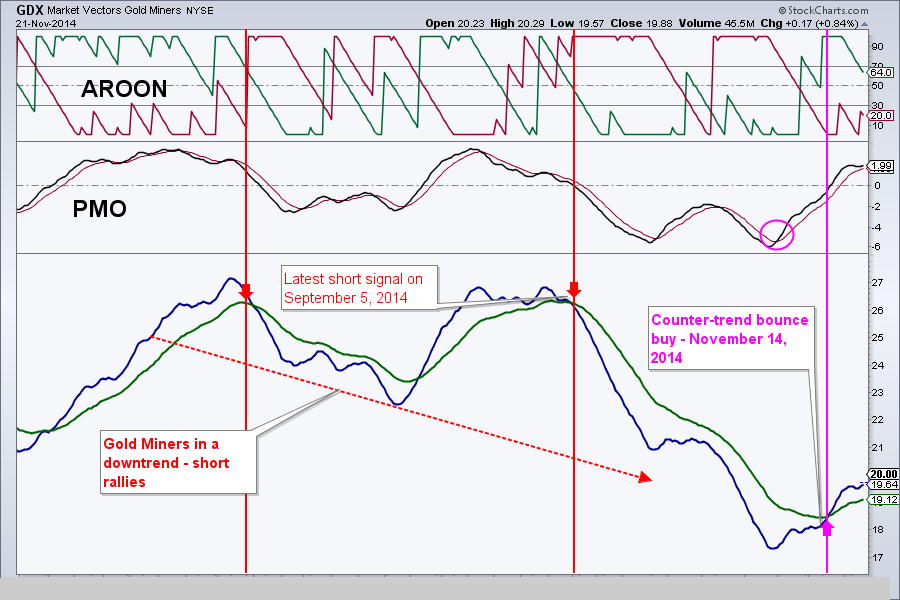
Gold and gold equities continued their bounce from our entry on November 14. We are up about 6% from the entry into this counter-trend bounce. 
Picture
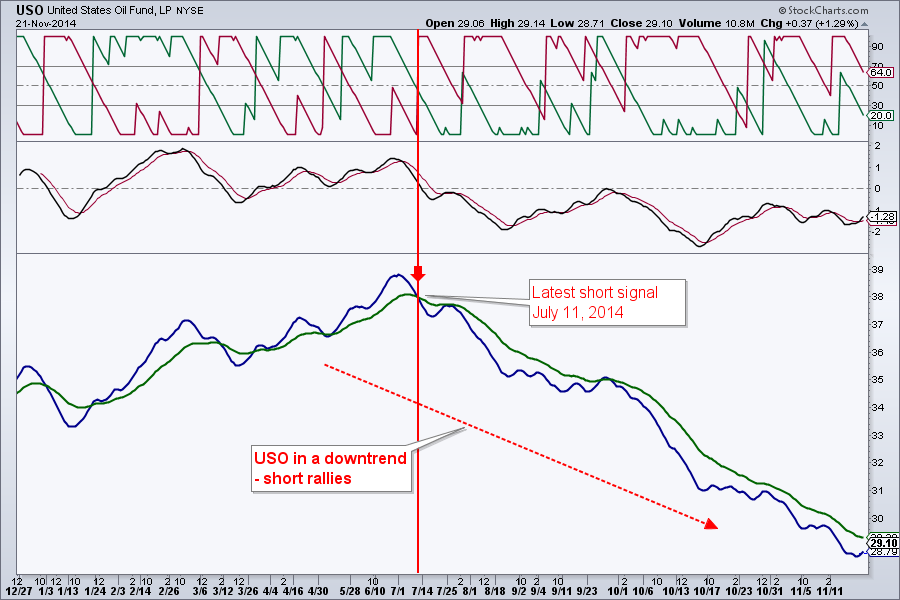
Oil got a little bit of a boost, or at least it may have stopped falling. USO is still in a downtrend and our system did not yet generate a counter-trend bounce signal.

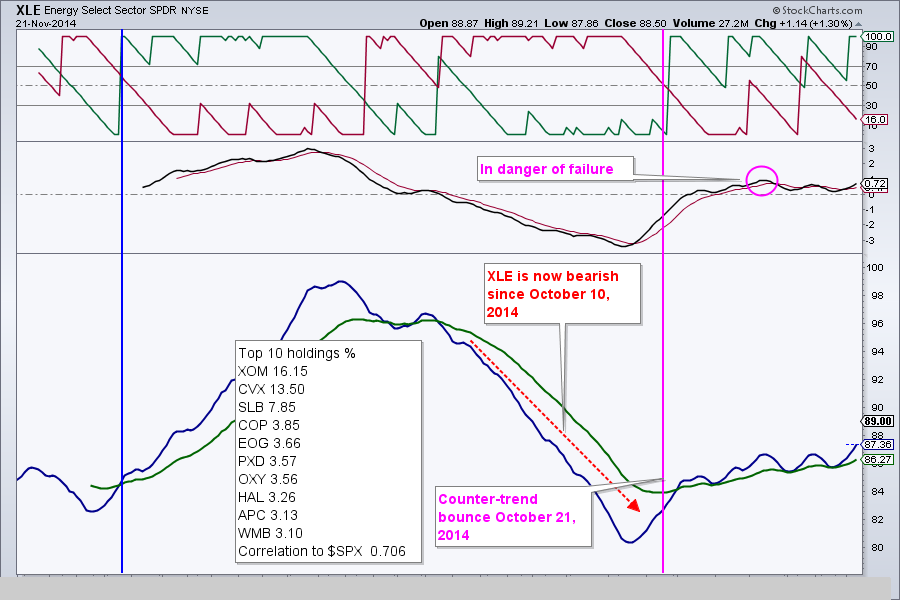
         Oil related equities are holding up OK and continuing up. Should USO flip into buy signal, XLE is likely to benefit.

Picture
Picture
Best Regards and have another great trading week!
Alexander Berger (www.MasterChartsTrading.com)
Disclaimer: we have open positions in SPY (took profits), TZA, AGG, TLT, GDX, and XLE (took profits)
 

Ready to trade? Sign-up Today
0 Comments


Leave a Reply.

    Picture
    Picture

    Subscribe to our mailing list!

    * indicates required
    /* real people should not fill this in and expect good things - do not remove this or risk form bot signups */

    Intuit Mailchimp

    Click to set custom HTML
    Picture
    Picture

    Archives

    January 2025
    December 2024
    November 2024
    October 2024
    September 2024
    August 2024
    July 2024
    June 2024
    May 2024
    April 2024
    March 2024
    February 2024
    January 2024
    December 2023
    November 2023
    October 2023
    September 2023
    August 2023
    July 2023
    June 2023
    May 2023
    April 2023
    March 2023
    February 2023
    January 2023
    December 2022
    November 2022
    October 2022
    September 2022
    August 2022
    July 2022
    June 2022
    May 2022
    April 2022
    March 2022
    February 2022
    January 2022
    December 2021
    November 2021
    October 2021
    September 2021
    August 2021
    July 2021
    June 2021
    May 2021
    April 2021
    March 2021
    February 2021
    January 2021
    December 2020
    November 2020
    October 2020
    September 2020
    August 2020
    July 2020
    June 2020
    May 2020
    April 2020
    March 2020
    February 2020
    January 2020
    December 2019
    November 2019
    October 2019
    September 2019
    August 2019
    July 2019
    June 2019
    May 2019
    April 2019
    March 2019
    February 2019
    January 2019
    December 2018
    November 2018
    October 2018
    September 2018
    August 2018
    July 2018
    June 2018
    May 2018
    April 2018
    March 2018
    February 2018
    January 2018
    December 2017
    November 2017
    October 2017
    September 2017
    August 2017
    July 2017
    June 2017
    May 2017
    April 2017
    March 2017
    February 2017
    January 2017
    December 2016
    November 2016
    October 2016
    September 2016
    August 2016
    July 2016
    June 2016
    May 2016
    April 2016
    March 2016
    February 2016
    January 2016
    December 2015
    November 2015
    October 2015
    September 2015
    August 2015
    July 2015
    June 2015
    May 2015
    April 2015
    March 2015
    February 2015
    January 2015
    December 2014
    November 2014
    October 2014
    September 2014
    August 2014
    June 2014
    May 2014
    April 2014
    March 2014
    February 2014
    January 2014

    RSS Feed

  All information on MasterChartsTrading.com is for educational and entertainment purposes only, and should not be construed as a recommendation to buy, sell or sell-short said securities. Read full disclaimer.