|
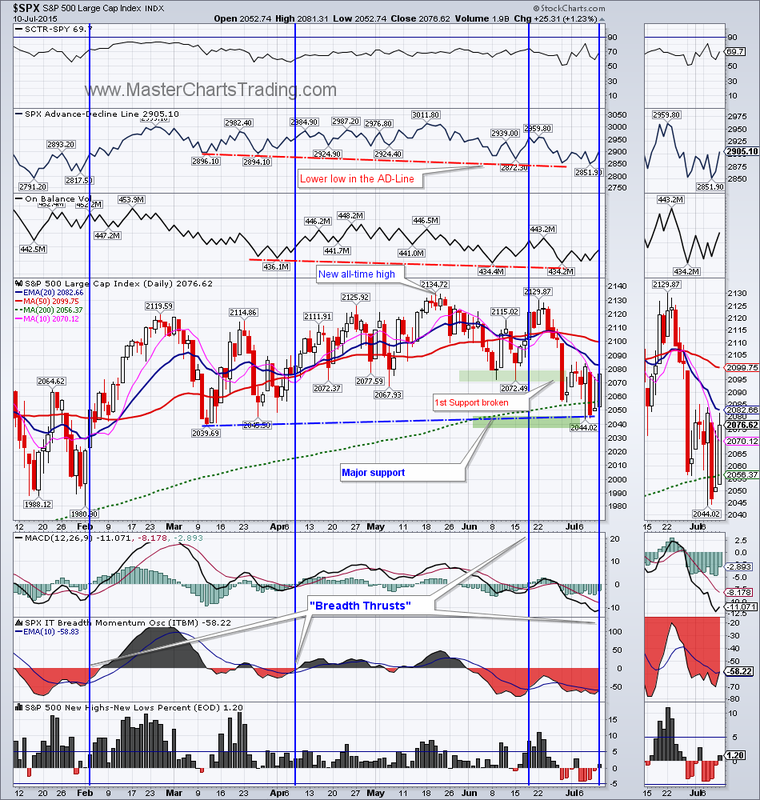
This was indeed a volatile week for the stock markets. On Wednesday the S&P 500 actually closed below its 200-day moving average. The 200-day moving average is a widely watched benchmark - even by the fundamental investors. Many consider a price closing below the 200-day as a sign that a security now entered a bear market. Thursday $SPX tried to rally, but closed near the lows, while Friday was a strong day with a close above the 200-day moving average on a strong candlestick. Few divergences still remain on the charts of $SPX, but I think they have basically “worked off”. $SPX went on our buy signal and breadth momentum for $SPX is on an upswing.
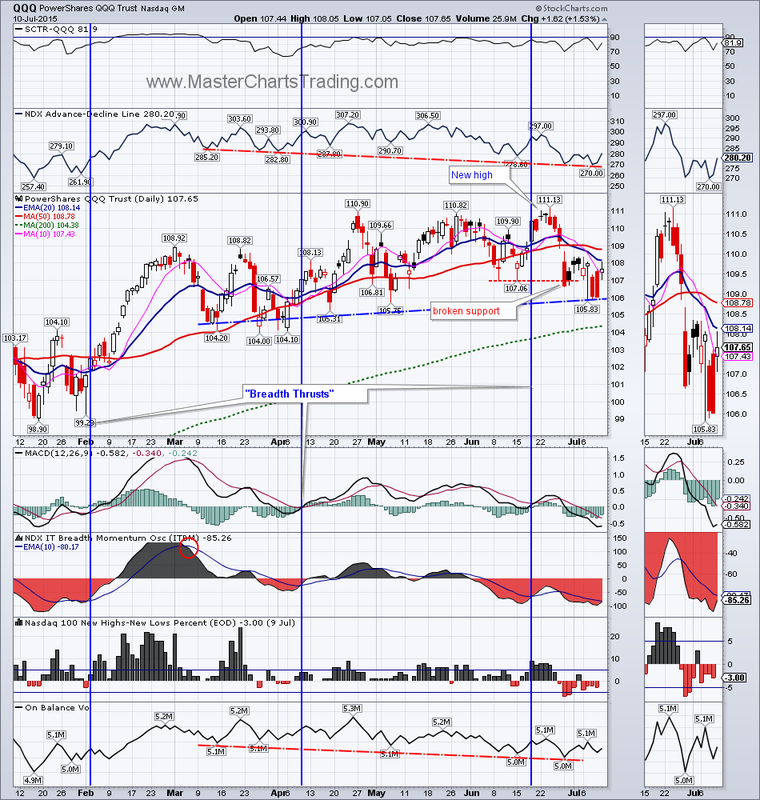
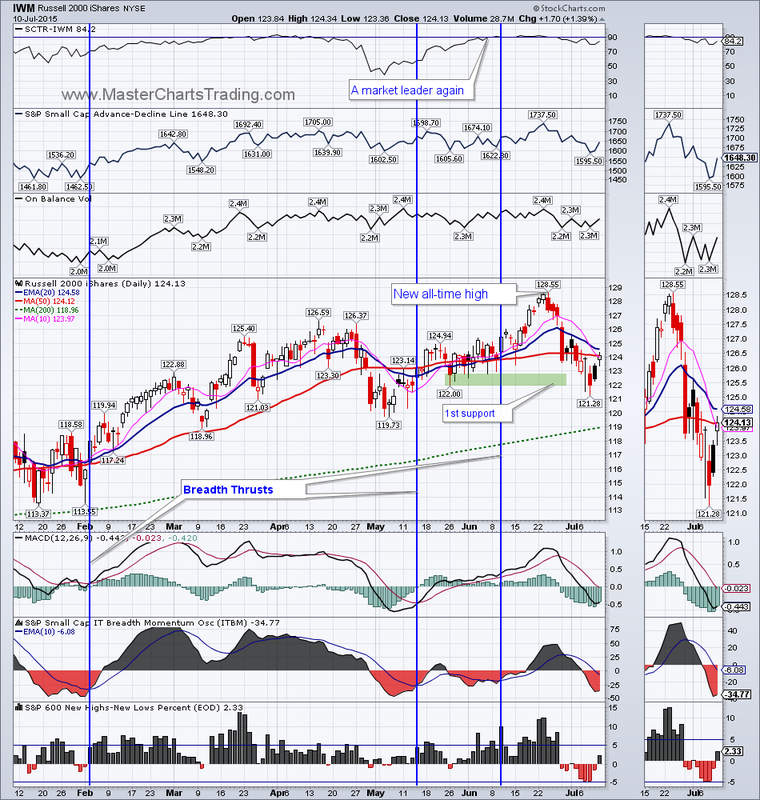
Charts of SPX, QQQ, IWM and their market breadth |
|
Chart of the NASDAQ 100 ETF – QQQ, still has a few divergences on it. As long as Apple holds up, we may see a push to new highs in QQQ, hopefully on better volume (the On Balance volume (OBV) indicator for QQQ is still lagging somewhat.)
I think the best opportunities in the market right now are in the small cap universe. The charts of IWM have the least divergences. Unlike its large-cap brethren, IWM did not even break its first support by holding above the $122 level on closing basis.
I think the best opportunities in the market right now are in the small cap universe. The charts of IWM have the least divergences. Unlike its large-cap brethren, IWM did not even break its first support by holding above the $122 level on closing basis.
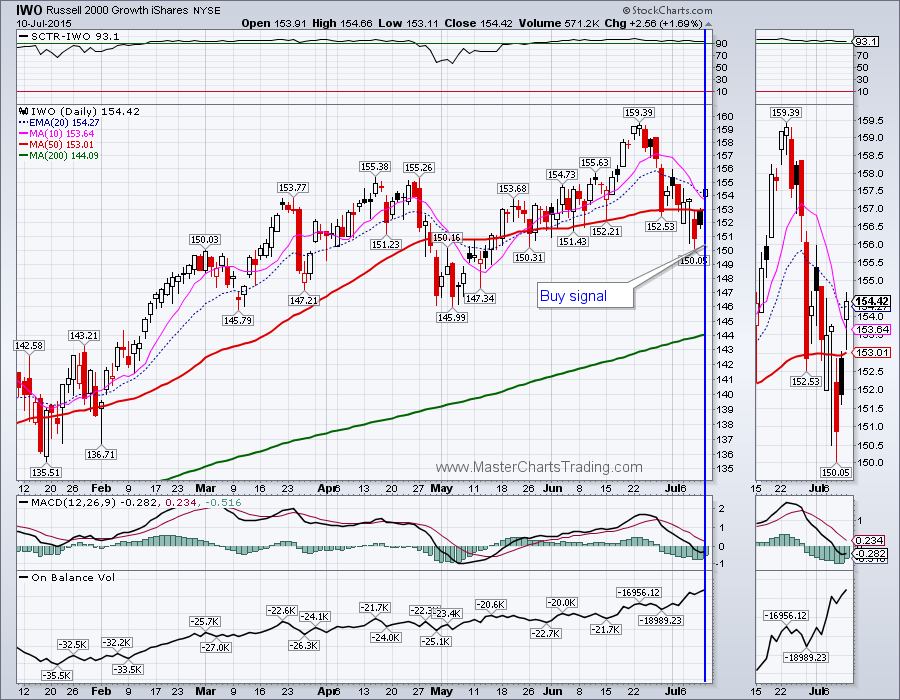
IWO – the small cap growth ETF – also went on our buy signal today. IWO is more volatile then IWM, so both the potential gain and the possibility of loss are amplified. Should some sort of a resolution be reached regarding Greece, I think we may easily see new highs for IWO.
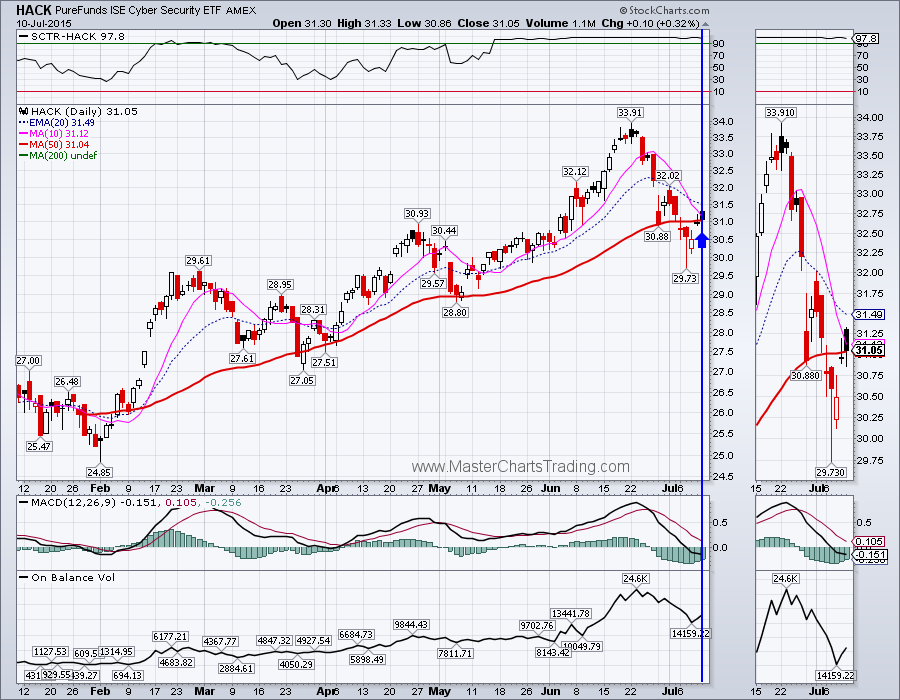
Another high momentum opportunities of the market still remain in cyber security. HACK, the cyber security ETF, hit new all-time highs just a few weeks ago and corrected steeply. Yet its relative rank remained very strong. I think it found support in the $29.70 area and now rebounded. HACK also went on our buy signal today.
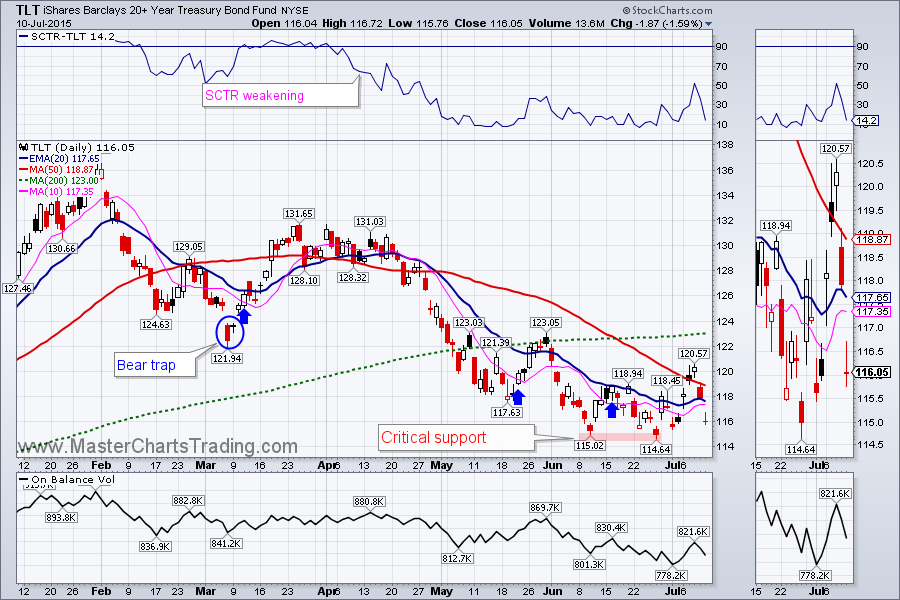
Bonds gained during the beginning of the week, but sold-off sharply on Thursday and Friday, as the Greek crisis seemed nearer to a resolution. Bonds are considered safe-haven in times of market uncertainty. TLT is again near its critical support. Should the $114.64 level give, I think TLT will officially enter a bear market. TLT may provide a good hedge, should the Greece fiasco continues unresolved or Grexit materializes.
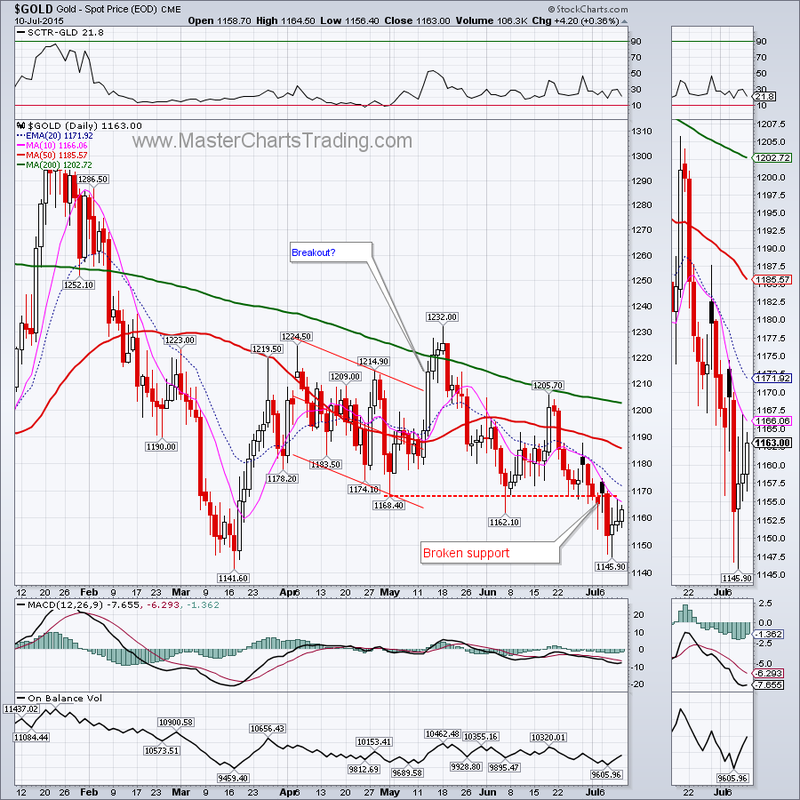
Gold just can’t catch a bid. This week gold again slid a fraction of a percent. This marks a third week in a row that gold has been sliding. Most importantly I think is the fact that on Tuesday gold decisively broke the May and June supports by closing at $1153.70. Next stop for gold is March low at $1141.60. Could the new 52-week lows be in the cards for gold?
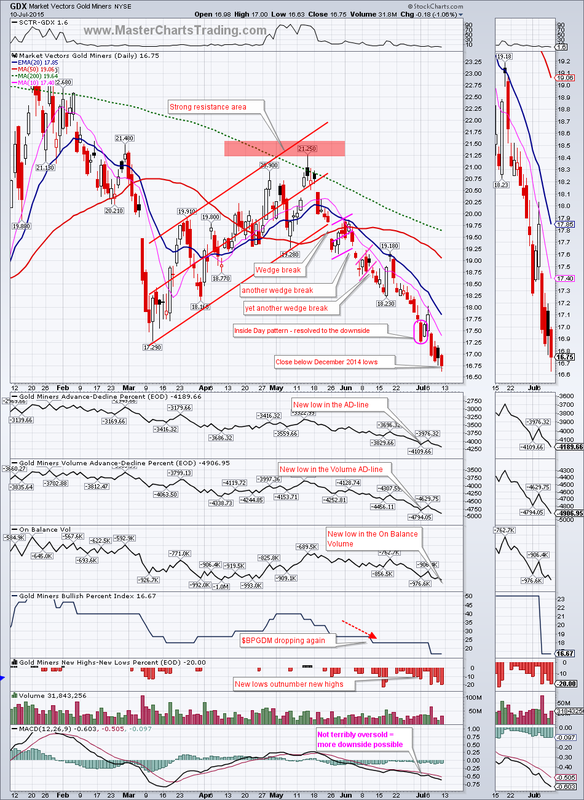
If gold had a bad week, GDX had an even worse week. GDX already broke below its March and December lows and is now threatening to retest its 52-week lows from November. I see very little signs of buying pressure in GDX: new lows outnumber new highs, Bullish percent index is only at 16%, there were new very recently registered in the On Balance volume, AD-line and the AD-Volume lines. GDX is bearish and to me it makes more sense to short rallies rather then try to pick bottoms.
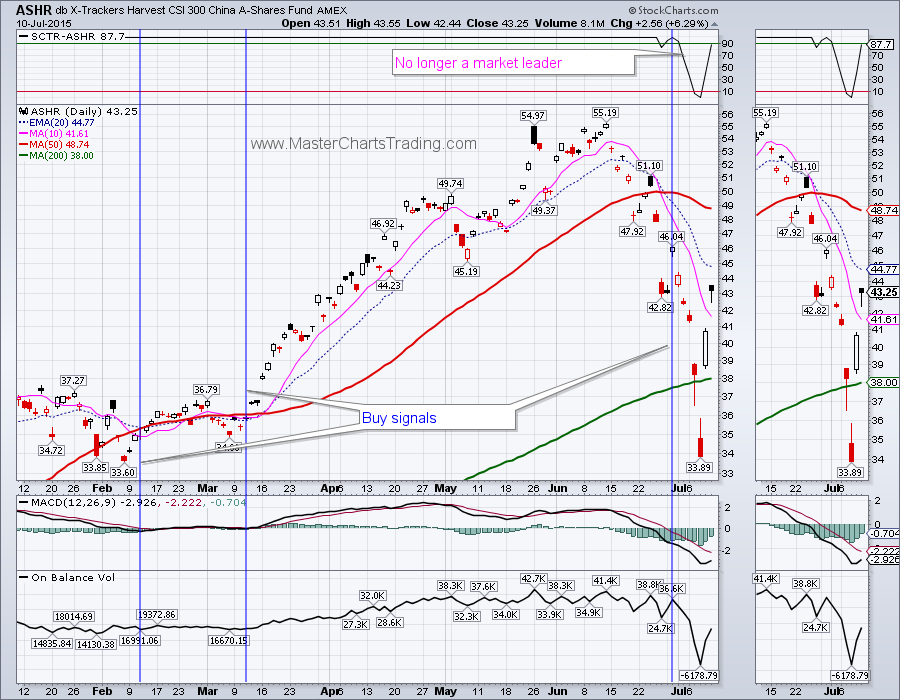
The demise of Chinese stock market was greatly exaggerated. Talk about volatility! ASHR was down over 38% in 17 trading sessions and is now up over 28% in just 3 trading sessions! Looking purely at the technical picture and ignoring the blatant market manipulation by the Chinese government, I still see a bullish chart long-term. If you can stomach this kind of volatility, hopefully via proper position sizing, then today’s close may not have been such a bad entry point.
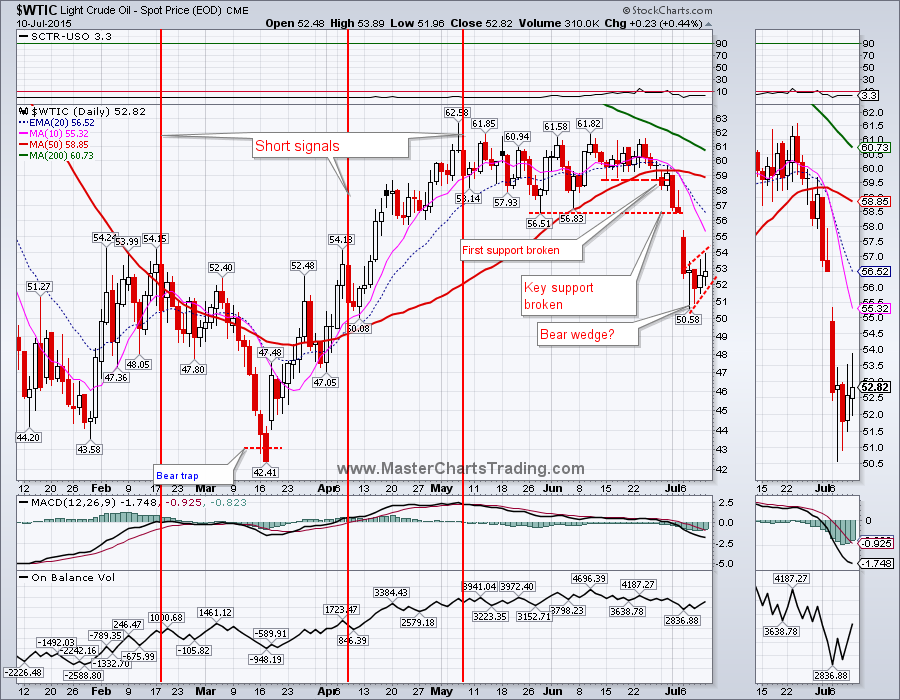
Oil broke key support on Monday with a gap and run lower. Oil is in a bear market and our short signal was back in the beginning of May. All this week $WTIC has been tracing out what appears to be a rising wedge. The rising part is bullish while it is rising. Should this wedge stop rising and move below its rising lower trend line, we would have what is called a rising wedge break. This is bearish and would call for $WTIC to fall to around $45 or even to retest its lows in the $42 area.
That’s it for this week’s market recap,
Best Regards and have another great trading week!
** Special Announcement**
We are close to launching a stocks alert service. Please sign-up for our mailing list to be the first to take advantage of the discounted membership once it becomes available!
Alexander Berger (www.MasterChartsTrading.com)
Best Regards and have another great trading week!
** Special Announcement**
We are close to launching a stocks alert service. Please sign-up for our mailing list to be the first to take advantage of the discounted membership once it becomes available!
Alexander Berger (www.MasterChartsTrading.com)


 RSS Feed