|
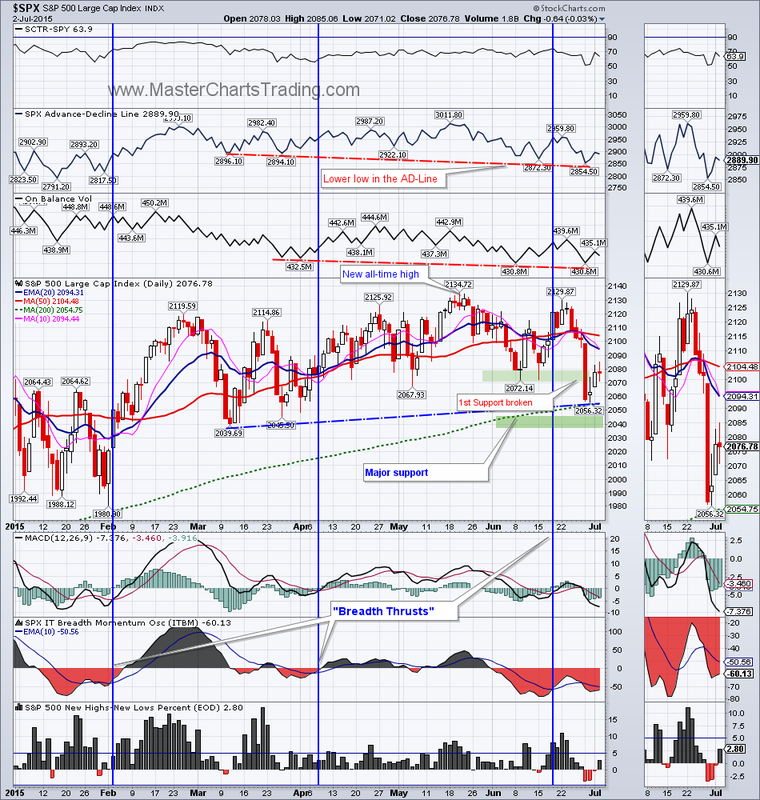
We saw some strong volatility this week as the Greek drama seems to have reached a fewer pitch. Monday’s drop in the stock markets around the world did some technical damage to the charts. When all was said and done over this short trading week, $SPX lost a little over 1% and closed above the prior low from early June - not so terrible of a performance.
|
|
Market breadth for $SPX continues to show some slight divergences. I now say that the divergences are slight because $SPX came down almost to the level of March low, while the On Balance Volume (OBV) and the Advance-Decline Line (AD-Line) are still making lower lows. This could resolve either buy $SPX dropping below 2039 (which would quite negative), or with a rally that would take $SPX to around 2140, preferably on good volume. Additionally, the New Highs-New Lows indicator for $SPX did not drop below -5% yet, so my bias is still bullish.
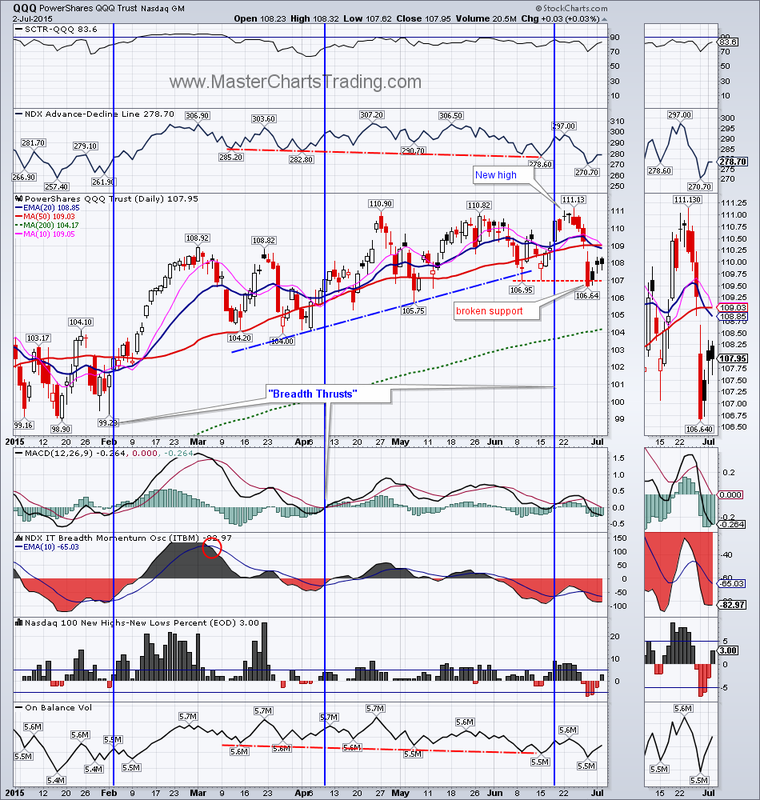
Looks like selling was more pronounced in the technology sectors. The semiconductors sector ETF – XSD, saw some heavy selling last Friday – before the Monday selling related to the Greek crisis. The New Highs-New Lows indicator for QQQ also did drop below the -5% threshold. I want to see this indicator pop above +5%, to turn more bullish. QQQ also has bearish divergences in its AD Line and in the OBV.
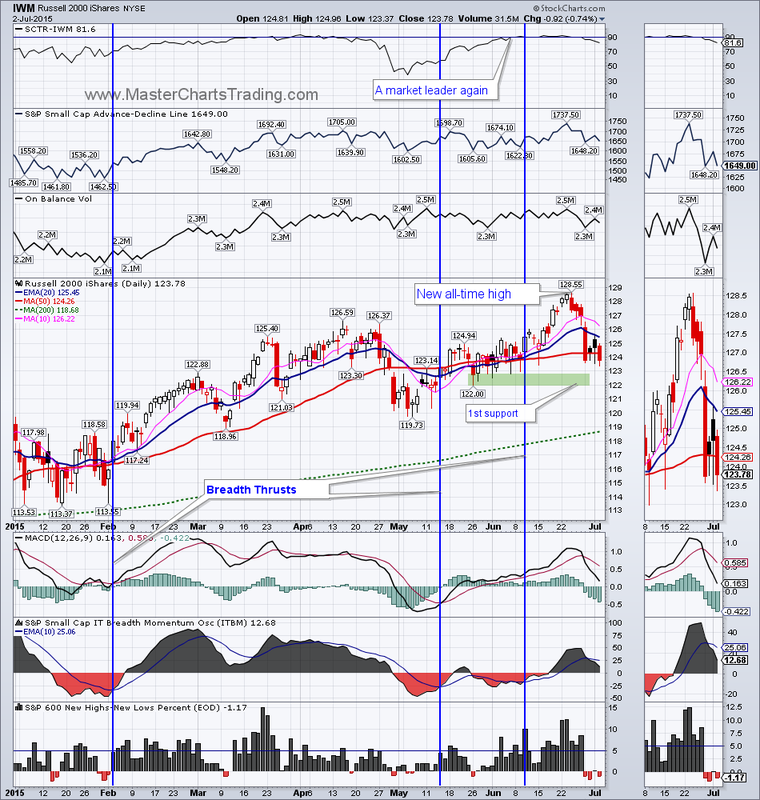
Small caps seemed to be weathering this downturn the best until today (Thursday, July 2). IWM closed the week off with over 2.5% loss and on a rather bearish looking candle. I think IWM will retest its 1st support in the $122 area. Market breadth for IWM is better then that for $SPX or QQQ because there are very few if any divergences and the New Highs-New Lows indicator did not drop below -5%.
Live Charts for $SPX, QQQ and IWM
Live Chart for XSD
Looks like selling was more pronounced in the technology sectors. The semiconductors sector ETF – XSD, saw some heavy selling last Friday – before the Monday selling related to the Greek crisis. The New Highs-New Lows indicator for QQQ also did drop below the -5% threshold. I want to see this indicator pop above +5%, to turn more bullish. QQQ also has bearish divergences in its AD Line and in the OBV.
Small caps seemed to be weathering this downturn the best until today (Thursday, July 2). IWM closed the week off with over 2.5% loss and on a rather bearish looking candle. I think IWM will retest its 1st support in the $122 area. Market breadth for IWM is better then that for $SPX or QQQ because there are very few if any divergences and the New Highs-New Lows indicator did not drop below -5%.
Live Charts for $SPX, QQQ and IWM
Live Chart for XSD

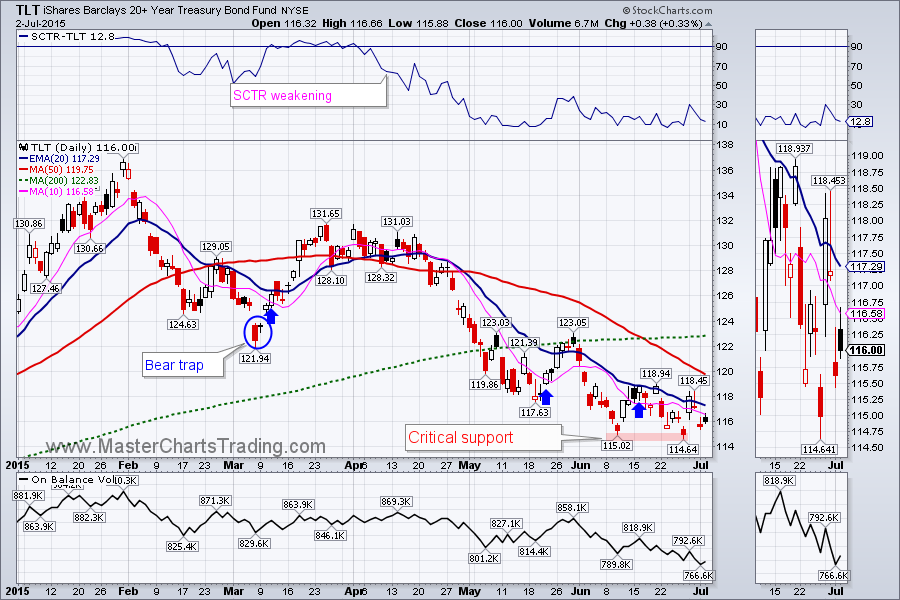
Last week I mentioned that if TLT drops below $114.64, I would consider it to be in a bear market. For now TLT held this area of support and rebounded on flight to safety due to the Greek news. The jobs report was somewhat bullish for bonds and somewhat bearish for stocks. Again, TLT is very close to breaking the above-mentioned support and entering a bear market.
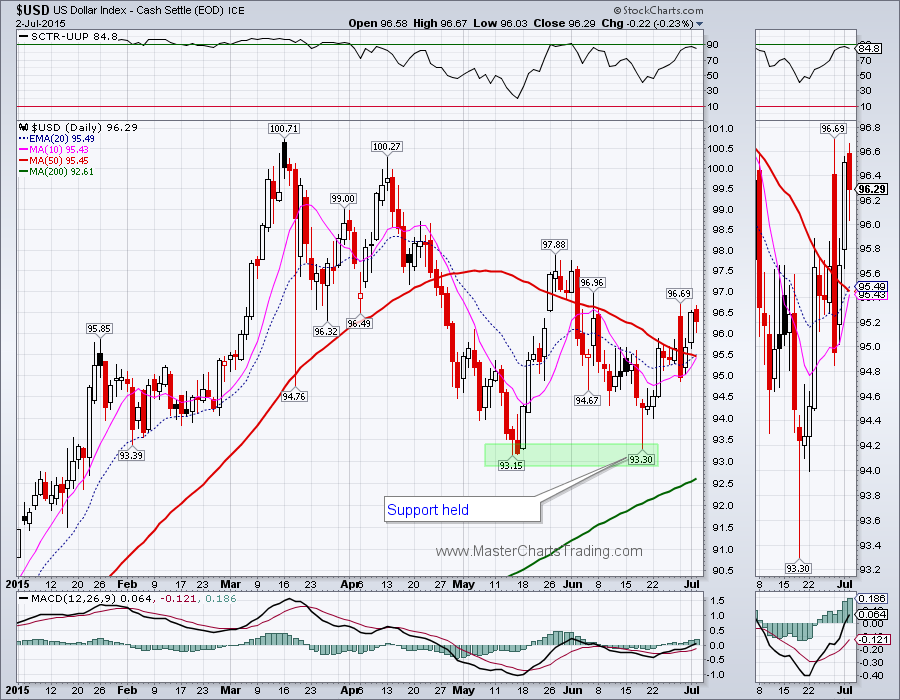
Several weeks ago I mentioned that the dollar ($USD) held support in the $93 area and rebounded. This is weighing on all sorts of commodities: gold and oil in particular. On Monday $USD actually dropped around ¾ of a percent while the Greek news played out.
$USD chart
$USD chart
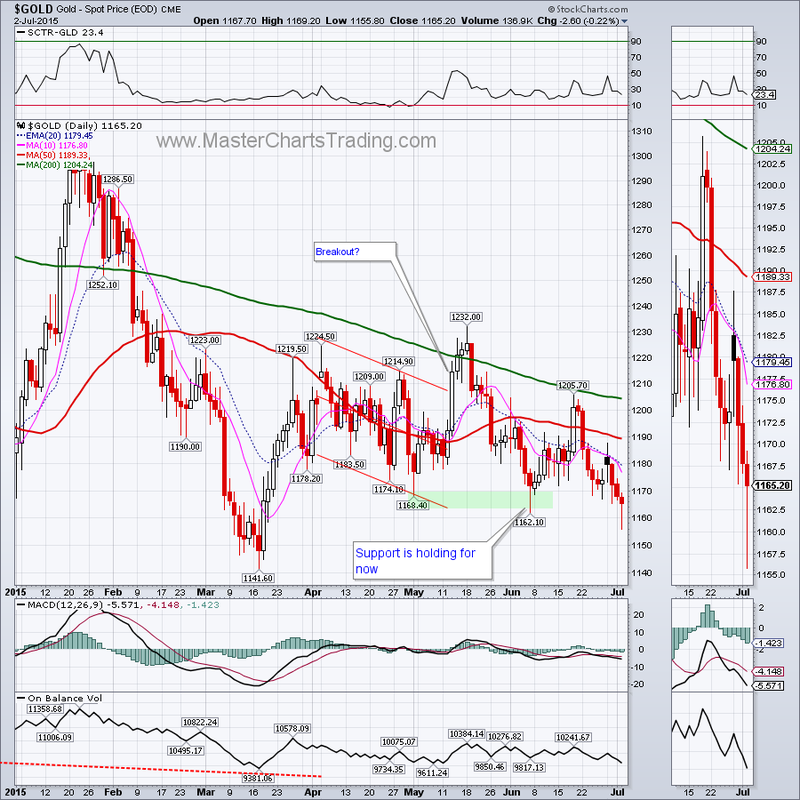
What did gold do on Monday? It gained around ¾ of a percent and by the end of the day, the daily candle for gold looked rather ominous. Then the sellers stepped in Tuesday-Thursday and pushed gold prices lower. It even managed to close below the May 1st low at $1165 on Thursday – an unwelcome sign for gold bulls. Overall, Thursday’s candlestick could be considered a hammer - meaning that the buyers stepped in by day’s end and pushed the prices higher. If gold miners are any indication, we could still see a retest of mid-March lows at $1141 before any meaningful rebound is to occur.
Gold charts
Gold charts
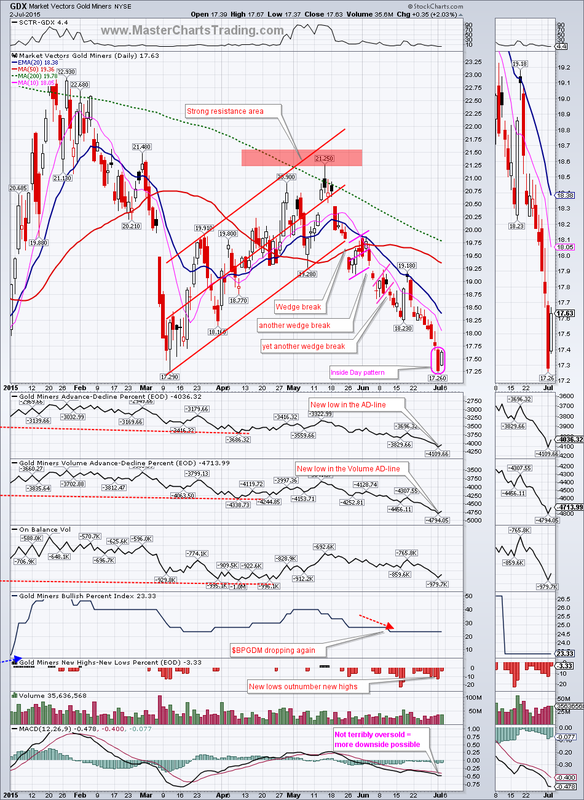
Gold miners (GDX) had a much worse week. On Wednesday GDX closed below the March 11th low at $17.26. GDX is weak and staying weak. At this point it is unclear whether this retest of March lows turns out to be the line in the sand for GDX.
Thursday’s action is somewhat promising for GDX bulls. The two candlesticks taken together, those from Wednesday and Thursday constitute an Inside Day. This means the entire price action on Thursday was contained within the trading range from Wednesday. Should the range break to the upside, we may see sustained rally to around $18.50. Alternatively, should the range break to the downside, we could easily see prices in the $16.90 area or lower.
Gold Miners (GDX Chart)
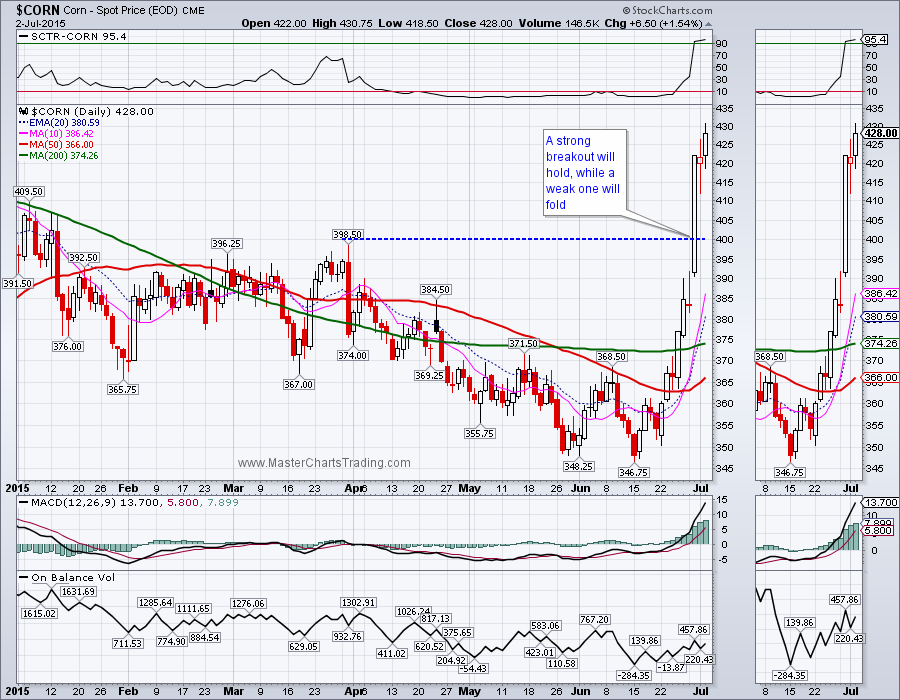
This week we saw some strong action in agricultural commodities. Grains rallied strongly. Corn, for example, is up around 25% for the past 2 weeks! Corn also broke above the late March resistance level on a bullish looking candle to become one of the market leaders. Its SCTR (technical rank against other securities) is now in the top 10%. Long-term, I still would like to see this breakout hold on a retest. Should this breakout hold, I would consider entry opportunities in the future as they arise.
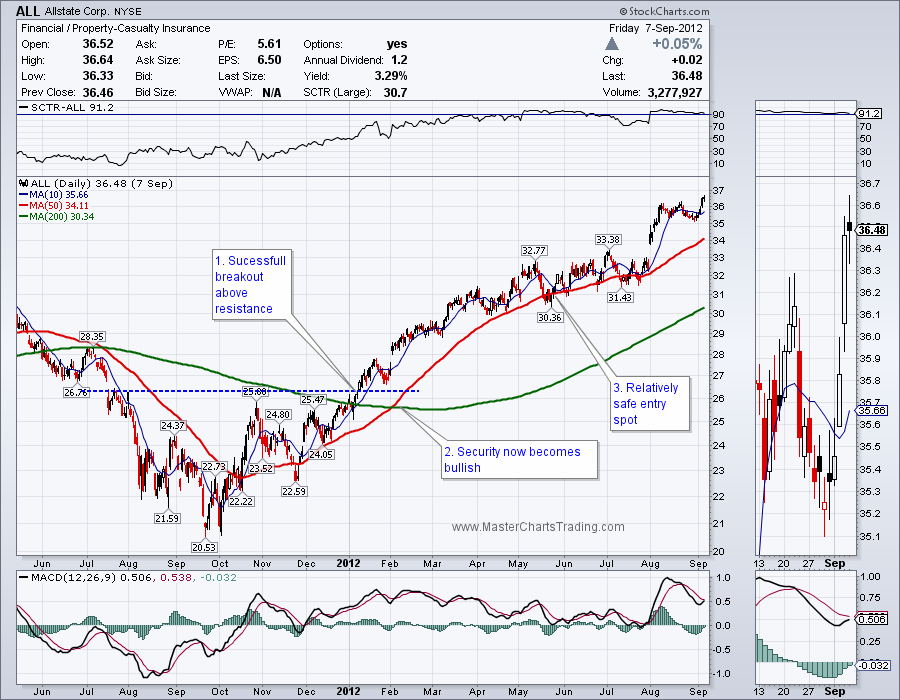
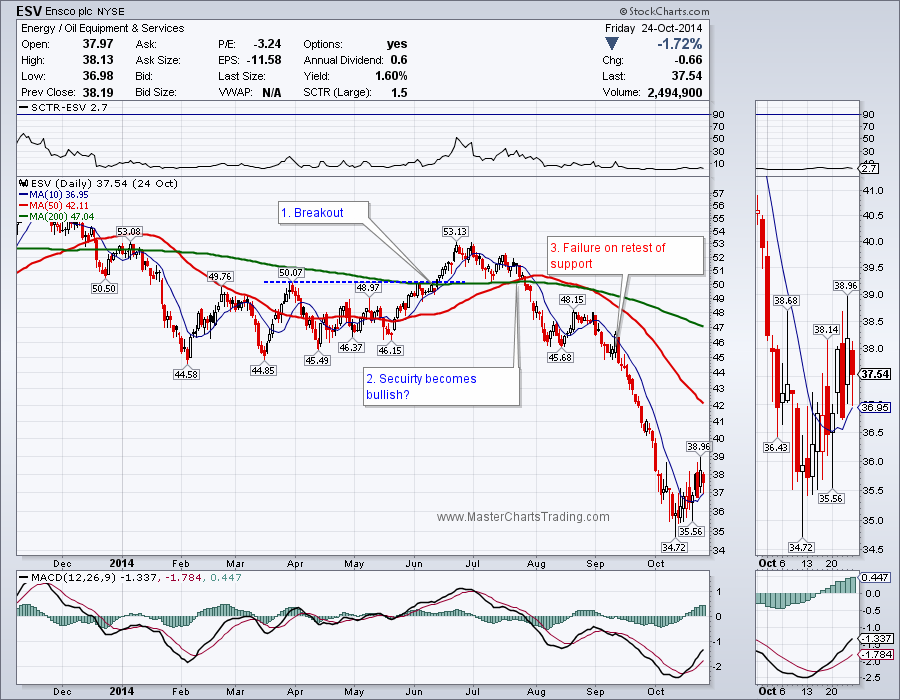
Please watch the video as I show a stock that had a successful breakout and another one that failed. The video examples also illustrate that buying the breakout adds to risk (IMHO).
Charts for the stocks in the video exclusive are here for ALL and ESV
Charts for the stocks in the video exclusive are here for ALL and ESV
That’s it for this week’s market recap,
Best Regards and have another great trading week!
** Special Announcement**
We are close to launching a stocks alert service. Please sign-up for our mailing list to be the first to take advantage of the discounted membership once it becomes available!
Alexander Berger (www.MasterChartsTrading.com)
Best Regards and have another great trading week!
** Special Announcement**
We are close to launching a stocks alert service. Please sign-up for our mailing list to be the first to take advantage of the discounted membership once it becomes available!
Alexander Berger (www.MasterChartsTrading.com)


 RSS Feed