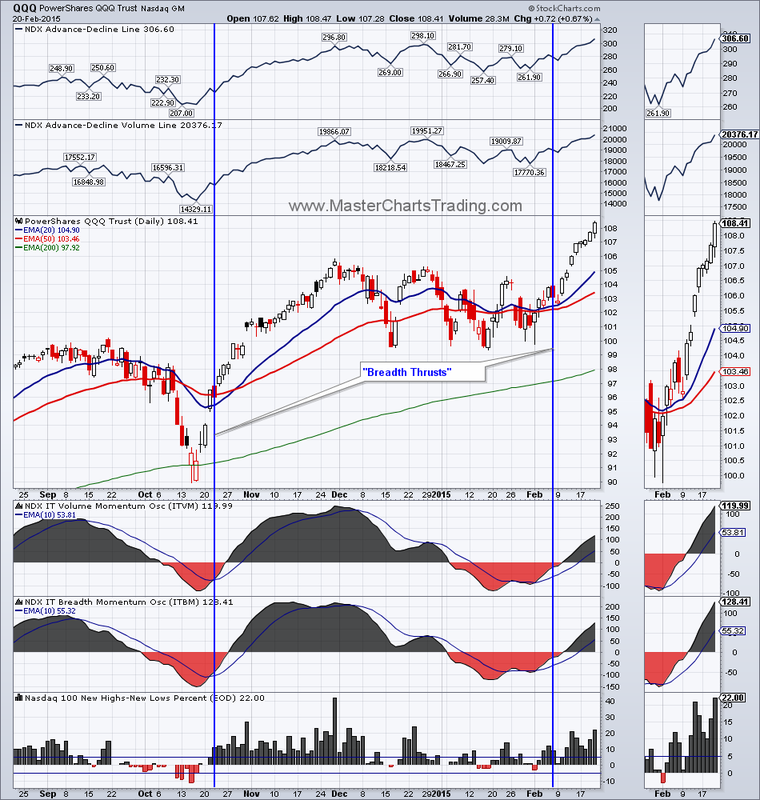
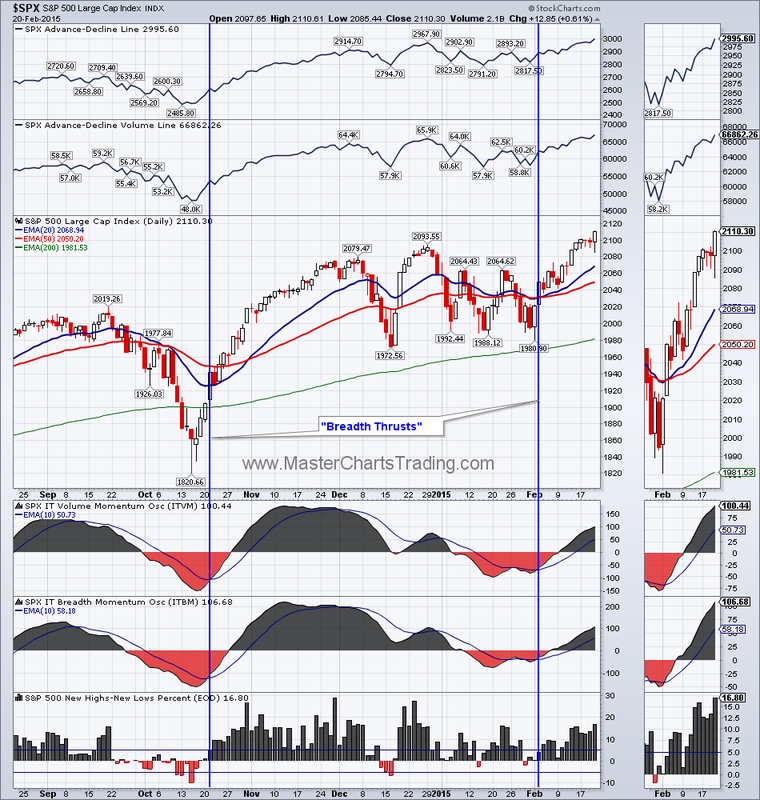
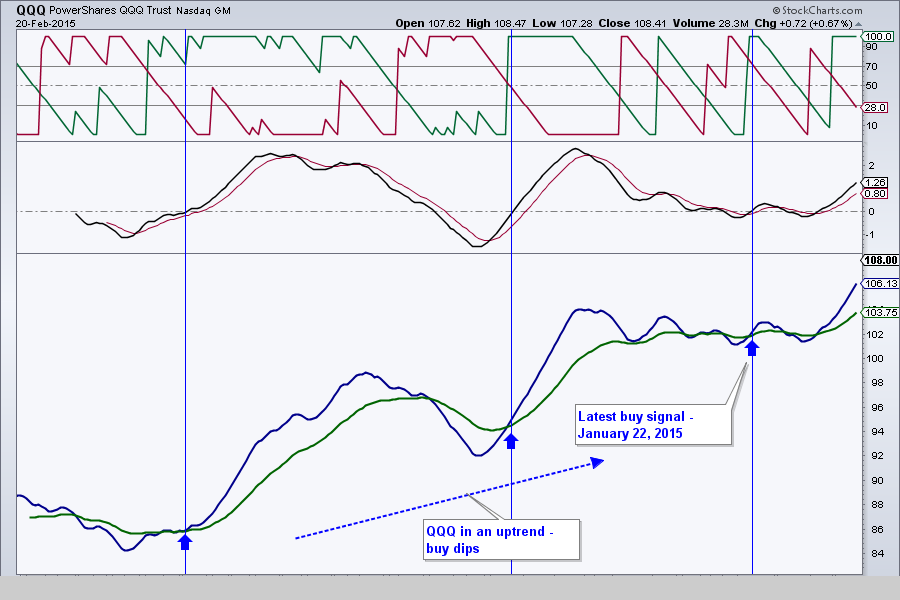
| Friday, February 20, 2015 Weekly Market Recap. Watch this video on YouTube Major indices hit all-time closing highs on Friday and remain in an uptrend. Indices are getting somewhat overbought, but by no means weak. QQQ is leading with an almost 5% advance after our buy signal on January 22nd. Apple (AAPL) alone advanced over 15% from our buy signal on January 23rd. Market breadth remains bullish and I see no negative divergences within the Advance-Decline lines. The breadth momentum is still bullish and expanding. It is getting a bit frothy, but I am yet to see any significant selling pressure in the major indices. The charts are located here | |
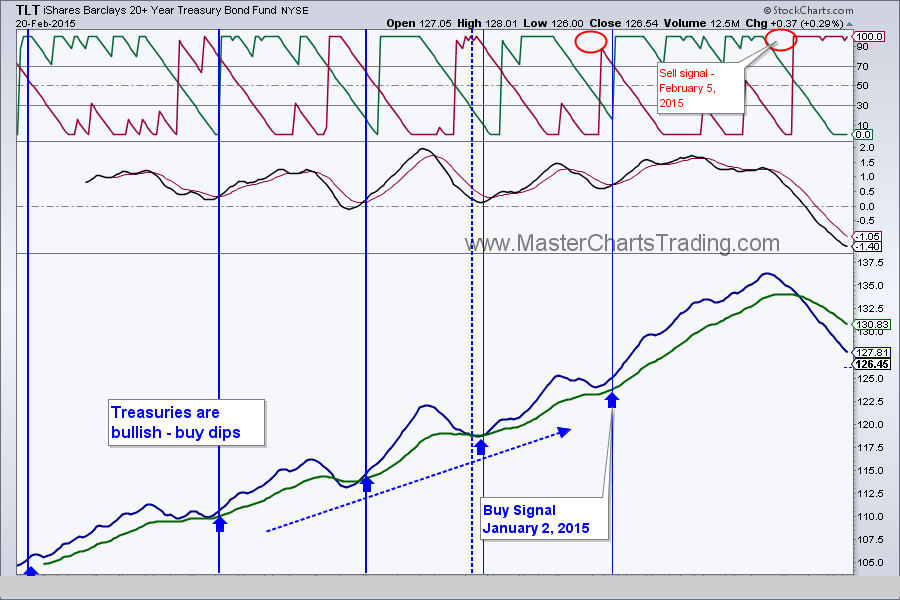
Bonds (TLT) may be finally stabilizing after around a 9% drop from its all-time highs. TLT is not yet oversold and I am seeing very little buying pressure, so I would not rule out another 2-3% drop from here.
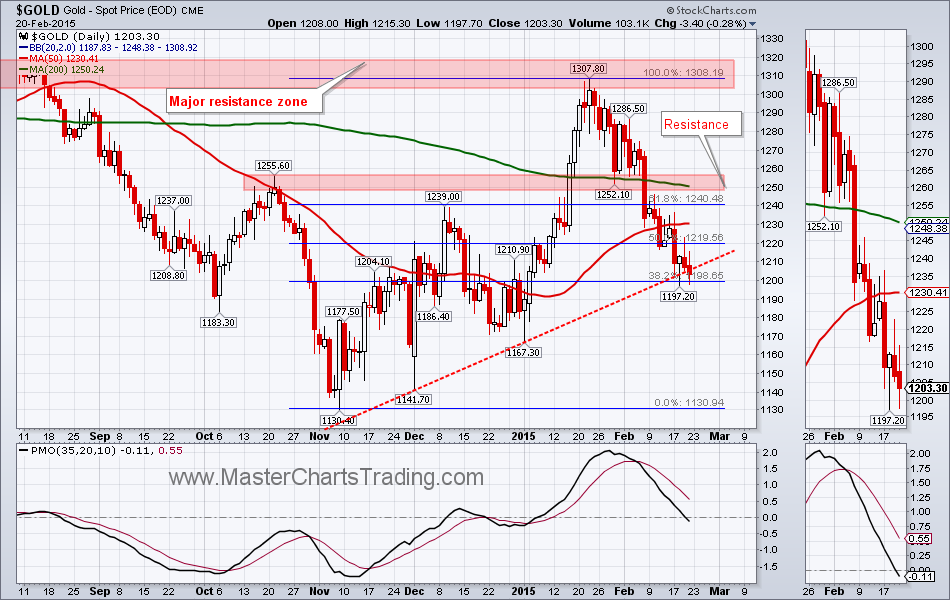
Gold lost another 2% for the week and may have broken an intermediate-term uptrend line drawn from December and January lows. It needs to be confirmed next week. Gold has now retraced 62% of its advance from November, so if it was to stop falling, this would be the place. Live Gold chart here

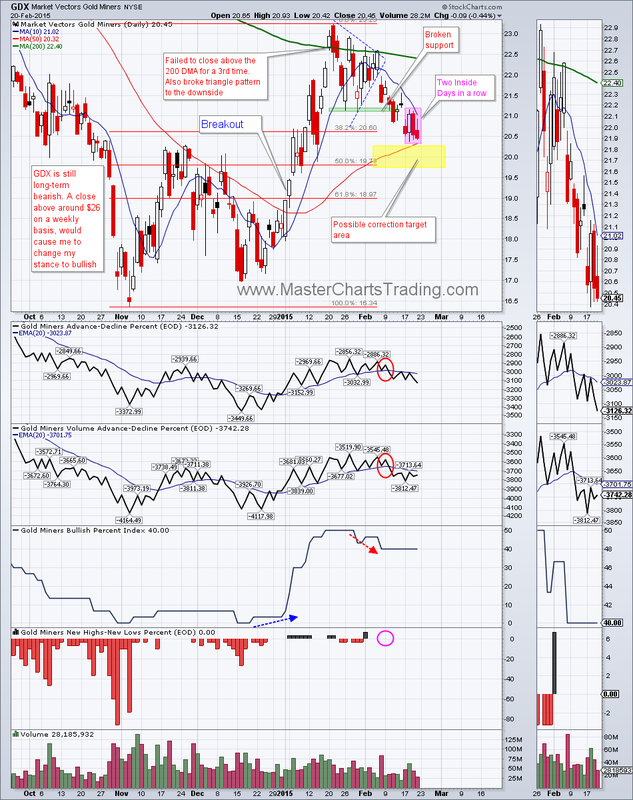
Gold miners also lost almost 4% for the week and are nearing my correction target in the $20 area. Interestingly, GDX printed what looks like 2 Inside Days in a row on Thursday and Friday. An Inside Day happens when the entire today’s trading range is within yesterday’s trading range. A range break of the Inside Day (either up or down) would signal the prevailing direction in the short-term. Two inside days in a row, makes the range break even more powerful. My money is on the downside break – we still have a position in DUST open.
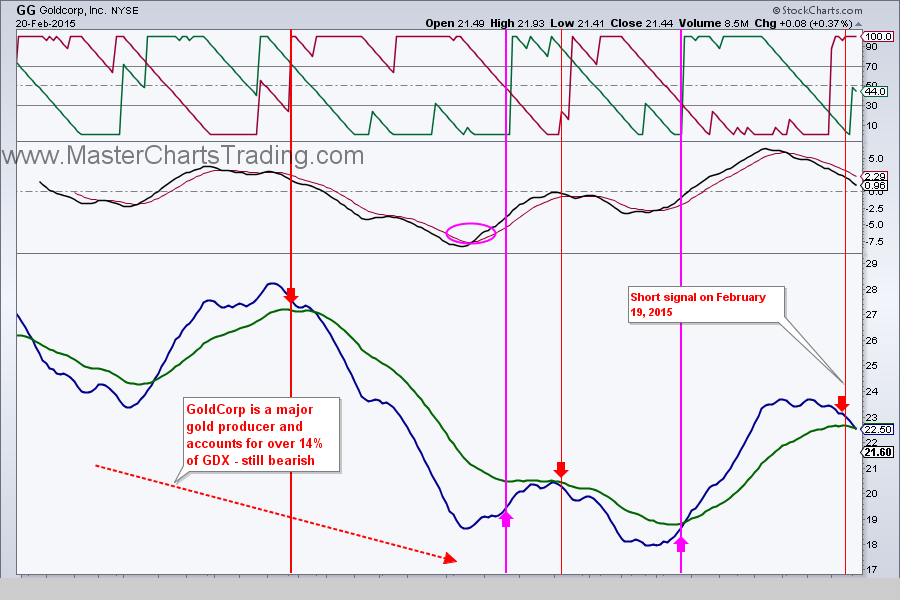
I monitor a few of the individual gold stocks in addition to gold ETFs and wanted to highlight a couple of them today. First, a clearly bearish one – GoldCorp (ticker GG). On Thursday it announced a $2.4 billion loss and the stock plummeted 8.4%. A short signal was generated on GoldCorp by our trading system on Thursday morning. Live chart of GoldCorp - $GG here
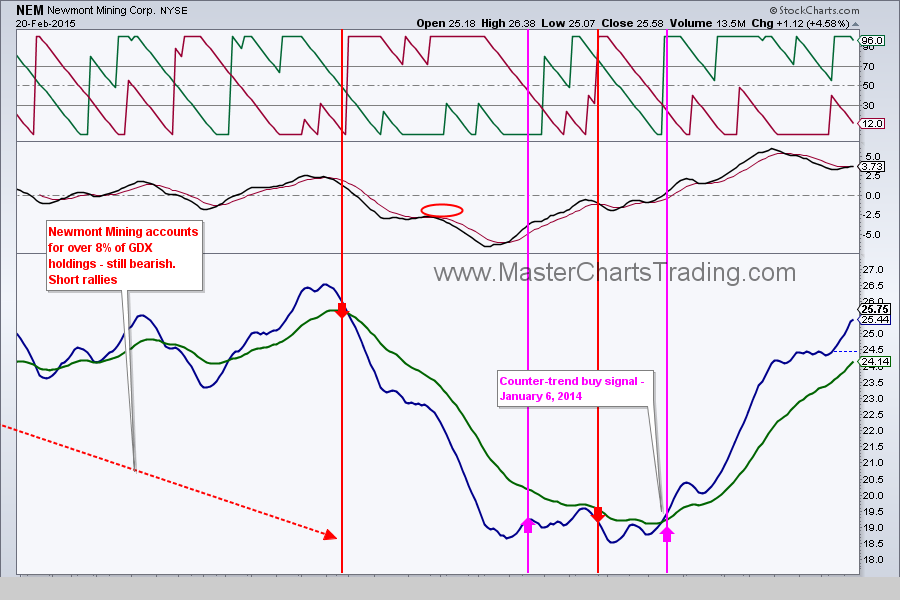
Second, a less bearish gold stock – Newmont Mining (ticker NEM). On Friday it posted a respectable earnings report and stock surged 4.58%. Newmont mining was on our counter-trend buy signal as early as January 6th. I am almost ready to call NEM bullish long-term, it just needs a little more upside for me to do so.

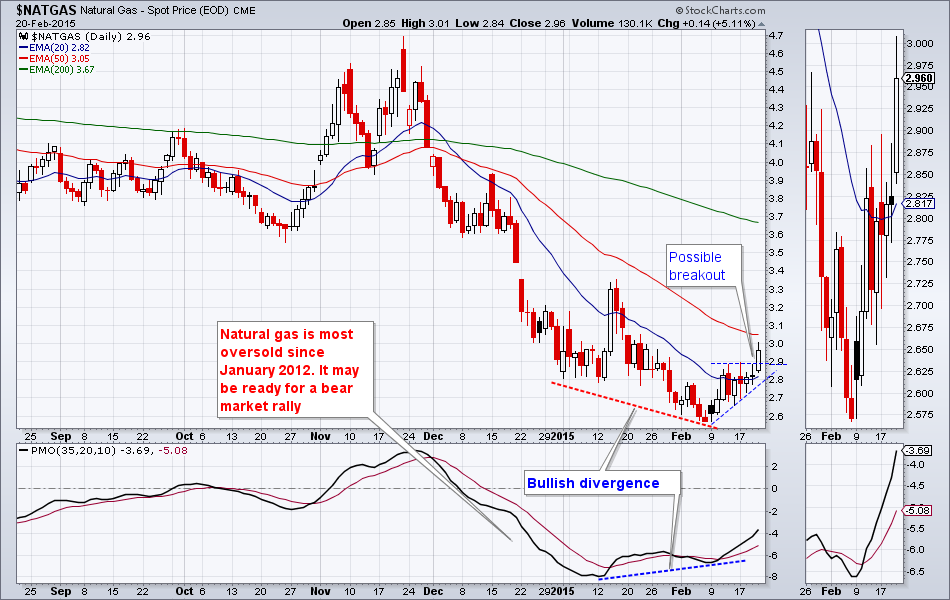
Finally, as I mentioned last week, Natural gas ($NATGAS) may have started its counter-trend rebound. On Thursday, after the release of $NATGAS inventories, the price did not fall, that was the first bullish sign. Our system did not yet generate a counter-trend buy signal, though, but with even a very small upside next week, it should do so.
Then today the price jumped over 5%. $NATGAS may have also broken out of the triangle formation, as seen on the chart below.
Then today the price jumped over 5%. $NATGAS may have also broken out of the triangle formation, as seen on the chart below.
That’s it for this week’s recap,
Best Regards and have another great trading week!
Alexander Berger (www.MasterChartsTrading.com)
Disclaimer, we have:
Open positions: SPY, DUST
New position:
Closed position:
Best Regards and have another great trading week!
Alexander Berger (www.MasterChartsTrading.com)
Disclaimer, we have:
Open positions: SPY, DUST
New position:
Closed position:


 RSS Feed