Friday, April 11, 2014
Multiple Sell Signals (Weekly Commentary)
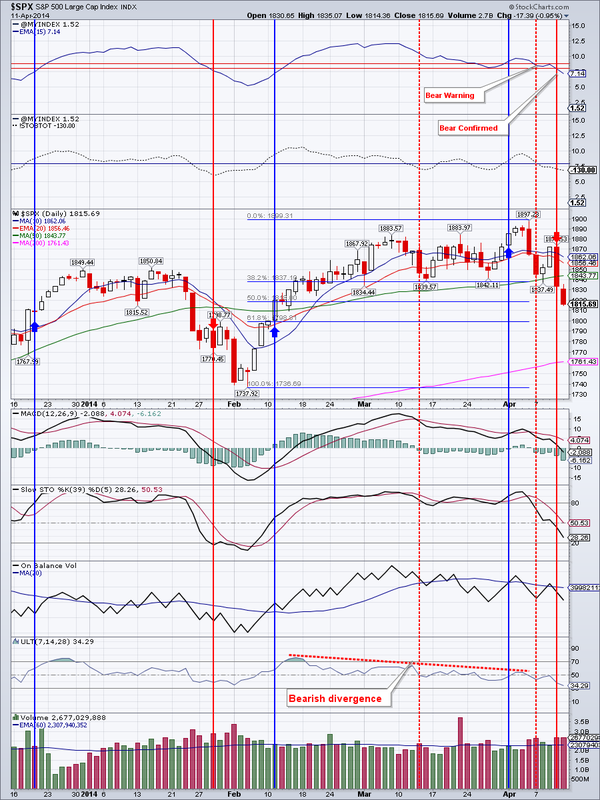
Last week was remarkable for several reasons, most of them bearish in nature.
1. $SPX and the Dow closed below the 50 day moving average (DMA).
2. The NASDAQ and the Russell 2000 continued their downward "outperformance".
3. The volume and momentum indicators continue to show bearish readings
4. Our Market Breadth Index, the $VMBI, has officially entered the bearish territory.
5. Multiple other market breadth indicators such as Intermediate-Term Breadth Momentum Oscillator ($ITBM), Swenlin Trading Oscillator Breadth and Volume Oscillators ($STO-B and $STO-V) and DecisionPoint Percent Buy Index (PBI) have turned negative.
We are approaching oversold levels for the $NASDAQ and the Russell, but I feel that $SPX is just getting started in the correction process.
TLT was a big winner last week gaining over 2% on above average volume and posting an 11 month high. The long dated treasuries are well on the way to my target of around $115. Strength in treasuries is signaling "flight to safety". All indications are pointing to higher TLT prices ahead.
Gold gained over 1% over the last week, albeit on rather low volume. It has closed above the 50 DMA for the past 3 sessions...
... GDX however troubles me a bit. It bounces off the 50 DMA and is yet to close above it. Should gold continue higher, however, GDX is sure to play catch-up.
IYR ran into resistance from March 5th high. It does look like this might be a mere consolidation before a push higher. Good support is in the $65.80-66.90 area.
EEM trade is getting crowded, but it is still pushing higher. I believe we are starting to roll over here and will retest support in the $40 area soon. Once a turnaround from this retest is evident, it could be a nice buying opportunity.
Oil gained over 2% for the week. There is strong support in the $98-100 area and next resistance is at $105.22 (which oil is currently challenging). I have a bullish bias on oil currently.
Natural gas is rather volatile commodity. It may have put in a at least a short-term bottom on April 2nd. It is coming up on resistance at the 50 DMA, currently at $4.75. A failure here would cause us to repurchase DGAZ.
Bottom line: A bearish period has descended upon the stock markets.
Open positions: GDX, NUGT, IYR, TLT, EEM
Hedging positions: SPXU
Multiple Sell Signals (Weekly Commentary)
Last week was remarkable for several reasons, most of them bearish in nature.
1. $SPX and the Dow closed below the 50 day moving average (DMA).
2. The NASDAQ and the Russell 2000 continued their downward "outperformance".
3. The volume and momentum indicators continue to show bearish readings
4. Our Market Breadth Index, the $VMBI, has officially entered the bearish territory.
5. Multiple other market breadth indicators such as Intermediate-Term Breadth Momentum Oscillator ($ITBM), Swenlin Trading Oscillator Breadth and Volume Oscillators ($STO-B and $STO-V) and DecisionPoint Percent Buy Index (PBI) have turned negative.
We are approaching oversold levels for the $NASDAQ and the Russell, but I feel that $SPX is just getting started in the correction process.
TLT was a big winner last week gaining over 2% on above average volume and posting an 11 month high. The long dated treasuries are well on the way to my target of around $115. Strength in treasuries is signaling "flight to safety". All indications are pointing to higher TLT prices ahead.
Gold gained over 1% over the last week, albeit on rather low volume. It has closed above the 50 DMA for the past 3 sessions...
... GDX however troubles me a bit. It bounces off the 50 DMA and is yet to close above it. Should gold continue higher, however, GDX is sure to play catch-up.
IYR ran into resistance from March 5th high. It does look like this might be a mere consolidation before a push higher. Good support is in the $65.80-66.90 area.
EEM trade is getting crowded, but it is still pushing higher. I believe we are starting to roll over here and will retest support in the $40 area soon. Once a turnaround from this retest is evident, it could be a nice buying opportunity.
Oil gained over 2% for the week. There is strong support in the $98-100 area and next resistance is at $105.22 (which oil is currently challenging). I have a bullish bias on oil currently.
Natural gas is rather volatile commodity. It may have put in a at least a short-term bottom on April 2nd. It is coming up on resistance at the 50 DMA, currently at $4.75. A failure here would cause us to repurchase DGAZ.
Bottom line: A bearish period has descended upon the stock markets.
Open positions: GDX, NUGT, IYR, TLT, EEM
Hedging positions: SPXU


 RSS Feed