Master Charts Trading - Stock Market Indicators & Trade Alerts
Connect To Us!
  • MasterChartsTrading
  • Blog
  • Sign-Up
  • Members
    • Elite Trading Blog
    • Stock Speculator Blog
    • Training Library >
      • Basics of Trading
      • Risk & Trading Psych
      • Trend Identification
  • Help
    • Hall of Fame
    • Social
    • About Us
    • Contact
    • FAQs
    • Disclaimer
    • Refund Policy
    • Privacy Policy
    • What We Trade
    • Newsletter samples

A Pause at a Critical Juncture.

4/24/2014

0 Comments


Wednesday April 23, 2014

A Pause at a Critical Juncture.

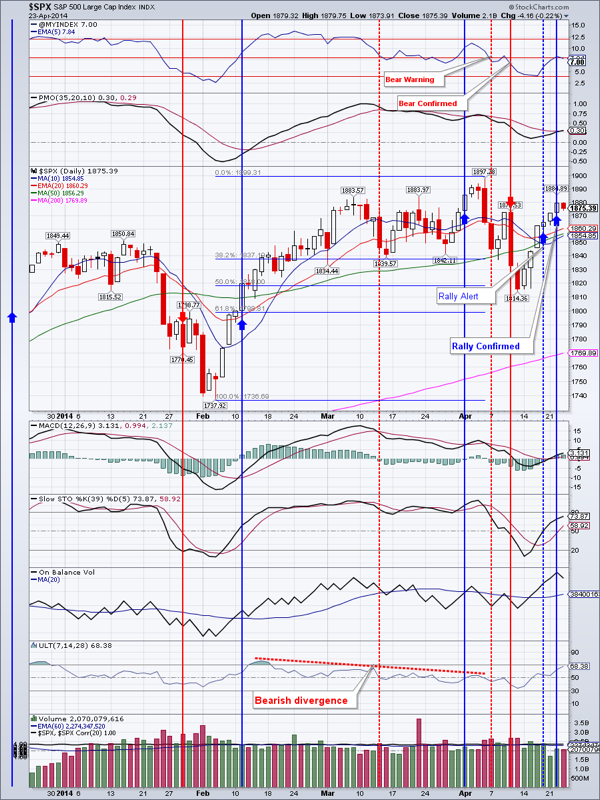
  Indices took a breather today with small losses and Inside days (entire today’s range within yesterday’s range). Only the NASDAQ fell through yesterday’s range and closed within the gap-up area from yesterday. NASDAQ is coming up on resistance at 4185.19 and should work through it. Unless $SPX fails here at April 4th highs, I can see it making new all-time highs soon.

  Market breadth is bullish. The Swenlin oscillator is rising and positive. The McClellan Oscillator is positive. Our in-house Market Breadth Index is rising, which indicates broadening participation in this advance that started April 11.

  Bonds continue to rattle investor’s nerves by putting on a strong show. There is however a divergence between TLT’S Ultimate Oscillator and TLT itself. The oscillator was overbought and above 75 on March 3rd, while TLT was at $108.90. Then on March 27 TLT made a higher high at $110.11, but the oscillator topped out at 67. Now the latest higher high on April 15th was at $111.51, yet the oscillator only made it as high as 65. We already took profits on TLT, but still hold a sizable bond allocation.

  Gold may have found support in the $1275 area. There is strong resistance in the $1310 area.

  GDX bounced up to the 200 day moving average and closed the gap-down from April 15th. Could this be a double bottom? I am neutral on GDX and gold for now. We were going to add to our open DUST position, but held off because there was no close below March 27 low. Our tiny DUST position got stopped-out.

  EEM is still in the process of rolling over to the downside. It’s possible that it will retest the April 15th lows, but possibly even the $40-39 area before heading higher.

  IYR had an inside day. First support is at $68.51

  Oil may have found support at the 50 day moving average. However volume pattern suggest more downside is likely.

  Natural gas is continuing to trace out a bullish flag. Today was the second day in a row that it closed above the 50 DMA. We have an open UGAZ position.

  Open positions: IYR, TLT, EEM, DIA, QQQ, TNA, UGAZ

  Bottom line: Stocks are coming up on resistance, but should push through it.

Picture
Ready to trade? Sign-up Today
0 Comments


Leave a Reply.

    Picture
    Picture
    Subscribe to our mailing list!
    Picture
    Picture

    Archives

    February 2023
    January 2023
    December 2022
    November 2022
    October 2022
    September 2022
    August 2022
    July 2022
    June 2022
    May 2022
    April 2022
    March 2022
    February 2022
    January 2022
    December 2021
    November 2021
    October 2021
    September 2021
    August 2021
    July 2021
    June 2021
    May 2021
    April 2021
    March 2021
    February 2021
    January 2021
    December 2020
    November 2020
    October 2020
    September 2020
    August 2020
    July 2020
    June 2020
    May 2020
    April 2020
    March 2020
    February 2020
    January 2020
    December 2019
    November 2019
    October 2019
    September 2019
    August 2019
    July 2019
    June 2019
    May 2019
    April 2019
    March 2019
    February 2019
    January 2019
    December 2018
    November 2018
    October 2018
    September 2018
    August 2018
    July 2018
    June 2018
    May 2018
    April 2018
    March 2018
    February 2018
    January 2018
    December 2017
    November 2017
    October 2017
    September 2017
    August 2017
    July 2017
    June 2017
    May 2017
    April 2017
    March 2017
    February 2017
    January 2017
    December 2016
    November 2016
    October 2016
    September 2016
    August 2016
    July 2016
    June 2016
    May 2016
    April 2016
    March 2016
    February 2016
    January 2016
    December 2015
    November 2015
    October 2015
    September 2015
    August 2015
    July 2015
    June 2015
    May 2015
    April 2015
    March 2015
    February 2015
    January 2015
    December 2014
    November 2014
    October 2014
    September 2014
    August 2014
    June 2014
    May 2014
    April 2014
    March 2014
    February 2014
    January 2014

    RSS Feed

  All information on MasterChartsTrading.com is for educational and entertainment purposes only, and should not be construed as a recommendation to buy, sell or sell-short said securities. Read full disclaimer.