|
Friday, April 3, 2015 Weekly Market Recap.
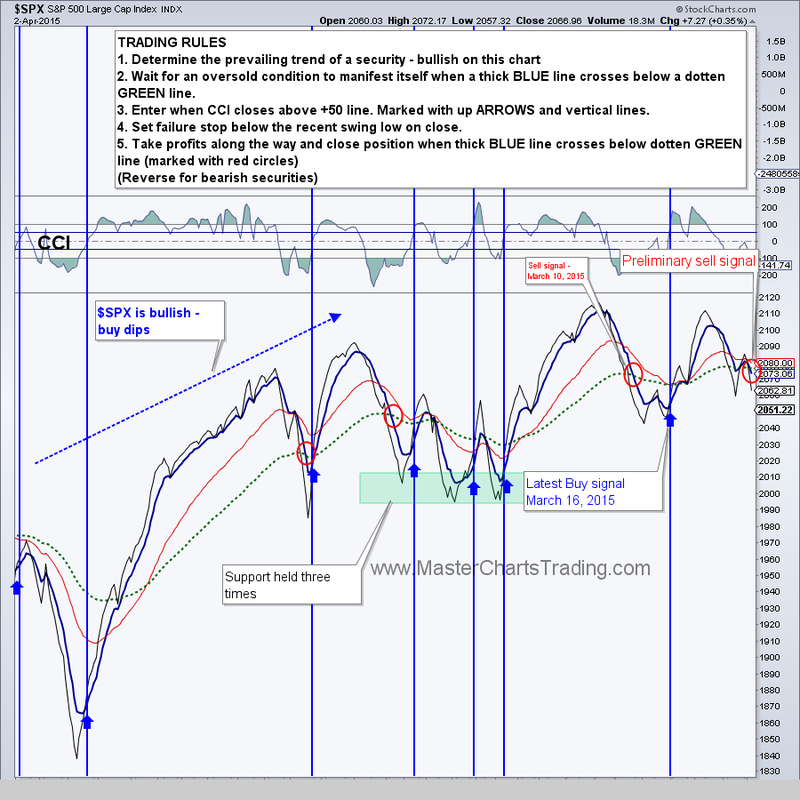
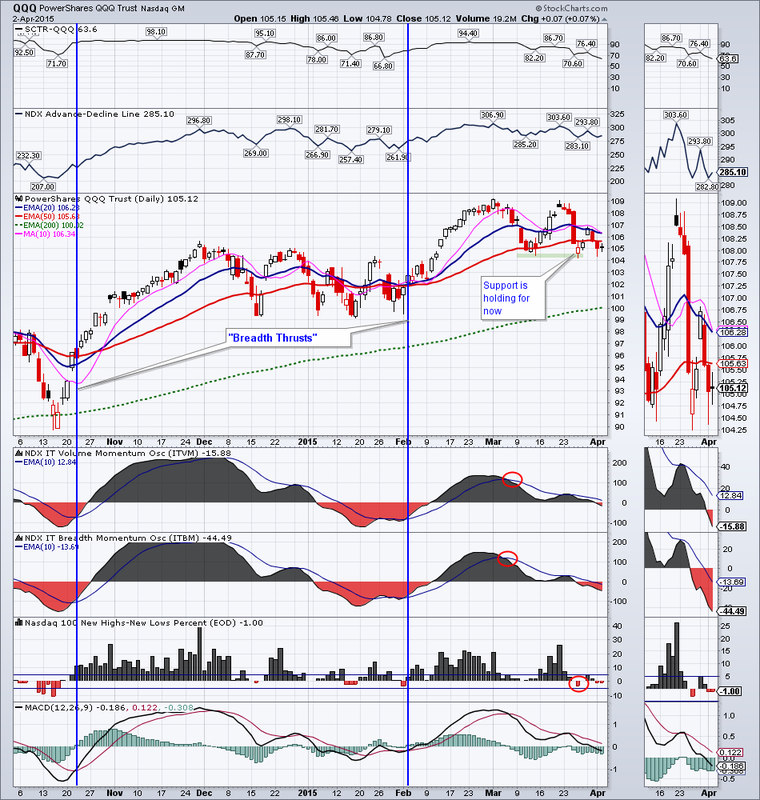
Markets were mixed this week. S&P 500 managed to gain a fraction of a percent, while the NASDAQ 100 lost a fraction of a percent. For now the support from early March is holding for the major averages. Friday’s jobs report surprised many analysts and the market participants with its weakness. Markets were closed because of the Good Friday holidays today, but futures were traded for a very brief session today. E-mini settled at 2039.75, which is exactly around the March 11th low. I am guessing $SPX will gap down on Monday. Our trading system generated a sell signal as early as March 26 in $SPX, but I kept the position open hoping for a strong rebound. It never came. On Thursday, I went ahead and cut my equity exposure. Charts for $SPX & QQQ here |
Watch this video on the YouTube
|

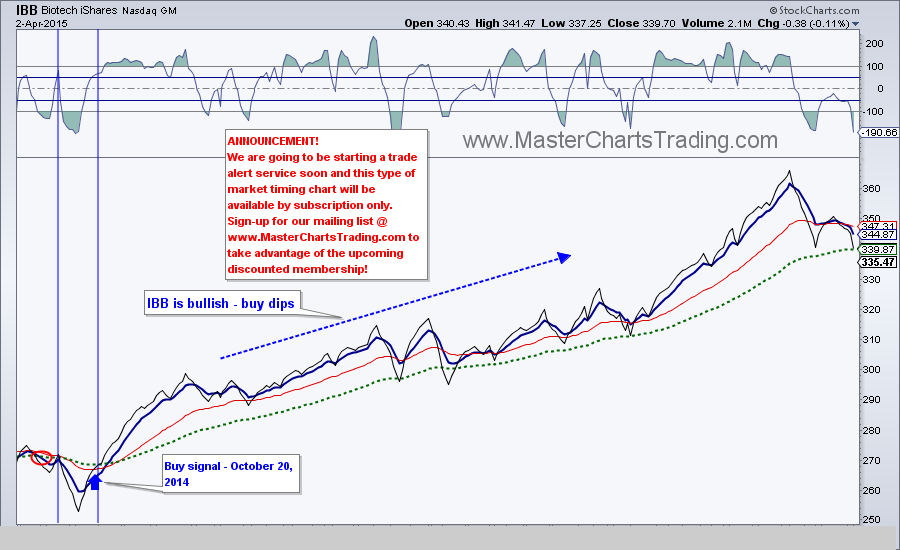
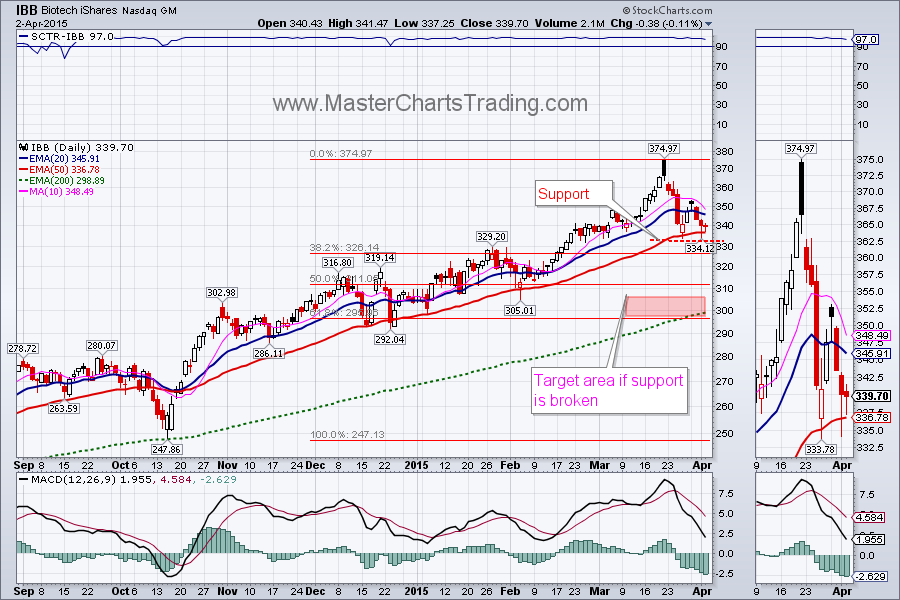
Some hot sectors may also be overdue for a pullback. One such sector that comes to mind is biotech. IBB has been on a tear as it gained over 51% from its low in October to its high in mid-March! IBB is already down around 10% from its peak. There is decent support at $332 from the two recent lows, but should that give, we could easily drop 10-12% from today’s prices. IBB chart here and here
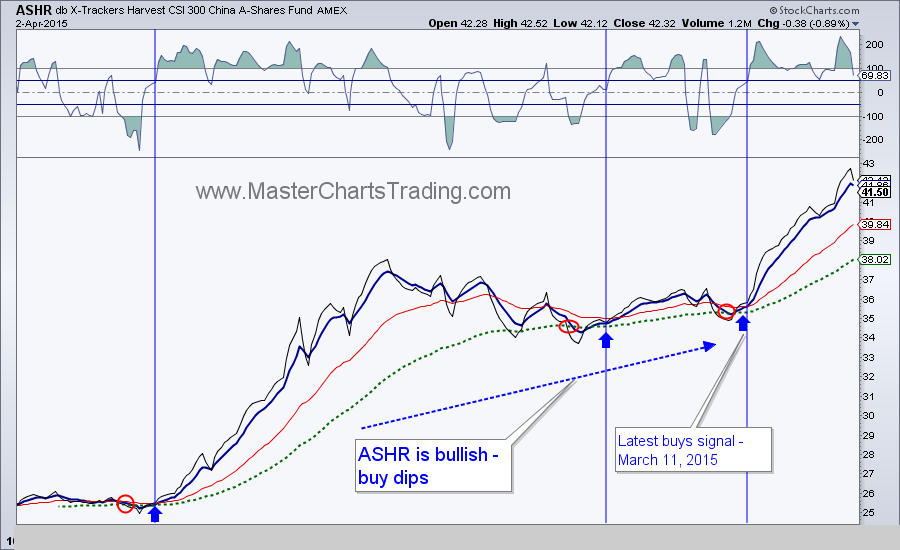
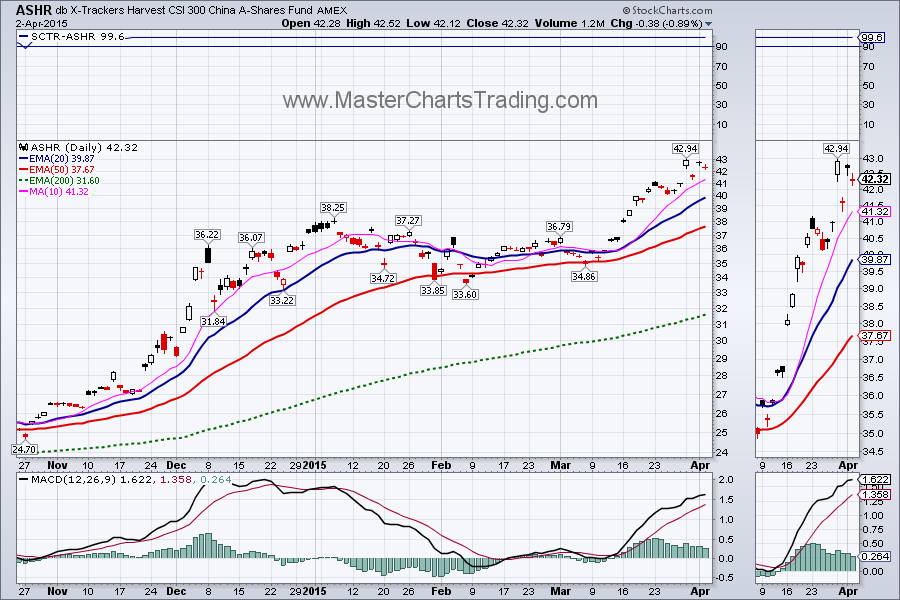
Chinese stocks may be one of the recipients of money rotating out of the US equities. ASHR – China 300 Fund is one of the current market leaders. How long this outperformance may continue is anybody’s guess. For now, I will treat any future substantial pullback in this China fund as a buying opportunity (once my buy trigger is hit). ASHR charts here
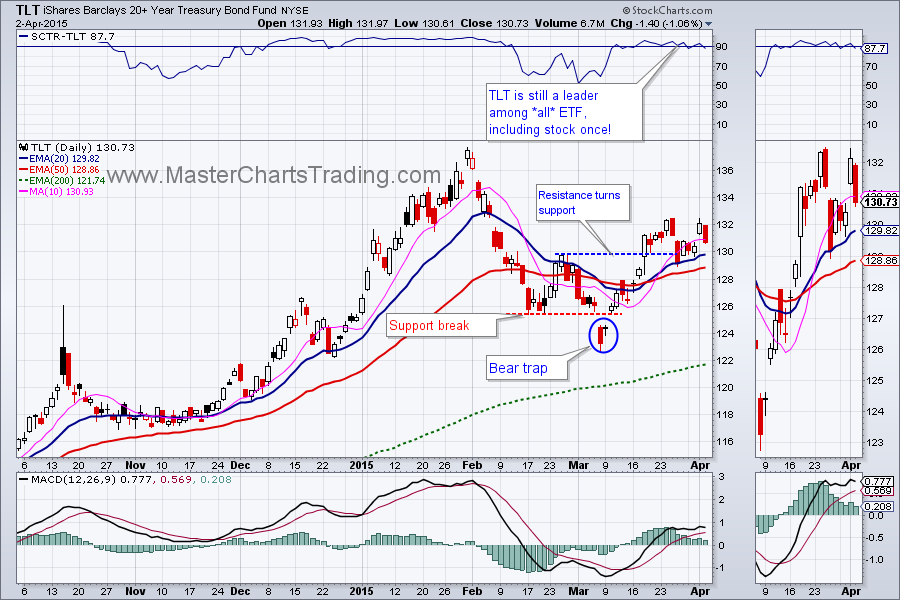
Bonds did OK for the week - TLT is basically flat. Treasuries gained in the short Friday session following the jobs report. TLT is still bullish and one of the market leaders. TLT charts on the bottom here

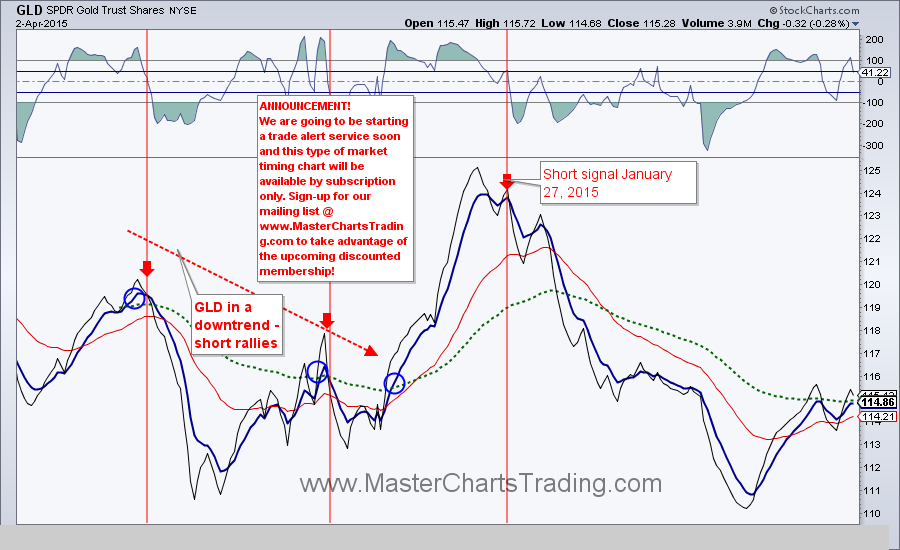
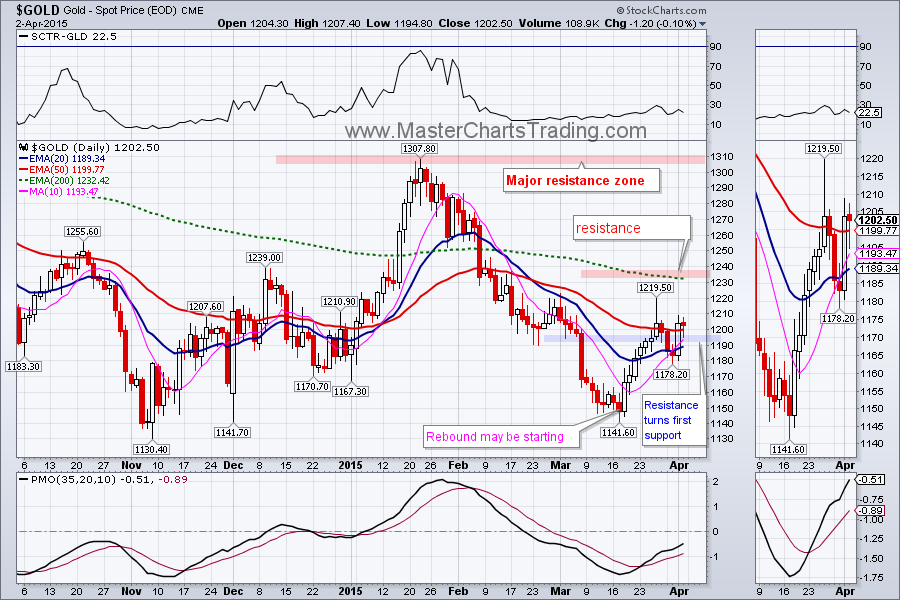
On the daily chart, gold held support in the $1130-$1140 area and is now in the process of rebounding. This rally took gold to resistance and it managed to close above the 50-day exponential moving average (EMA) for the second day in a row. This is welcome news for the gold bulls. To me this is still a bear-market rally. There are still lots of overhead resistance levels. Notably in the $1230 area where the 200 day EMA is currently residing. For now rally continues and I don’t have a short signal just yet.
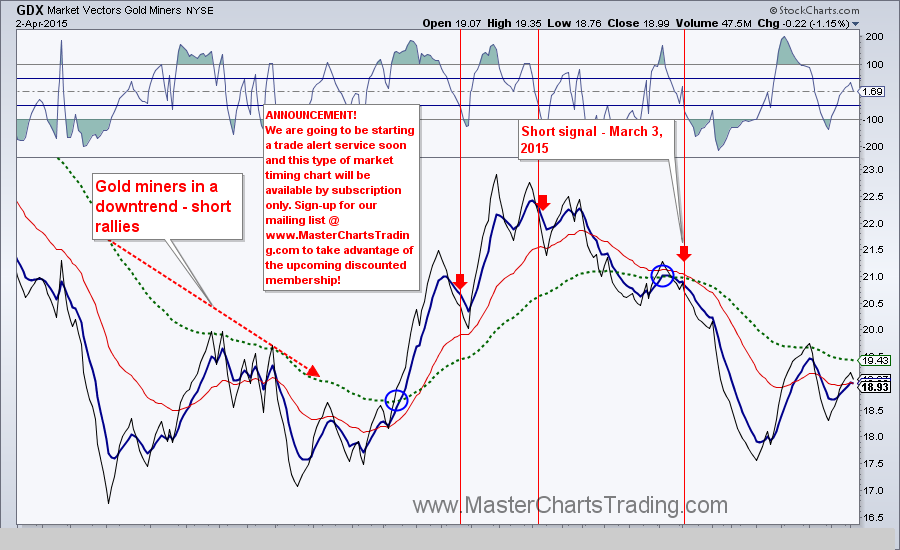
GDX – the gold miners ETF, is following gold in its footsteps, albeit in a more volatile fashion. GDX bounced from the resistance level around $20, but did manage to close the gap from the early March. Again, no short signal for now. Unless you are doing mini-swings on the 10 minute charts, which we may offer once our trade alert service starts soon.
Gold charts are located here

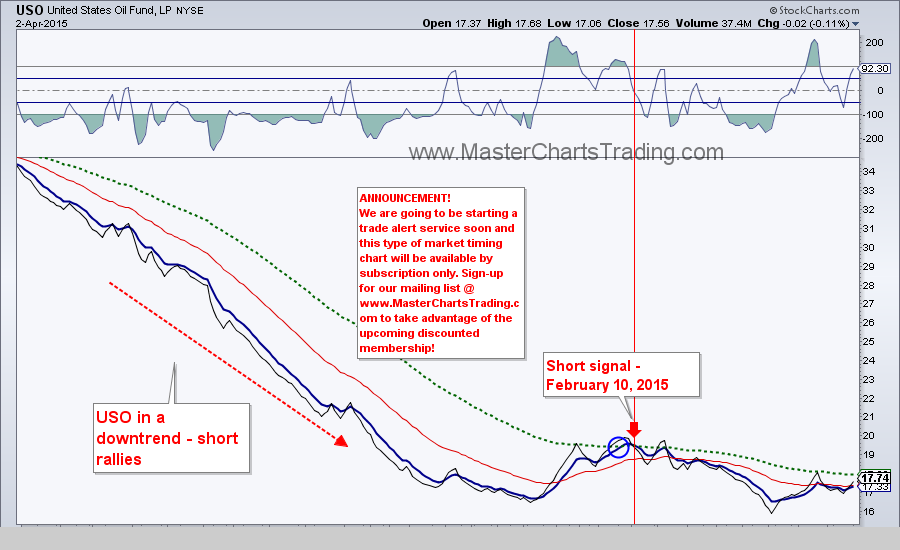
Oil is meandering in the $48-50 area following a sharp rebound from the broken support. West Texas Intermediate (WTIC) is testing the overhead resistance from the 50-day EMA. So far WTIC has failed the 50-day EMA 3 times, maybe 4th time is the charm and it will rebound substantially? Hard to tell. All I know oil is bearish and it makes more sense for me to short the rallies.
Finally, natural gas (NATGAS) broke a trend line defining the pennant formation. As with oil, any substantial rebound from here may present as a nice shorting opportunity, once the short trigger is hit.
Commodities charts located here
Finally, natural gas (NATGAS) broke a trend line defining the pennant formation. As with oil, any substantial rebound from here may present as a nice shorting opportunity, once the short trigger is hit.
Commodities charts located here


That’s it for this week’s market recap,
Best Regards and have another great trading week!
** Special Announcement**
We are weeks away from launching a stocks alert service. Please sign-up for our mailing list to be the first to take advantage of the discounted membership!
Alexander Berger (www.MasterChartsTrading.com)
Disclaimer, we have:
Open positions: TLT, SPY (cut exposure), IYR, XLU, ERY, LULU
New position:
Closed position:


 RSS Feed