Friday, April 4, 2014 (Weekly Commentary)
Failed Breakout in Large Caps. Weekly Commentary
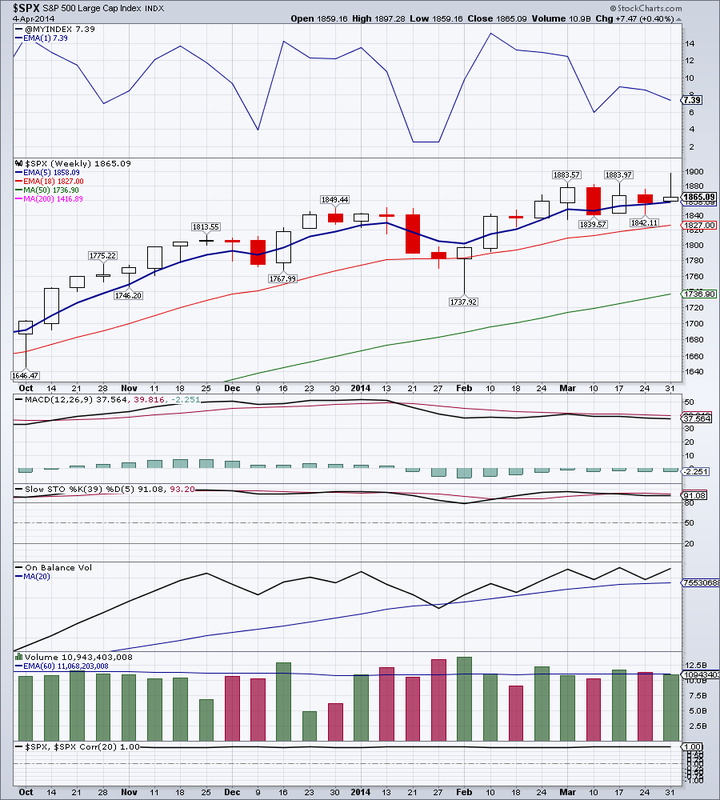
S&P 500 started the week strong, but the breakout above 1884 failed. Friday was an especially bad day for the NASDAQ and the Russell 2000. IWM lost 2.31 percent on large volume, but QQQ got demolished with a 2.66 percent loss on over 3 times the average volume! Of note was the fact that QQQ closed below its March low. QQQ is now likely to retest its February low.
Market Breadth Index, the $VMBI, is still positive. Should QQQ rally from here, we are cautiously optimistic.
TLT printed what appears to be a doji shooting star on a weekly chart, indicating indecision. But looking at the daily chart of TLT, we can clearly see higher lows and higher highs being made. Friday action was also telling - TLT gained almost 3/4 of a percent on good volume.
Gold is looking good on daily charts, but even better on weekly charts. On the weekly chart gold printed a hammer candlestick - a sign of possible reversal.
GDX tends to front run the underlying commodity. It printed an inside week. A close above $25.22 would confirm the upside strength in GDX. Coincidentally, this would also mean that GDX would close above its 50 Day moving average - also a bullish development.
IYR is pushing higher - probably being helped by expectations of lower interest rates ahead.
Oil reaffirmed support in the $98. It is likely going to retest the late March high at $102.24
Natural gas may have found temporarily support at $4.22 area. A close below $4.22 would almost certainly cause a retest of 200 DMA, currently at $4.03
Bottom line: large caps are still holding up, but money is rotating into safety assets.
Open positions: GDX, NUGT, IYR, TLT, ETV, DVY, EEM
Hedging positions: DGAZ
Failed Breakout in Large Caps. Weekly Commentary
S&P 500 started the week strong, but the breakout above 1884 failed. Friday was an especially bad day for the NASDAQ and the Russell 2000. IWM lost 2.31 percent on large volume, but QQQ got demolished with a 2.66 percent loss on over 3 times the average volume! Of note was the fact that QQQ closed below its March low. QQQ is now likely to retest its February low.
Market Breadth Index, the $VMBI, is still positive. Should QQQ rally from here, we are cautiously optimistic.
TLT printed what appears to be a doji shooting star on a weekly chart, indicating indecision. But looking at the daily chart of TLT, we can clearly see higher lows and higher highs being made. Friday action was also telling - TLT gained almost 3/4 of a percent on good volume.
Gold is looking good on daily charts, but even better on weekly charts. On the weekly chart gold printed a hammer candlestick - a sign of possible reversal.
GDX tends to front run the underlying commodity. It printed an inside week. A close above $25.22 would confirm the upside strength in GDX. Coincidentally, this would also mean that GDX would close above its 50 Day moving average - also a bullish development.
IYR is pushing higher - probably being helped by expectations of lower interest rates ahead.
Oil reaffirmed support in the $98. It is likely going to retest the late March high at $102.24
Natural gas may have found temporarily support at $4.22 area. A close below $4.22 would almost certainly cause a retest of 200 DMA, currently at $4.03
Bottom line: large caps are still holding up, but money is rotating into safety assets.
Open positions: GDX, NUGT, IYR, TLT, ETV, DVY, EEM
Hedging positions: DGAZ


 RSS Feed