Master Charts Trading - Stock Market Indicators & Trade Alerts
Connect To Us!
  • MasterChartsTrading
  • Blog
  • Sign-Up
  • Members
    • Elite Trading Blog
    • Stock Speculator Blog
    • Training Library >
      • Basics of Trading
      • Risk & Trading Psych
      • Trend Identification
  • Help
    • Hall of Fame
    • Social
    • About Us
    • Contact
    • FAQs
    • Disclaimer
    • Refund Policy
    • Privacy Policy
    • What We Trade
    • Newsletter samples

Are we out of the woods?

2/11/2014

0 Comments


Rebound continued today.

NASDAQ is still the leader, albeit on rather low volume. In fact, during this 4 day rebound OBV (on balance volume indicator) confirmed only NASDAQ as being back in the bullish phase.


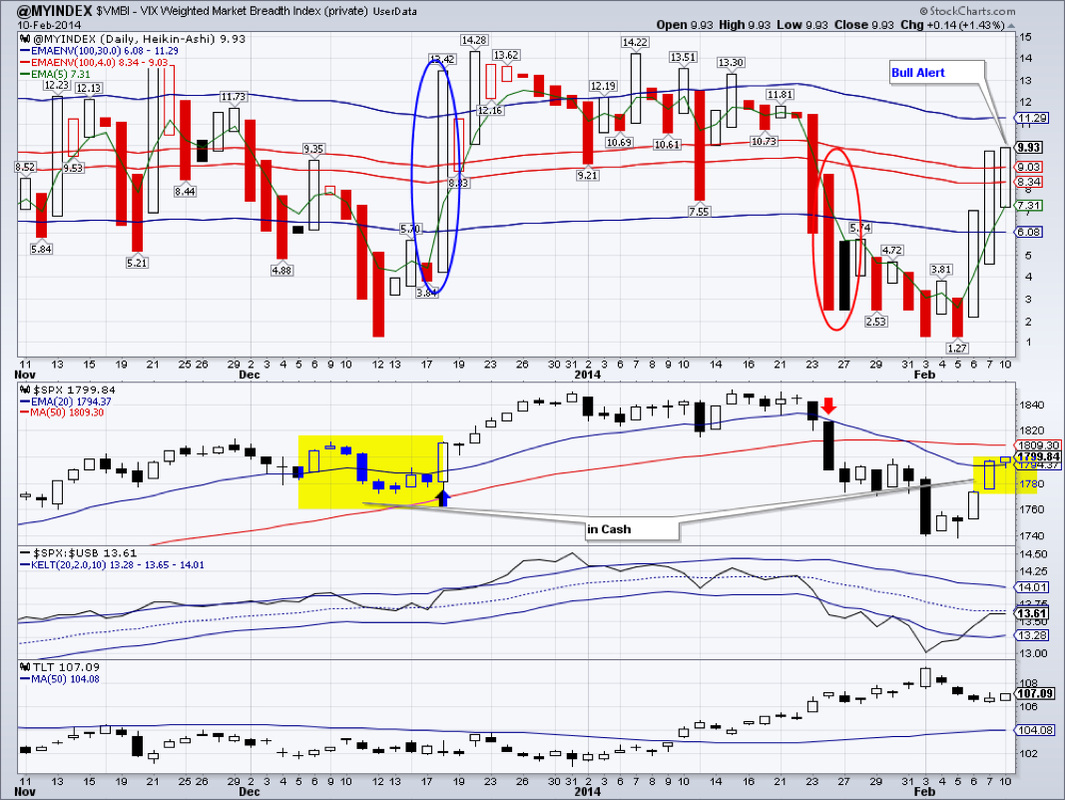
We are at an important juncture this week. Ideally we would like to see a decisive close above 1809 for $SPX (its 50 DMA) this week. This event would likely cause our market breadth index to flip into bull mode. It is currently in a bull alert mode.


A nagging concern remains the long duration treasuries. TLT firmed further today. A close below 106.25 (200 DMA) may cause a bond sell-off, and by extension, a rally in stock markets. While a close above 109.34 would be very bullish for TLTs and bearish for the markets.


IYR might be breaking out of the cup and handle formation to the upside. A measured move to around $70 would be very possible if cup and handle pans out.


A similar cup and handle breakout may be unfolding in GDX. If true, then a move to around $28.5 is possible. GDX is tied to the price of gold and its no surprise that $GOLD has been gaining steadily lately. A decisive close above $1279.80 could easily trigger a run to the next resistance level at $1361.80.


We are long: TLT, GDX, IYR


Picture
Ready to trade? Sign-up Today
0 Comments


Leave a Reply.

    Picture
    Picture
    Subscribe to our mailing list!
    Picture
    Picture

    Archives

    February 2023
    January 2023
    December 2022
    November 2022
    October 2022
    September 2022
    August 2022
    July 2022
    June 2022
    May 2022
    April 2022
    March 2022
    February 2022
    January 2022
    December 2021
    November 2021
    October 2021
    September 2021
    August 2021
    July 2021
    June 2021
    May 2021
    April 2021
    March 2021
    February 2021
    January 2021
    December 2020
    November 2020
    October 2020
    September 2020
    August 2020
    July 2020
    June 2020
    May 2020
    April 2020
    March 2020
    February 2020
    January 2020
    December 2019
    November 2019
    October 2019
    September 2019
    August 2019
    July 2019
    June 2019
    May 2019
    April 2019
    March 2019
    February 2019
    January 2019
    December 2018
    November 2018
    October 2018
    September 2018
    August 2018
    July 2018
    June 2018
    May 2018
    April 2018
    March 2018
    February 2018
    January 2018
    December 2017
    November 2017
    October 2017
    September 2017
    August 2017
    July 2017
    June 2017
    May 2017
    April 2017
    March 2017
    February 2017
    January 2017
    December 2016
    November 2016
    October 2016
    September 2016
    August 2016
    July 2016
    June 2016
    May 2016
    April 2016
    March 2016
    February 2016
    January 2016
    December 2015
    November 2015
    October 2015
    September 2015
    August 2015
    July 2015
    June 2015
    May 2015
    April 2015
    March 2015
    February 2015
    January 2015
    December 2014
    November 2014
    October 2014
    September 2014
    August 2014
    June 2014
    May 2014
    April 2014
    March 2014
    February 2014
    January 2014

    RSS Feed

  All information on MasterChartsTrading.com is for educational and entertainment purposes only, and should not be construed as a recommendation to buy, sell or sell-short said securities. Read full disclaimer.