Master Charts Trading - Stock Market Indicators & Trade Alerts
Connect To Us!
  • MasterChartsTrading
  • Blog
  • Sign-Up
  • Members
    • Elite Trading Blog
    • Stock Speculator Blog
    • Training Library >
      • Basics of Trading
      • Risk & Trading Psych
      • Trend Identification
  • Help
    • Hall of Fame
    • Social
    • About Us
    • Contact
    • FAQs
    • Disclaimer
    • Refund Policy
    • Privacy Policy
    • What We Trade
    • Newsletter samples

Blue Chips Hang On. Relief Rally is Possible in $QQQ

4/8/2014

0 Comments


Tuesday April 8, 2014

Blue Chips Hang On. Relief Rally is Possible in $QQQ.

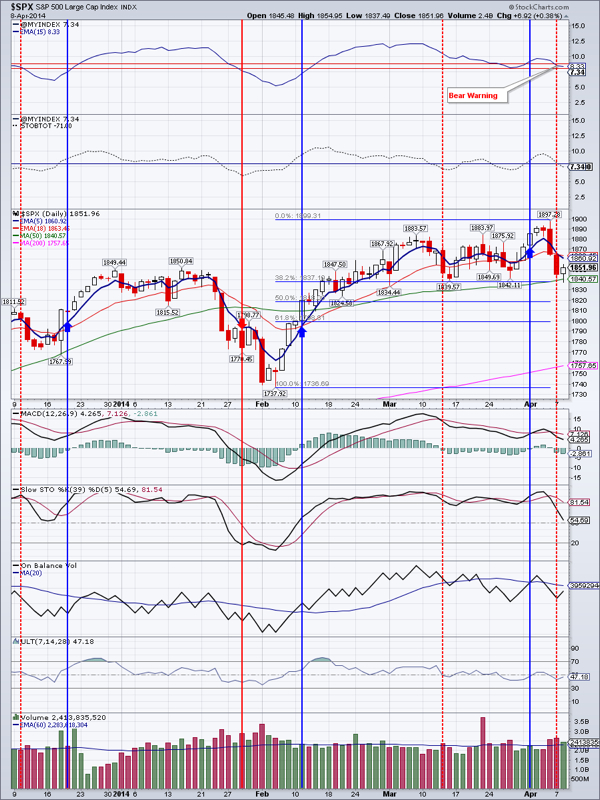
  The Dow and $SPX managed to stay above the 50 day moving average (DMA) and printed hammer candlesticks. This indicates that some buyers are returning to the markets. NASDAQ has been in a downtrend since the beginning of March making lower lows and lower highs. NASDAQ has now become rather oversold so a rally to the 50 DMA is not out of the question.

  Market Breadth Index, the $VMBI, continues to be in Bear Warning. In the past there were instances of Bear Warning not dropping into Bear Confirmation and the markets rebounding. The $VIX has spiked somewhat and since $VMBI stands for VIX Market Breadth Index, it is dragging the market breadth down. Should VIX drop, a rebound rally is very likely.

  TLT gained about a quarter of a percent, albeit on rather small volume. TLT just had a bullish MACD crossover, so more upside is likely. This would be bearish for the stocks.

  EEM again retested the late December high at $41.85 and managed to close above that level today on high volume. More upside is likely. The topping candle from April 4 is still in play though and I would like to see the price close above $42.13

  Gold bounced off the 50 DMA and closed just below at $1308. Depending how one looks at the daily gold chart, one could see either a rising wedge (bearish pattern) or a rebound from 50 percent Fibonacci retracement (bullish pattern). I tend to see the latter and a close above the 50 DMA would further land credence to this.

  GDX pattern is very similar to that of gold, but it is slightly more bullish.

  IYR closed above early March resistance at $68.59. IYR may be tracing out a saucer pattern and a measured move to around $70.89 is likely

  Oil gained 1.62 percent to close above late March peak. This is bullish.

  Natural Gas is rebounding. We will stop out our DGAZ position should gas close above $4.59.

 Bottom line: Markets look precarious, but rebound is likely

  Open positions: GDX, NUGT, IYR, TLT

  Hedging positions: DGAZ, UVXY

Picture
Ready to trade? Sign-up Today
0 Comments


Leave a Reply.

    Picture
    Picture
    Subscribe to our mailing list!
    Picture
    Picture

    Archives

    February 2023
    January 2023
    December 2022
    November 2022
    October 2022
    September 2022
    August 2022
    July 2022
    June 2022
    May 2022
    April 2022
    March 2022
    February 2022
    January 2022
    December 2021
    November 2021
    October 2021
    September 2021
    August 2021
    July 2021
    June 2021
    May 2021
    April 2021
    March 2021
    February 2021
    January 2021
    December 2020
    November 2020
    October 2020
    September 2020
    August 2020
    July 2020
    June 2020
    May 2020
    April 2020
    March 2020
    February 2020
    January 2020
    December 2019
    November 2019
    October 2019
    September 2019
    August 2019
    July 2019
    June 2019
    May 2019
    April 2019
    March 2019
    February 2019
    January 2019
    December 2018
    November 2018
    October 2018
    September 2018
    August 2018
    July 2018
    June 2018
    May 2018
    April 2018
    March 2018
    February 2018
    January 2018
    December 2017
    November 2017
    October 2017
    September 2017
    August 2017
    July 2017
    June 2017
    May 2017
    April 2017
    March 2017
    February 2017
    January 2017
    December 2016
    November 2016
    October 2016
    September 2016
    August 2016
    July 2016
    June 2016
    May 2016
    April 2016
    March 2016
    February 2016
    January 2016
    December 2015
    November 2015
    October 2015
    September 2015
    August 2015
    July 2015
    June 2015
    May 2015
    April 2015
    March 2015
    February 2015
    January 2015
    December 2014
    November 2014
    October 2014
    September 2014
    August 2014
    June 2014
    May 2014
    April 2014
    March 2014
    February 2014
    January 2014

    RSS Feed

  All information on MasterChartsTrading.com is for educational and entertainment purposes only, and should not be construed as a recommendation to buy, sell or sell-short said securities. Read full disclaimer.