Master Charts Trading - Stock Market Indicators & Trade Alerts
Connect To Us!
  • MasterChartsTrading
  • Blog
  • Sign-Up
  • Members
    • Elite Trading Blog
    • Stock Speculator Blog
    • Training Library >
      • Basics of Trading
      • Risk & Trading Psych
      • Trend Identification
  • Help
    • Hall of Fame
    • Social
    • About Us
    • Contact
    • FAQs
    • Disclaimer
    • Refund Policy
    • Privacy Policy
    • What We Trade
    • Newsletter samples

Both Stocks and Bonds Gain

3/19/2014

0 Comments


Tuesday, March 18, 2014


Stocks and Bonds Gain

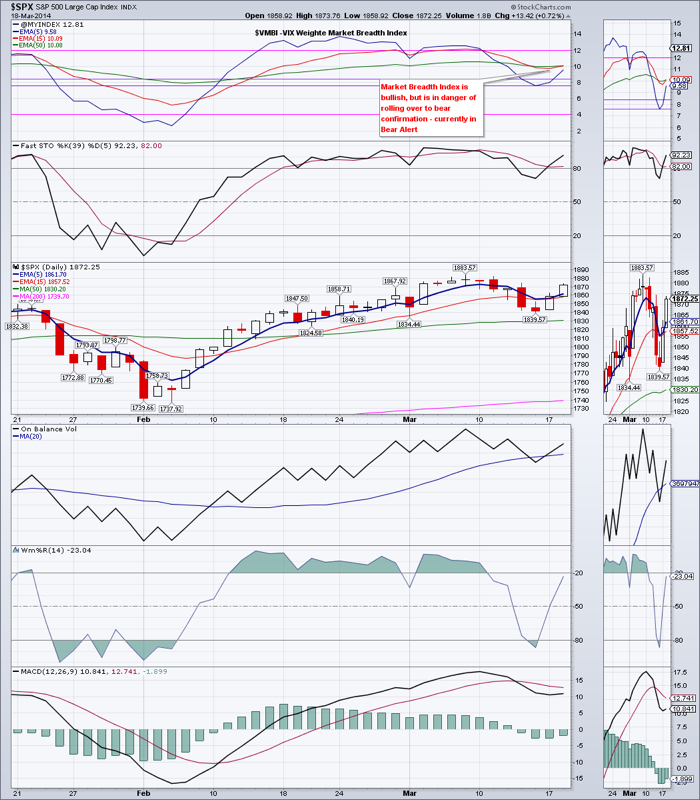
  Stocks continued their 3 day rebound lead by NASDAQ and the Small Caps. Should the Russell 2000 Small Cap index close above $1212.82, we will close our hedging positions. Market Breadth Index, the $VMBI, is signaling a possible continuation of the up-move that started in early February. Wednesday Federal Reserve statement should provide further clarity on market direction.

  TLT also gained. Which makes us wonder why in the face of a very strong show put on by the stock market, treasuries are refusing to drop? We believe it is because uncertainty and fear are very much alive and well in the markets and are expressing themselves via a demand for the United States Treasury Bonds. A close above $109.18 for TLT would continue this rally.

  Emerging markets also gained. As mentioned in the previous market commentary, we are waiting for a strong close above $40.22 or below $37.05 in EEM to shed the light on direction.

  Gold continued its loosing streak. There is decent support in the $1331 area. Should that give, next support is at the 200 day moving average (DMA), currently at $1302

  IYR is holding up well, but is still stuck in the trading range between $67.49-68.69. A close would indicate a re-test of early March high. A break down - and we are likely going to see the 50 DMA around $66

  Natural gas lost about a percent. We are likely going to see a retest of March 14 low at $4.341

  Oil may have found at least a temporary support. A close below $97.37 should cause further selling to the $91-92 area.


Open positions: GDX, IYR, TLT, DVY, ETV

Hedging positions: TZA, SDOW, DGAZ

Picture
Ready to trade? Sign-up Today
0 Comments


Leave a Reply.

    Picture
    Picture
    Subscribe to our mailing list!
    Picture
    Picture

    Archives

    June 2022
    May 2022
    April 2022
    March 2022
    February 2022
    January 2022
    December 2021
    November 2021
    October 2021
    September 2021
    August 2021
    July 2021
    June 2021
    May 2021
    April 2021
    March 2021
    February 2021
    January 2021
    December 2020
    November 2020
    October 2020
    September 2020
    August 2020
    July 2020
    June 2020
    May 2020
    April 2020
    March 2020
    February 2020
    January 2020
    December 2019
    November 2019
    October 2019
    September 2019
    August 2019
    July 2019
    June 2019
    May 2019
    April 2019
    March 2019
    February 2019
    January 2019
    December 2018
    November 2018
    October 2018
    September 2018
    August 2018
    July 2018
    June 2018
    May 2018
    April 2018
    March 2018
    February 2018
    January 2018
    December 2017
    November 2017
    October 2017
    September 2017
    August 2017
    July 2017
    June 2017
    May 2017
    April 2017
    March 2017
    February 2017
    January 2017
    December 2016
    November 2016
    October 2016
    September 2016
    August 2016
    July 2016
    June 2016
    May 2016
    April 2016
    March 2016
    February 2016
    January 2016
    December 2015
    November 2015
    October 2015
    September 2015
    August 2015
    July 2015
    June 2015
    May 2015
    April 2015
    March 2015
    February 2015
    January 2015
    December 2014
    November 2014
    October 2014
    September 2014
    August 2014
    June 2014
    May 2014
    April 2014
    March 2014
    February 2014
    January 2014

    RSS Feed

  All information on MasterChartsTrading.com is for educational and entertainment purposes only, and should not be construed as a recommendation to buy, sell or sell-short said securities. Read full disclaimer.