Friday, May 2, 2014 (Weekly Commentary)
Buy Signal on IWM.
Friday action was not particularly decisive, but we did get our short and intermediate-term buy signals on the small caps Russell 2000. We are playing it by purchasing TNA. Falling interest rates (rising bond prices) are a big concern. Coupled with a fact that we are entering the "Sell in May..." period, it could spell trouble for the stock market in the second part of May.
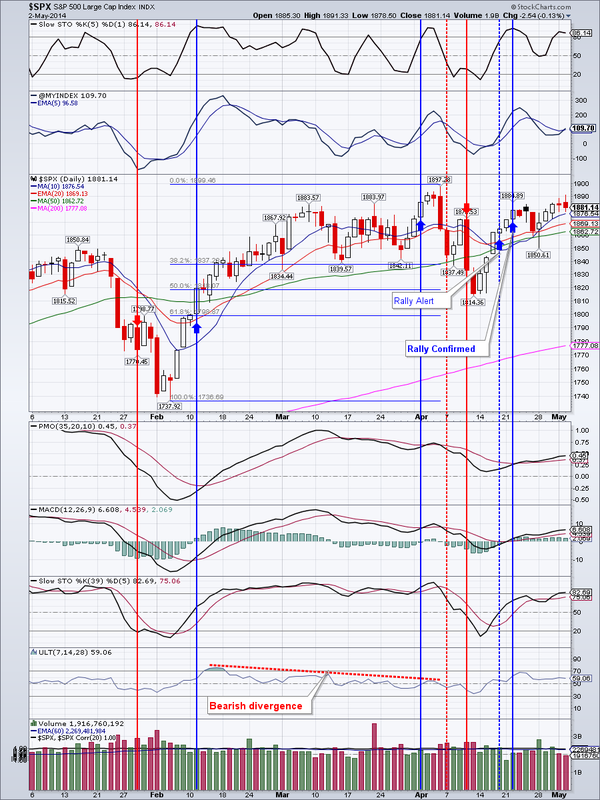
$SPX gained almost 1 percent for the week. It is coming up on resistance at around 1897. Good support is in the 1840-1850 area
TLT had a huge week and gained almost 1.5% on above average volume. My initial target from the week of May 24th was around $114-116. We may just see that soon.
Gold lost 0.22% for the week, but Friday's action has reaffirmed support in the $1270 area. Gold has tried to penetrate that level for 4 times in the past 2 month, yet buyers have stepped in on all occasions. A close above $1306 would further the bullish argument for gold.
GDX behaved very similar to gold. Good support is now at $23-23.50 area, and a close above the 200 day moving average (DMA) would be bullish.
EEM gained almost 2 percent for the week albeit on low volume. As I repeatedly mentioned, I think EEM will roll over and may retest the $39-40 area.
IYR is rapidly approaching May 2013 peak at $73.26. I expect some profit taking at that level, especially should bonds falter. There is some support $68.89.
Oil lost about 3/4 of a percent for the week, but I think it has found support in the $98 area and will rebound from here in the short term. However I feel that oil may have turned a corner and is heading down medium term.
Natural Gas gained about 3/4 of a percent. It's a mixed bag. It seems to be bullish long term, but may have run into resistance. It's currently at first support. Next support is at $4.61.
Open positions: TLT, IYR, EEM, NUGT, DIA, UGAZ, TNA (new)
Buy Signal on IWM.
Friday action was not particularly decisive, but we did get our short and intermediate-term buy signals on the small caps Russell 2000. We are playing it by purchasing TNA. Falling interest rates (rising bond prices) are a big concern. Coupled with a fact that we are entering the "Sell in May..." period, it could spell trouble for the stock market in the second part of May.
$SPX gained almost 1 percent for the week. It is coming up on resistance at around 1897. Good support is in the 1840-1850 area
TLT had a huge week and gained almost 1.5% on above average volume. My initial target from the week of May 24th was around $114-116. We may just see that soon.
Gold lost 0.22% for the week, but Friday's action has reaffirmed support in the $1270 area. Gold has tried to penetrate that level for 4 times in the past 2 month, yet buyers have stepped in on all occasions. A close above $1306 would further the bullish argument for gold.
GDX behaved very similar to gold. Good support is now at $23-23.50 area, and a close above the 200 day moving average (DMA) would be bullish.
EEM gained almost 2 percent for the week albeit on low volume. As I repeatedly mentioned, I think EEM will roll over and may retest the $39-40 area.
IYR is rapidly approaching May 2013 peak at $73.26. I expect some profit taking at that level, especially should bonds falter. There is some support $68.89.
Oil lost about 3/4 of a percent for the week, but I think it has found support in the $98 area and will rebound from here in the short term. However I feel that oil may have turned a corner and is heading down medium term.
Natural Gas gained about 3/4 of a percent. It's a mixed bag. It seems to be bullish long term, but may have run into resistance. It's currently at first support. Next support is at $4.61.
Open positions: TLT, IYR, EEM, NUGT, DIA, UGAZ, TNA (new)


 RSS Feed