Friday, February 28, 2014
Evidence Remains Bullish
This week S&P 500 and the Russell 2000 indexes closed at all time highs. The NASDAQ closed at the post-internet bubble high. The Dow lagged, but put on an impressive performance.
The question on many investors' minds is: "Is this going to continue?"
To answer this question we have to look at the evidence at hand.
First the positives:
1. The indices' stochastic oscillators are bullish
2. The On-Balance Volume indicators are bullish
3. Prices closed above the 4 and the 10 week exponential moving averages (eMA) on bullish candlesticks.
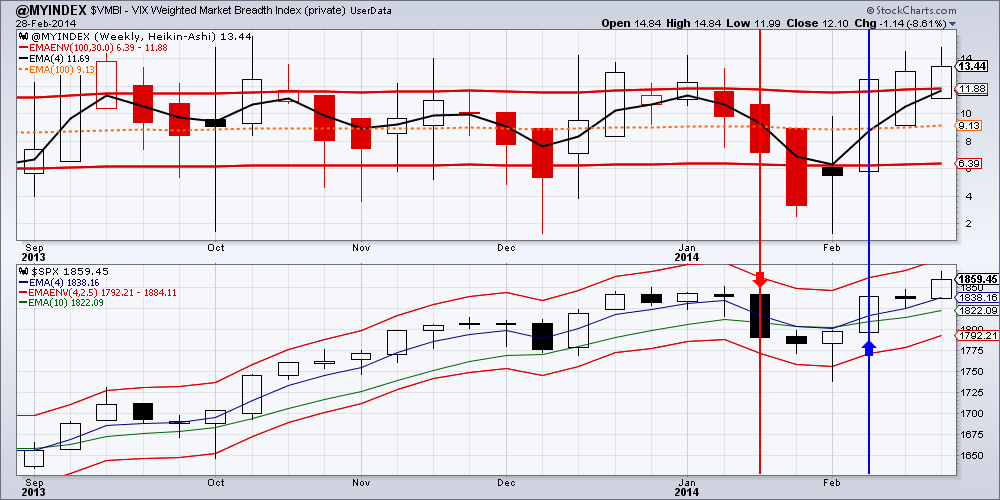
4. The $VMBI - VIX Weighted Market Breadth Index - see www.MasterChartsTrading.com, is showing a strongly bullish reading.
The negatives are:
1. Treasuries are gaining in price. This is a major concern. Next week we have a lot of economic reports, and a miss on any of them could send the bulls running for the exits. If TLT closes above $109.34 then a run to $113-$114 area is not out of the question.
2. Indices are entering overbought territory on the weekly charts. However this may not necessarily be considered a negative, since overbought and oversold readings can persist for prolonged periods of time.
Bottom line: we feel that there is more upside for the indices in the near future.
Emerging markets (EEM) managed to close above its 4 week eMA. It's still relatively weak though, and a close above 10 week eMA would be ideal to confirm this rally.
GDX lost a little over 3%. Gold closed marginally higher for the week. Should gold and the miners power through this weakness, a run to above $1361 in gold is very much possible. Otherwise a consolidation in the $1310-1340 range will likely continue.
Real Estate (IYR) closed above resistance dating back to October of last year. This is a bullish development.
Oil continued its bull run that started in January. We see no weakness in the momentum of oil yet.
Natural gas prices collapsed by over 25%! On the weekly charts a bearish engulfing pattern took shape. A rebound to $4.85-$5.10 area is likely, but it seems that a shift in direction of this commodity has taken place.
We are long: GDX, IYR, EVT, DVY, TLT
Evidence Remains Bullish
This week S&P 500 and the Russell 2000 indexes closed at all time highs. The NASDAQ closed at the post-internet bubble high. The Dow lagged, but put on an impressive performance.
The question on many investors' minds is: "Is this going to continue?"
To answer this question we have to look at the evidence at hand.
First the positives:
1. The indices' stochastic oscillators are bullish
2. The On-Balance Volume indicators are bullish
3. Prices closed above the 4 and the 10 week exponential moving averages (eMA) on bullish candlesticks.
4. The $VMBI - VIX Weighted Market Breadth Index - see www.MasterChartsTrading.com, is showing a strongly bullish reading.
The negatives are:
1. Treasuries are gaining in price. This is a major concern. Next week we have a lot of economic reports, and a miss on any of them could send the bulls running for the exits. If TLT closes above $109.34 then a run to $113-$114 area is not out of the question.
2. Indices are entering overbought territory on the weekly charts. However this may not necessarily be considered a negative, since overbought and oversold readings can persist for prolonged periods of time.
Bottom line: we feel that there is more upside for the indices in the near future.
Emerging markets (EEM) managed to close above its 4 week eMA. It's still relatively weak though, and a close above 10 week eMA would be ideal to confirm this rally.
GDX lost a little over 3%. Gold closed marginally higher for the week. Should gold and the miners power through this weakness, a run to above $1361 in gold is very much possible. Otherwise a consolidation in the $1310-1340 range will likely continue.
Real Estate (IYR) closed above resistance dating back to October of last year. This is a bullish development.
Oil continued its bull run that started in January. We see no weakness in the momentum of oil yet.
Natural gas prices collapsed by over 25%! On the weekly charts a bearish engulfing pattern took shape. A rebound to $4.85-$5.10 area is likely, but it seems that a shift in direction of this commodity has taken place.
We are long: GDX, IYR, EVT, DVY, TLT


 RSS Feed