Master Charts Trading - Stock Market Indicators & Trade Alerts
Connect To Us!
  • MasterChartsTrading
  • Blog
  • Sign-Up
  • Members
    • Elite Trading Blog
    • Stock Speculator Blog
    • Training Library >
      • Basics of Trading
      • Risk & Trading Psych
      • Trend Identification
  • Help
    • Hall of Fame
    • Social
    • About Us
    • Contact
    • FAQs
    • Disclaimer
    • Refund Policy
    • Privacy Policy
    • What We Trade
    • Newsletter samples

Friday, March 13, 2015 Weekly Market Recap SPY, XLF, TLT, GLD, GDX,USO

3/13/2015

2 Comments

 
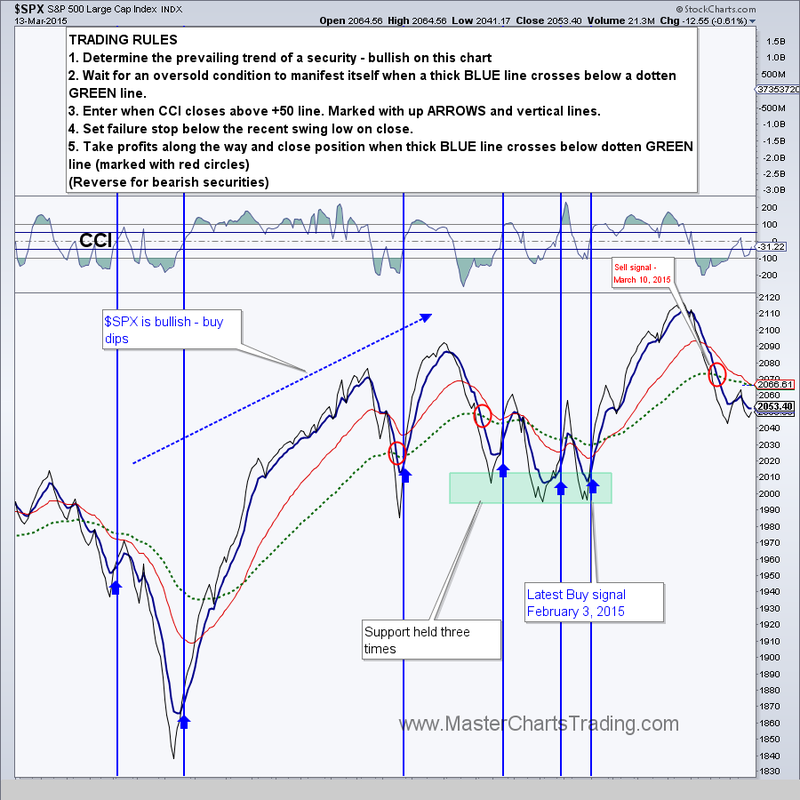
 Friday, March 13, 2015 Weekly Market Recap. Watch this video on YouTube here.

       The beauty of following a rules-based trading system is that it removes most of your own bias out of trading. We followed our own rules and exited the long position in SPY on March 10th. For now, we are letting cash sit on the sidelines while watching which way the market will head next. I am not yet convinced that this correction that started in in late February has run its course.

Picture
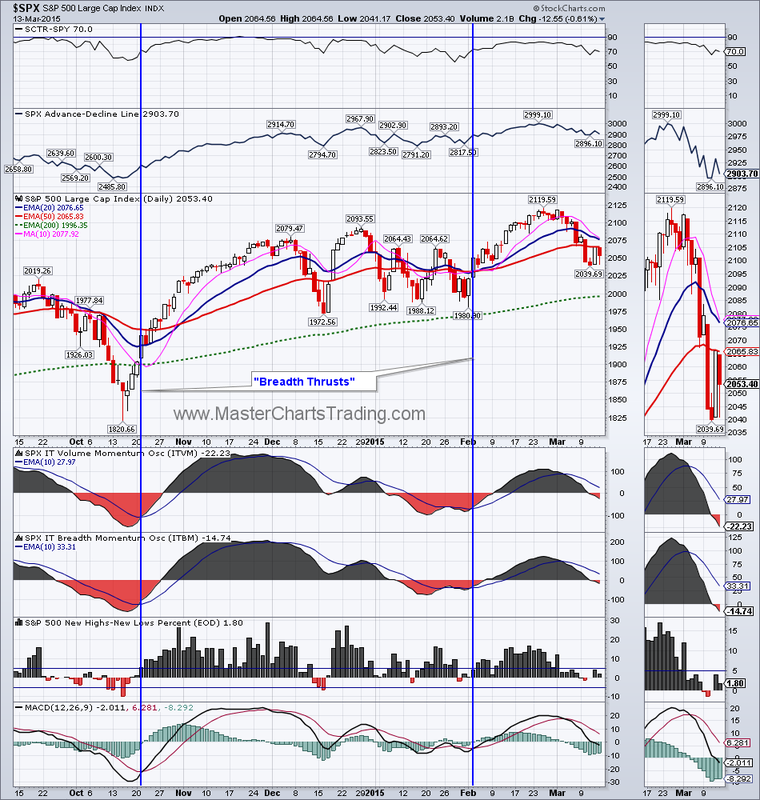
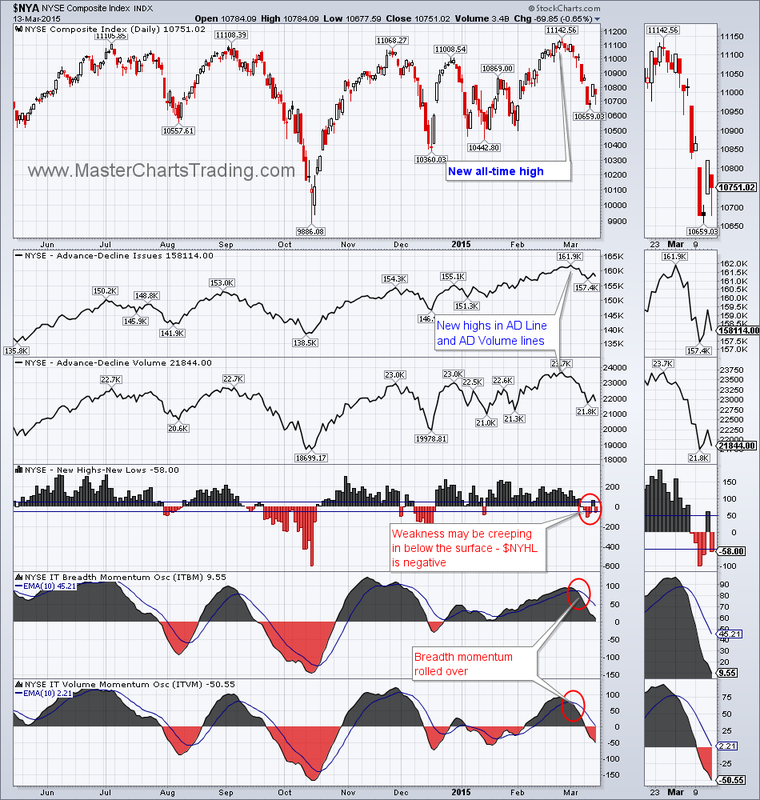
Market breadth has deteriorated further. The breadth momentum is still pointing lower and hasn’t begun to rise. While NYSE New Highs-New Lows indicator has dropped into negative territory and stayed there for most of this week – not a bullish sign at all. In the past similar readings first led to more downside before the uptrend resumed.
Picture
Picture
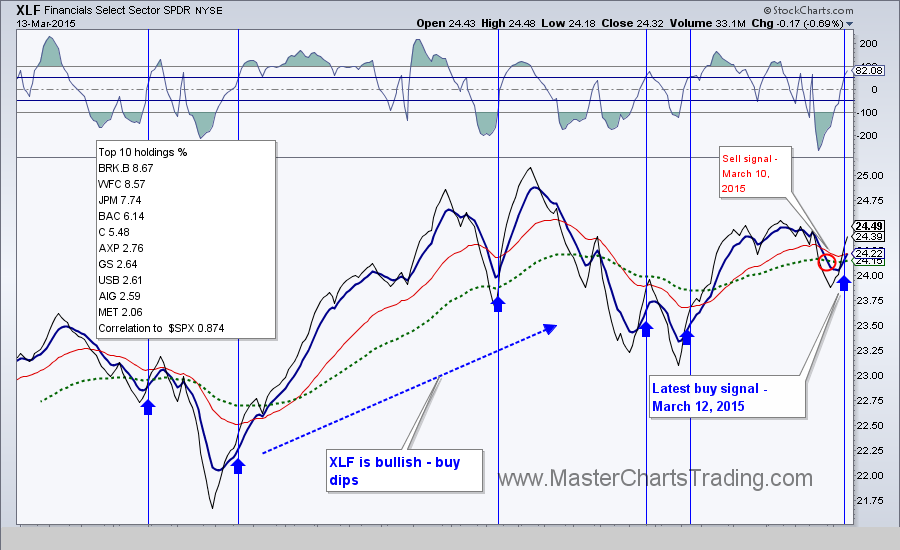
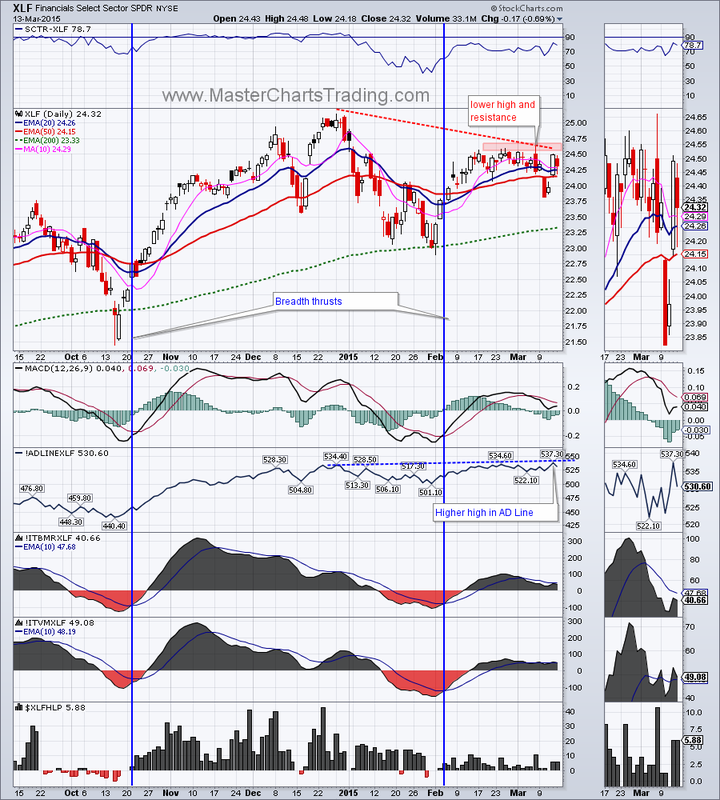
One sector that was a mixed bag for the past few months is the Financials sector. XLF put in a lower high on March 6th, dropped below the 50-day exponential moving average (EMA), but then popped right back up this Thursday. Friday’s action in XLF was not impressive, as it erased about half of the Thursday’s gains. Unless XLF follows through soon by breaking above the resistance in the $24.20 area, we may see it retest February lows. Our trading system did generate a buy signal for XLF on Thursday, but as I mentioned, so far there was no follow through.

Picture
Picture
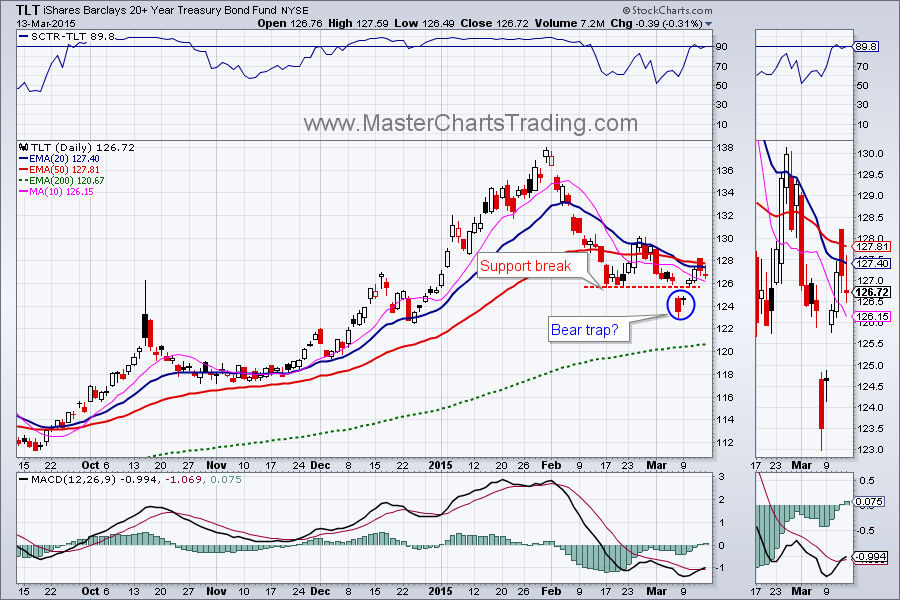
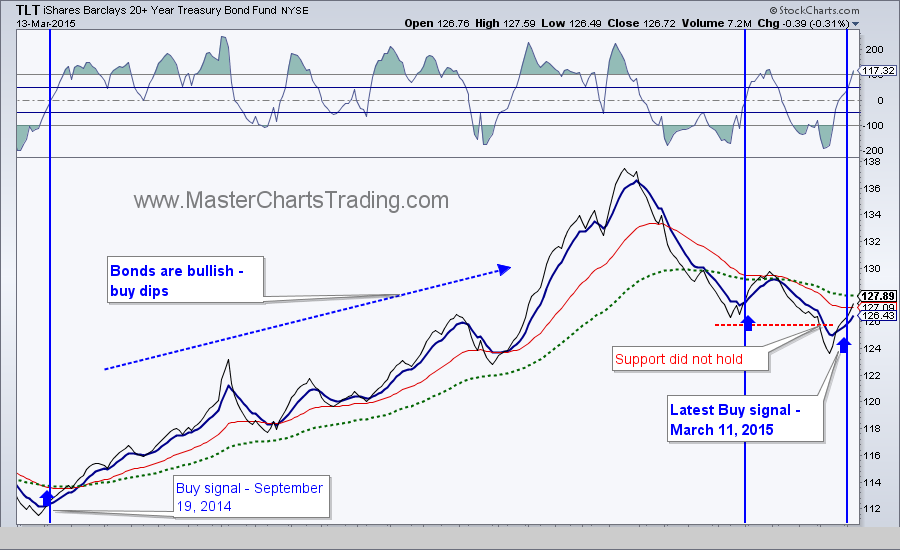
       Bonds gained for the week and we re-opened a position in TLT on March 11 per our trading system trigger signal. TLT may have sprung a bear trap with a quick move back above broken support. For now the buy signal is valid.

Picture
Picture
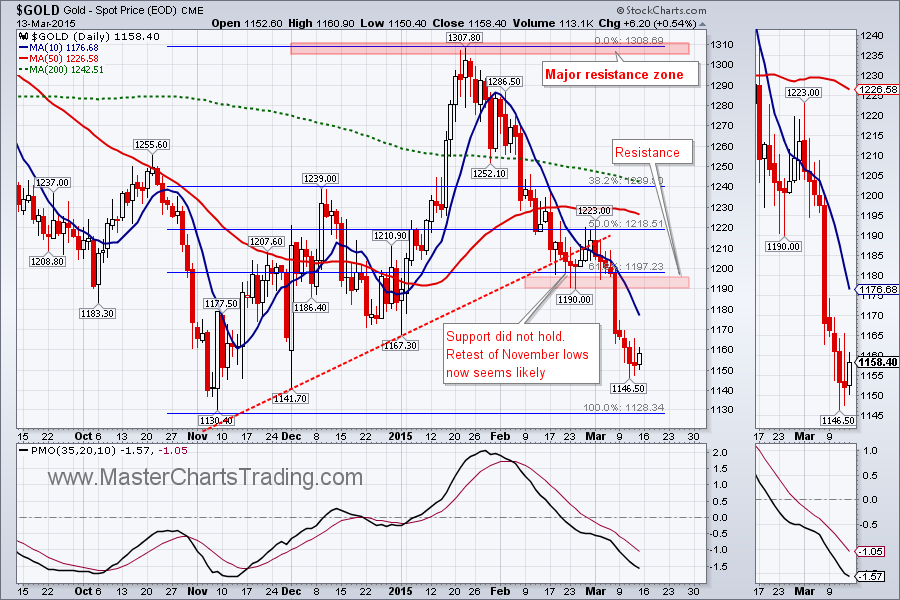
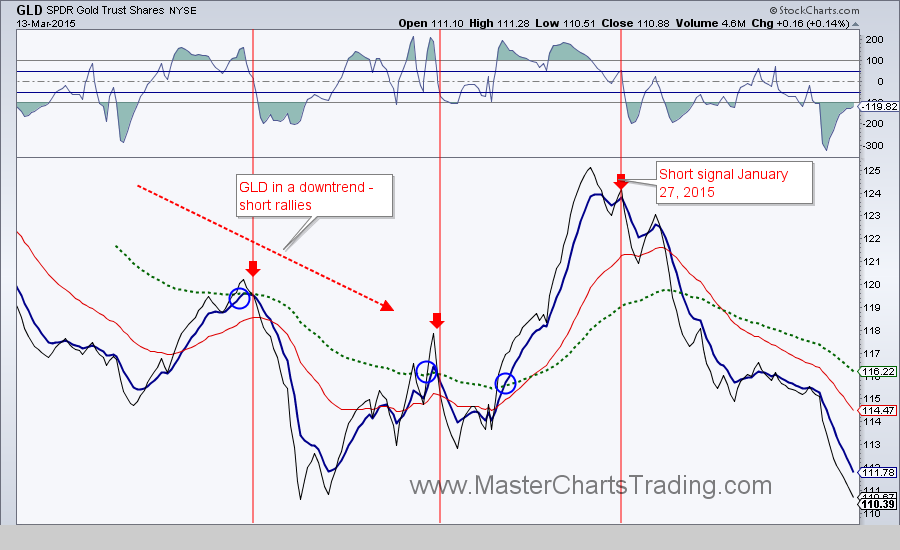
Gold is getting ready to re-test the November lows as it lost a little less than 1% this week. If the gold bulls are to make a stand, it should be soon; otherwise we will see new 52-week lows. A rebound to the $1200 area may provide a nice setup for a short trade.
Picture
Picture
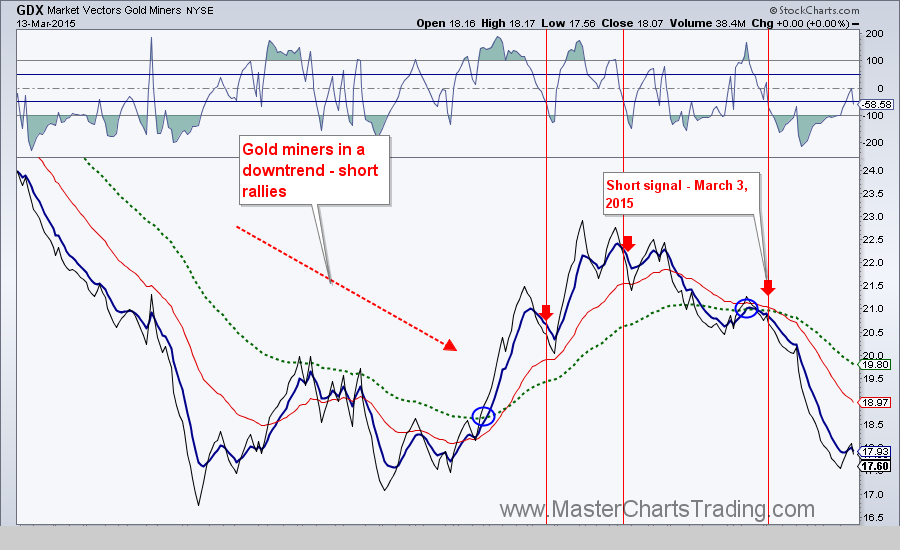
       GDX similarly was down almost 3% for the week. I see a few of the hammer type candlesticks with long tails on GDX chart, which indicates at least some buying pressure. Unless GDX fails here and move to new 52-week lows, I am guessing it should rebound $19-20 area. At that point I would be looking again to enter on the short side.

Picture
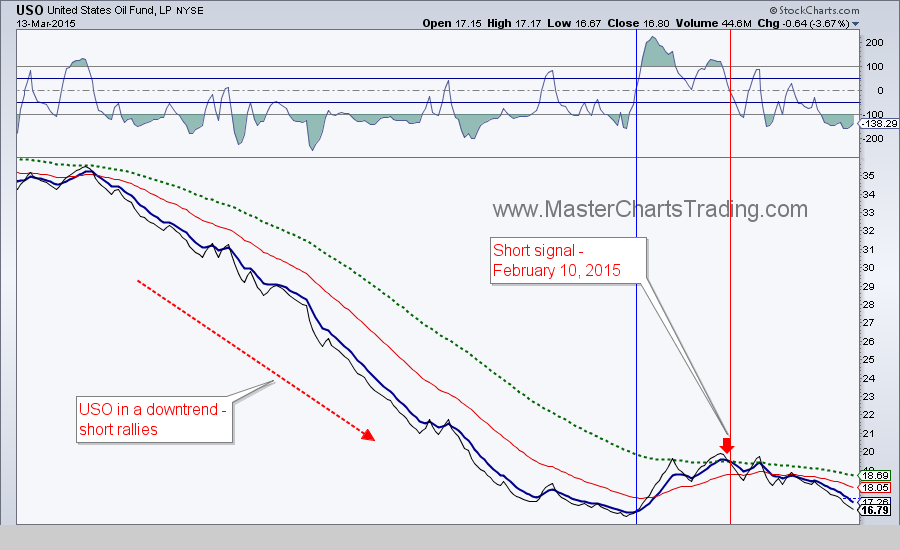
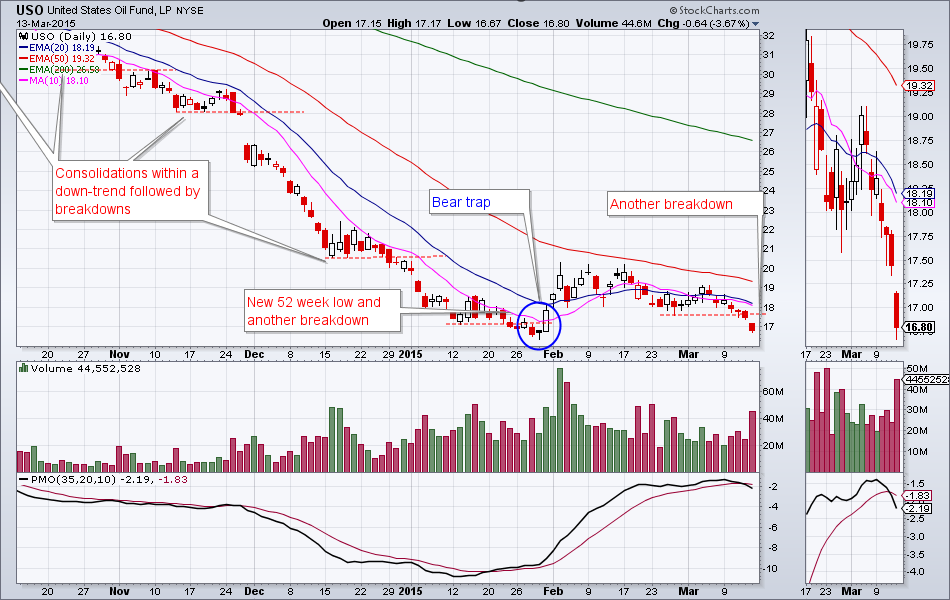
       Our system generated a short signal on USO as far back as February 10th. This week we finally saw a decisive break below support in oil and new lows are now looking more and more likely. We still have an open position in SCO.

Picture
Picture
That is it for this week’s recap!

Best Regards and have another great trading week!


Alexander Berger (www.MasterChartsTrading.com)

Disclaimer, we have:

Open positions: SCO

New position: TLT

Closed position: SPY

Ready to trade? Sign-up Today
2 Comments
Peter Green
3/13/2015 07:17:53 pm

Thanks very helpful overview. Currently shorting oil and the nasdaq. Do you have any opinions on volatility via the uvxy ticker? Currently under $20 though looking like it wants to break out again.

Reply
Alex link
3/14/2015 04:48:48 am

UVXY is very difficult to trade and analyze because it is a leveraged fund tied to $VIX futures. I don't see a good reason to trade it since one can much easier analyze and trade 3x leveraged funds tied to the S&P itself (SPXL, SPXU)

Reply


Leave a Reply.

    Picture
    Picture
    Subscribe to our mailing list!
    Picture
    Picture

    Archives

    January 2023
    December 2022
    November 2022
    October 2022
    September 2022
    August 2022
    July 2022
    June 2022
    May 2022
    April 2022
    March 2022
    February 2022
    January 2022
    December 2021
    November 2021
    October 2021
    September 2021
    August 2021
    July 2021
    June 2021
    May 2021
    April 2021
    March 2021
    February 2021
    January 2021
    December 2020
    November 2020
    October 2020
    September 2020
    August 2020
    July 2020
    June 2020
    May 2020
    April 2020
    March 2020
    February 2020
    January 2020
    December 2019
    November 2019
    October 2019
    September 2019
    August 2019
    July 2019
    June 2019
    May 2019
    April 2019
    March 2019
    February 2019
    January 2019
    December 2018
    November 2018
    October 2018
    September 2018
    August 2018
    July 2018
    June 2018
    May 2018
    April 2018
    March 2018
    February 2018
    January 2018
    December 2017
    November 2017
    October 2017
    September 2017
    August 2017
    July 2017
    June 2017
    May 2017
    April 2017
    March 2017
    February 2017
    January 2017
    December 2016
    November 2016
    October 2016
    September 2016
    August 2016
    July 2016
    June 2016
    May 2016
    April 2016
    March 2016
    February 2016
    January 2016
    December 2015
    November 2015
    October 2015
    September 2015
    August 2015
    July 2015
    June 2015
    May 2015
    April 2015
    March 2015
    February 2015
    January 2015
    December 2014
    November 2014
    October 2014
    September 2014
    August 2014
    June 2014
    May 2014
    April 2014
    March 2014
    February 2014
    January 2014

    RSS Feed

  All information on MasterChartsTrading.com is for educational and entertainment purposes only, and should not be construed as a recommendation to buy, sell or sell-short said securities. Read full disclaimer.