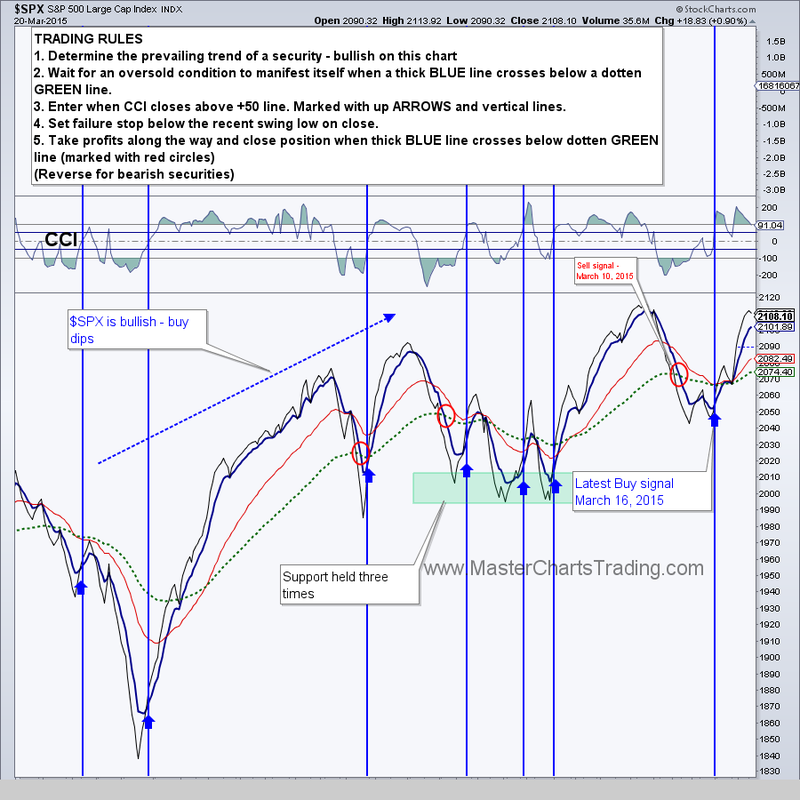
| Friday, March 20, 2015 Weekly Market Recap. SPECIAL ANNOUNCEMENT! We are weeks away from launching a stocks alert service. Please sign-up for our mailing list to be the first to take advantage of the discounted membership! Only 4 days after we closed our position in the S&P 500, an opportunity presented itself to re-enter the market. We did just that on this Monday, March 16th. Even before Janet Yellen delivered her statement, our charts registered sustained buying pressure in stocks. Following her statement, the stocks took off on a rally that continued through Friday. $SPX is up 2.66% for the week. | |
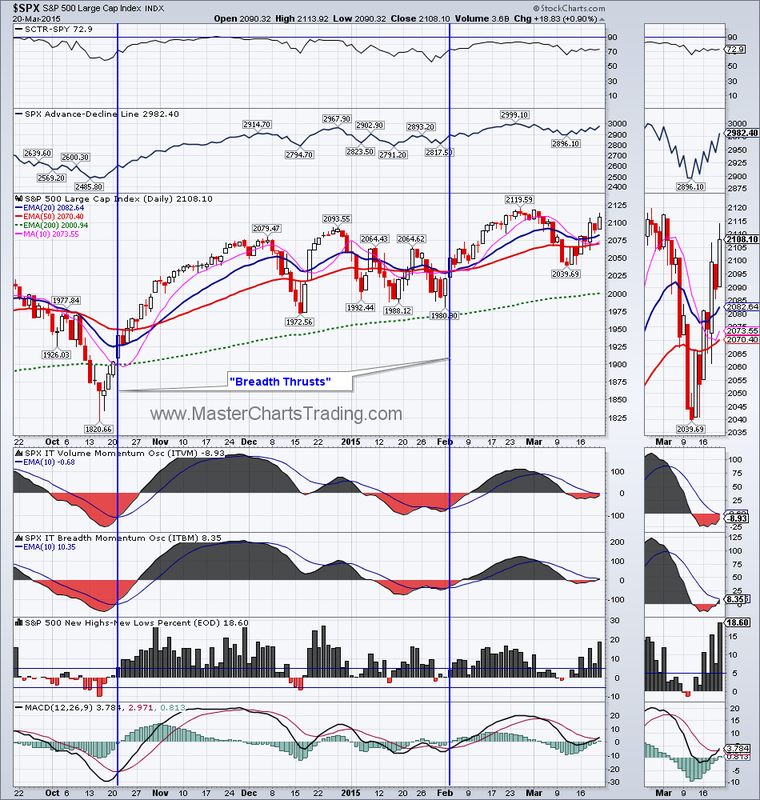
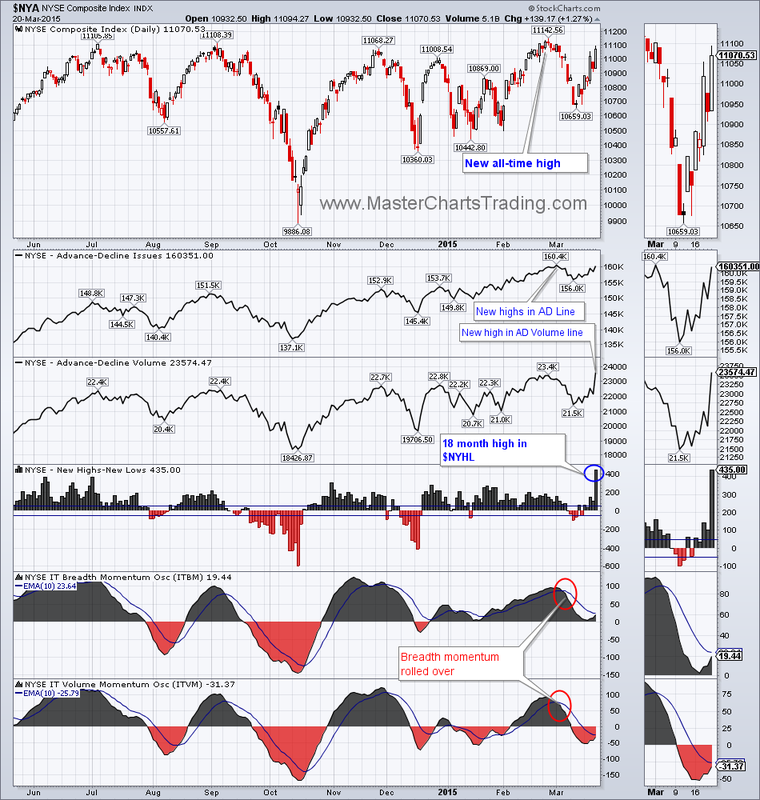
Market breadth remains good. For now I see now divergences in the Advance-Decline (AD) Lines of various indices. Also a rebound in oil related issues is the likely culprit behind the 18-month high reading in New Highs-New Lows indicator for the New York Stock Exchange Composite Index ($NYHL). This is a bullish sign for the general market.
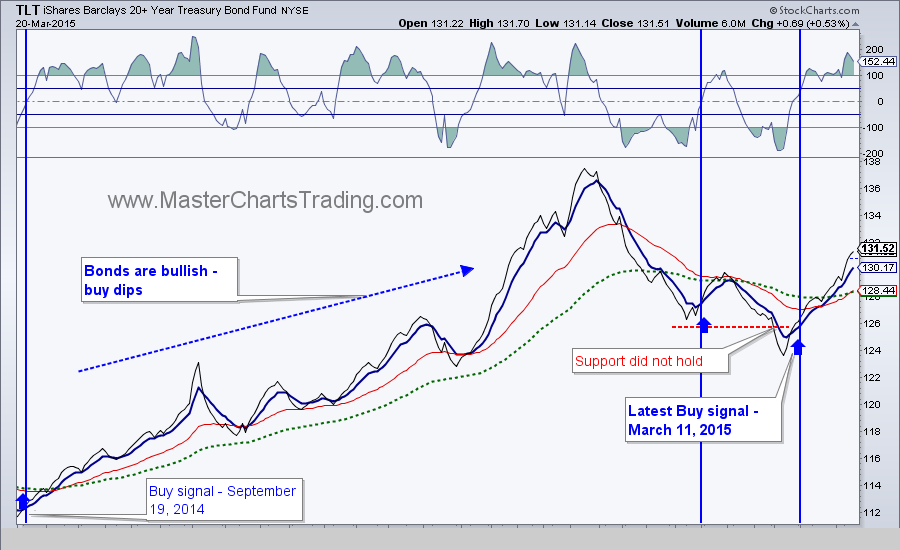
Bonds (TLT) reacted even more positively to the Fed remarks and are up 3.78% for the week. The strong bull market in bonds is alive and well and the oversold condition from the early March was an excellent buying opportunity for us – we re-entered TLT on March 11. Since then, TLT has cleared first resistance around $130 area and closed above this level on Friday - a positive sign.
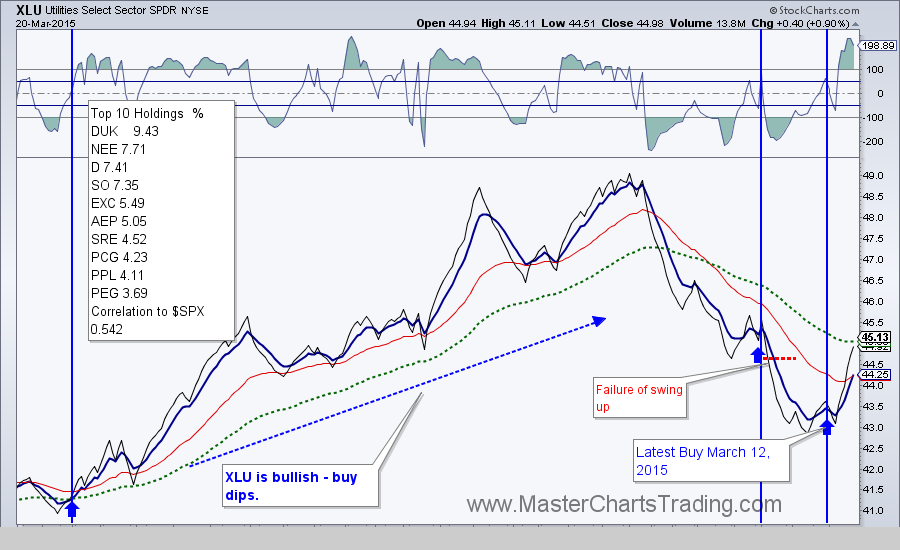
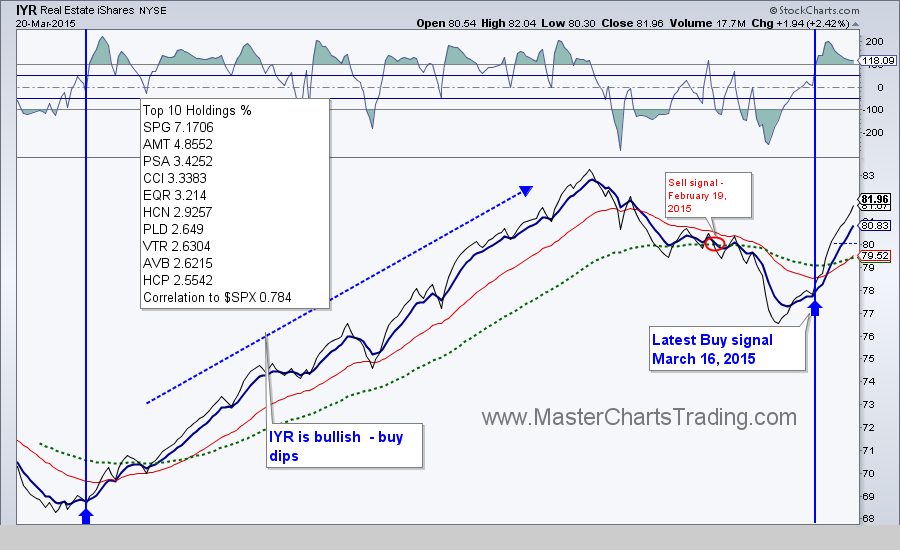
Gains in bonds translated into gains in the interest-sensitive sectors too. Both the Utilities (XLU) and the Real Estate (IYR) sectors are up 4.26% and 5.33% respectively for the week. We were able to open positions in XLU as far back as March 12th and in IYR on March 16th.
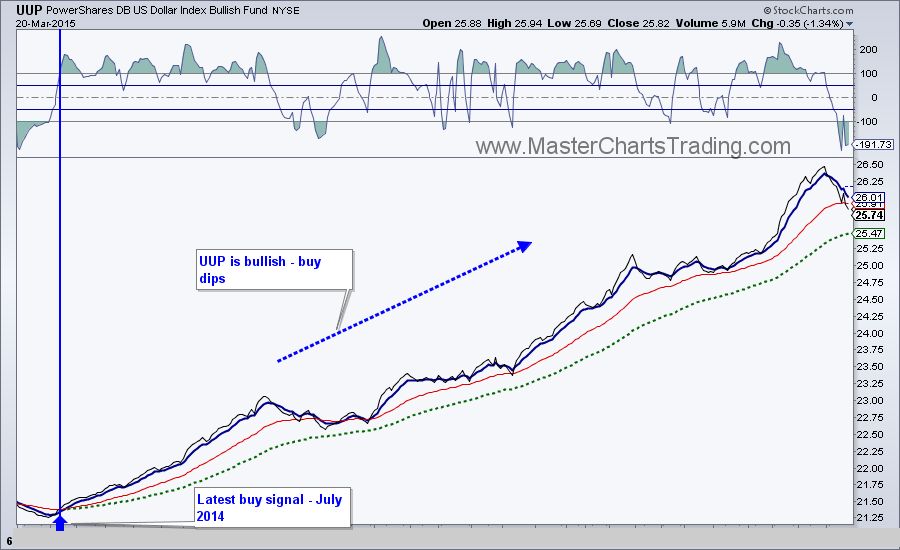
The dollar (UUP) backed off its recent highs, but remains firmly in its bull market. A retrace to around $25.20 area and a subsequent rebound may provide for an opportunity to partake in this uptrend in UUP. This needs to be confirmed on our charts of course.
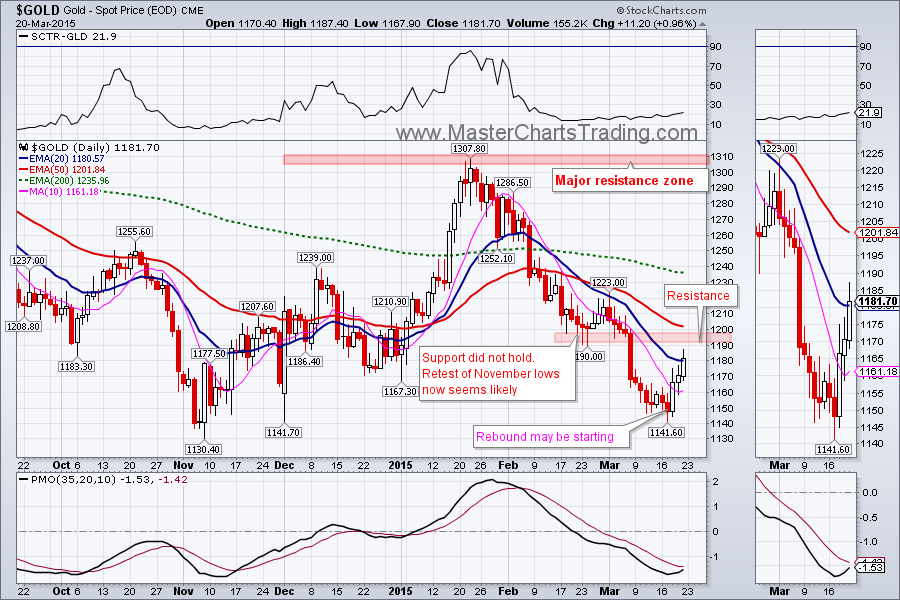
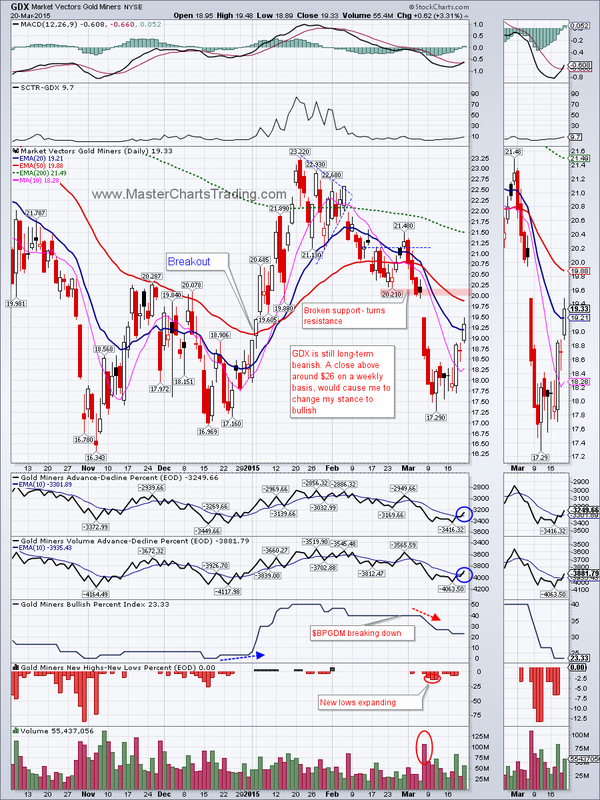
A long-awaited rebound in gold and gold miners is finally materializing. (Probably because of a relief in the dollar.) Gold is basically back to the 1st resistance level around $1190-$1200. This is still a bear market rally in my opinion. There are lots and lots of resistance levels overhead. If you were holding a short from the $1280 level, now would not be a bad place to cover some of it. Should gold continue to rise, then closes above around $1250 and then rolls over, I would consider shorting it again at that point. Gold chart and gold miners charts here
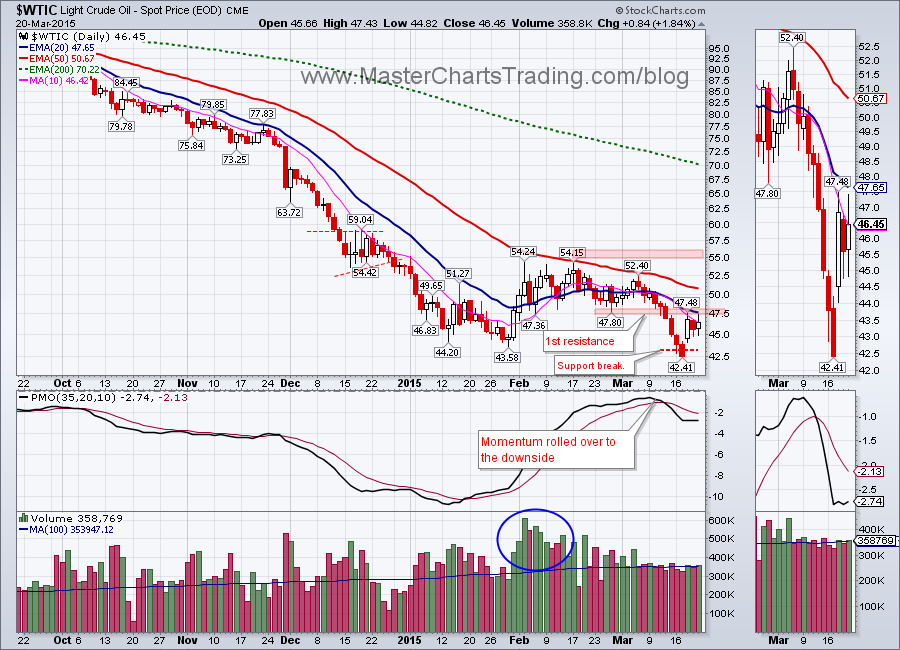
Oil (West Texas Intermediate) looked poised to continue lower as it closed below support on Tuesday @ $42.43, but it gapped up and rallied the next day. I will consider this retest of January lows a success for now.
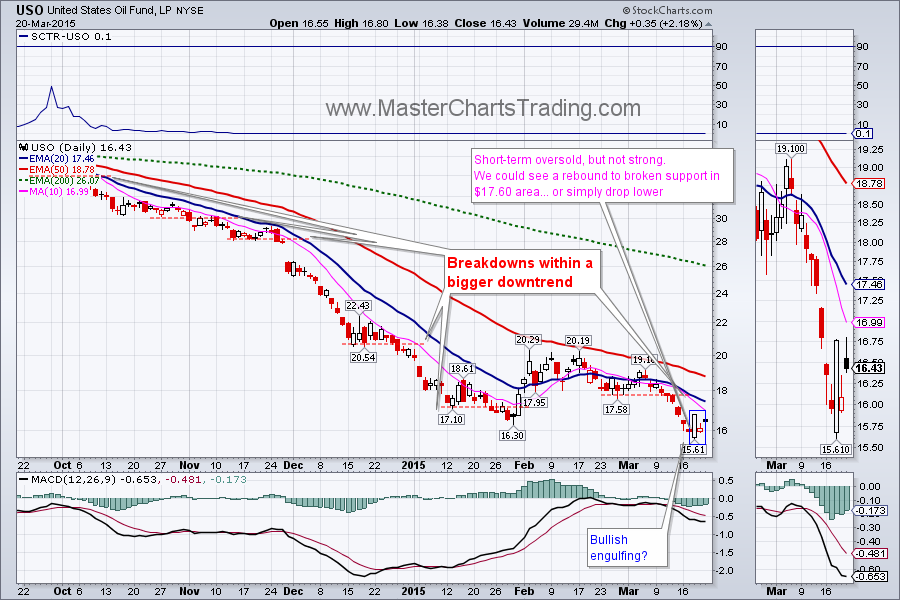
For the oil-tracking fund (USO), a possible Bullish Engulfing pattern may have taken place on March 17 and 18 (see chart below for the visual representation). A bullish engulfing pattern needs a confirmation soon after it takes place. So far it hasn’t happened. In fact we took advantage of the price drop in oil on to lock in around a 15% profit in our position in SCO (inverse oil ETF) on March 19th. We are still holding part of the SCO position in case oil drops lower. In case it doesn’t, we will cover once bullish engulfing is confirmed with price of USO closing above $16.76.

That is it for this week’s recap!
Best Regards and have another great trading week!
Alexander Berger (www.MasterChartsTrading.com)
Disclaimer, we have:
Open positions: SCO, TLT
New position: SPY, IYR, XLU, ALKS, TTPH, NEM
Closed position: took profits in SCO
Best Regards and have another great trading week!
Alexander Berger (www.MasterChartsTrading.com)
Disclaimer, we have:
Open positions: SCO, TLT
New position: SPY, IYR, XLU, ALKS, TTPH, NEM
Closed position: took profits in SCO


 RSS Feed