| www.MasterChartsTrading.com Friday, March 6 2015 Weekly Market Recap. The S&P 500 was down for the second week in a row. Friday’s losses contributed the most to the plunge, as $SPX fall almost 1.5% - on above average volume. We still have some of the position in SPY open that we entered on February 3rd, but we did take profits along the way. Watch on YouTube here | |
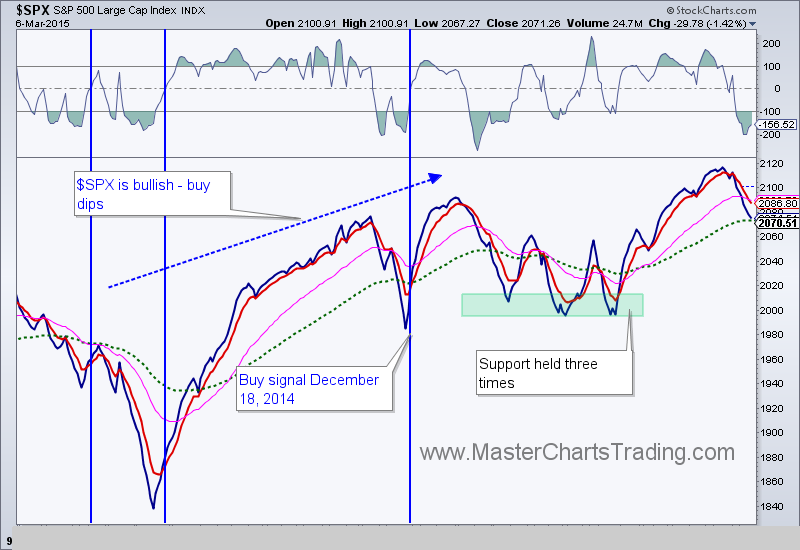
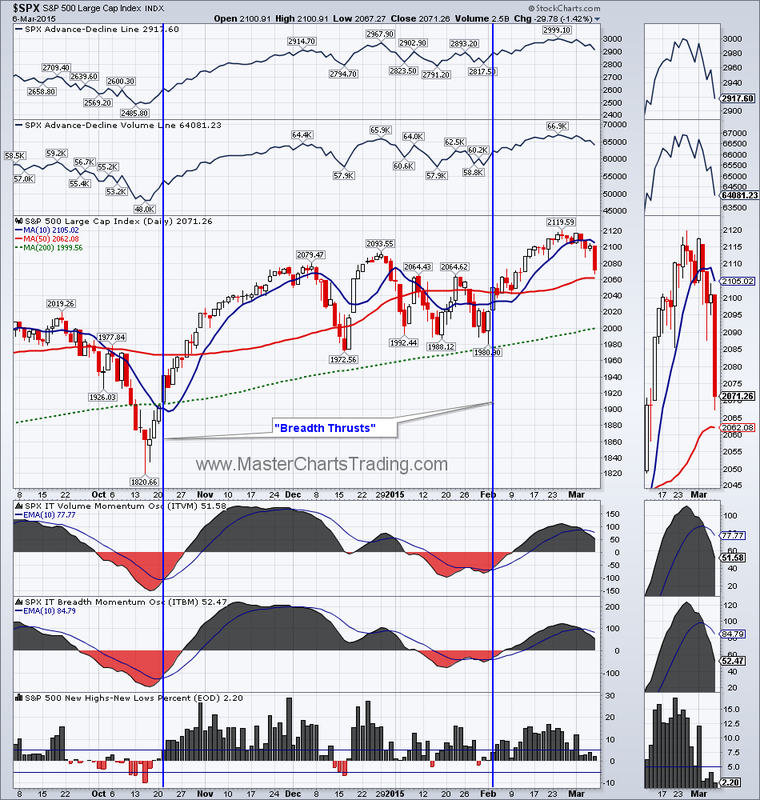
Market breadth deteriorated somewhat- this is to be expected – the run-up from February 2nd low was as much as 7% and in a steep manner. So far there is no divergences in the AD Lines and New Highs – New Lows Indicator is in still in the positive territory. The breadth momentum oscillators (ITBM and ITVM) rolled over below their 10-day exponential moving average, which is somewhat bearish. However the breadth momentum is still in the positive territory, which means we could still see new highs before the next washout.
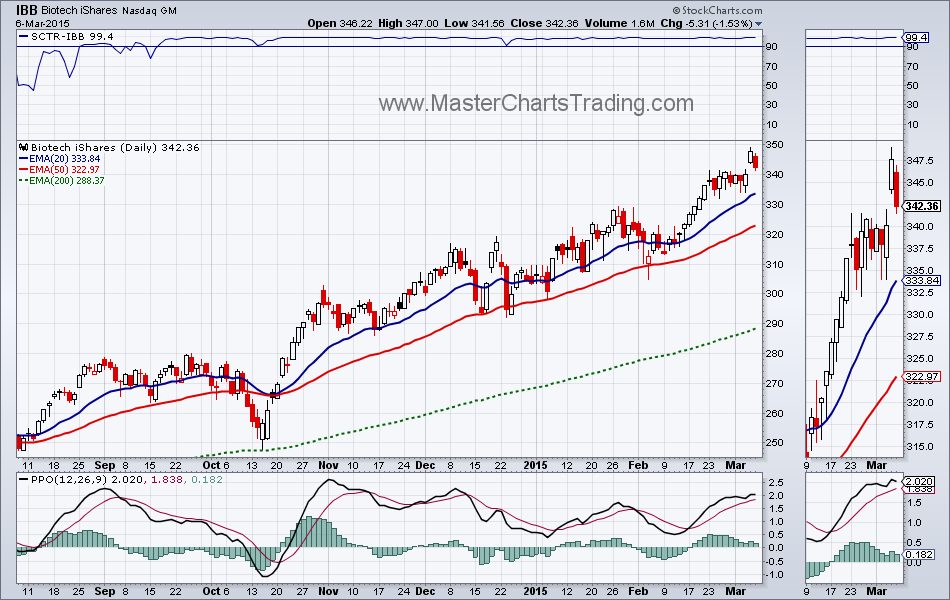
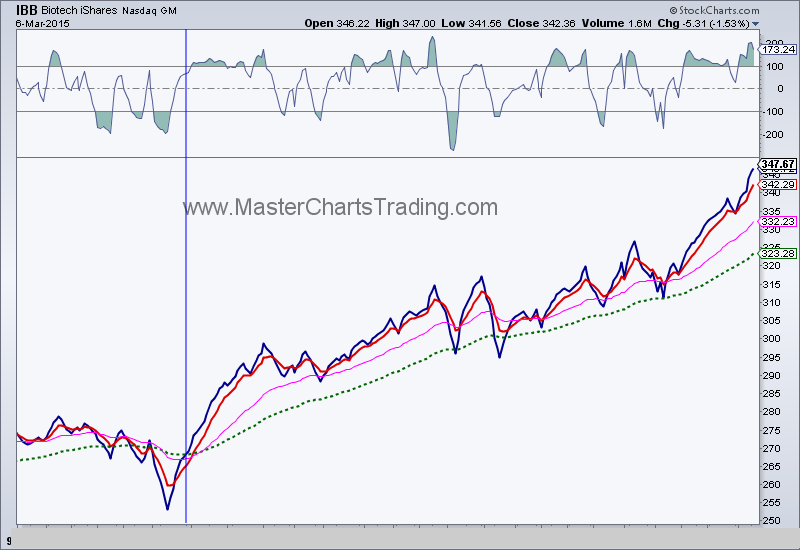
To highlight a sector, which was on fire for the past few months, I chose the biotech ETF - IBB. From its low in mid October IBB is up over 40%. It is certainly entitled to a rest that I believe we may be getting shortly.
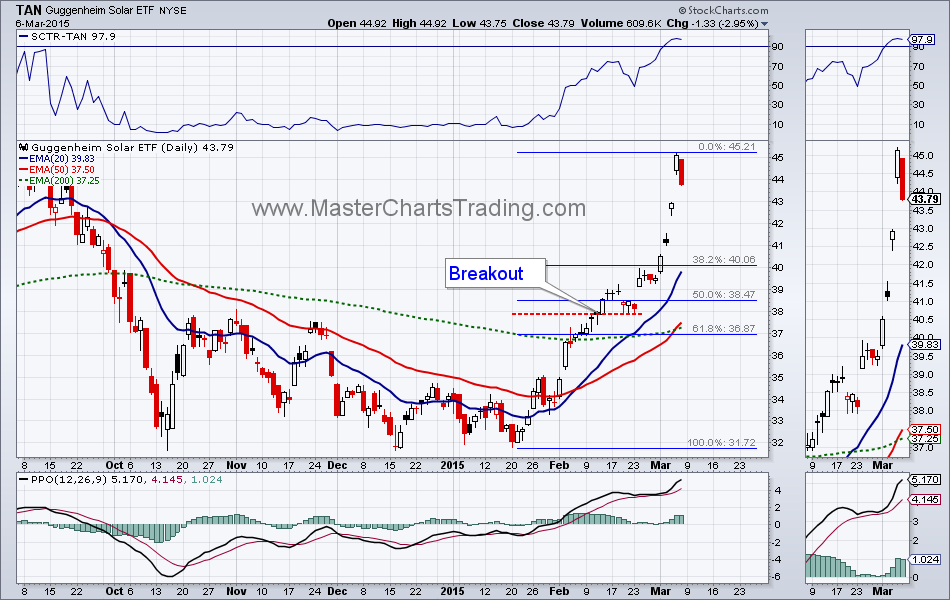
Another industry group that may be poised to become a new market leader is the solar group (TAN). TAN broke out of a long consolidation on February 12 and pretty much never looked back. The important thing is TAN now became long-term bullish and pullbacks would be considered a buying opportunities.
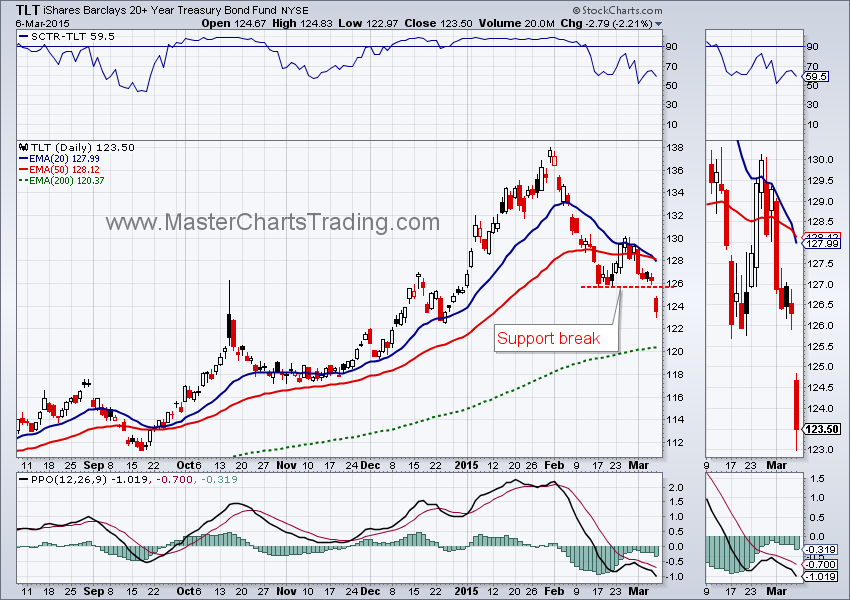
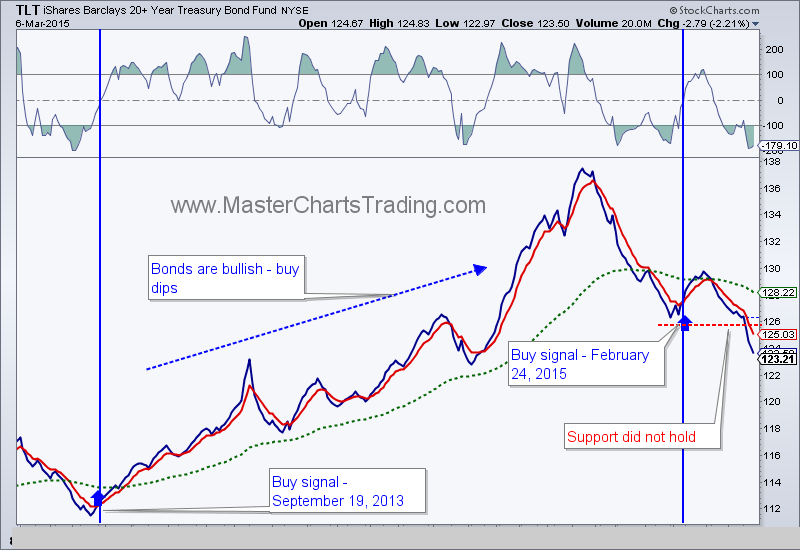
TLT broke down on Friday with a gap and a follow-through. Our buy signal for TLT was on February 24, but bonds looked to be in trouble as early as February 26. Bonds are still bullish in the long-term.
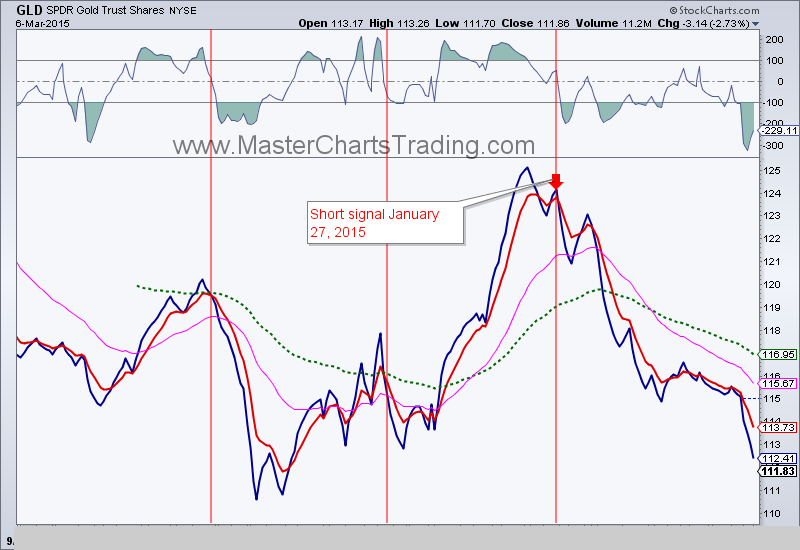
Gold lost 3.75% for the week and decisively broke support from last week. Gold is certainly oversold short-term, but is clearly in a long-term downtrend. We could easily see newlows in gold soon.

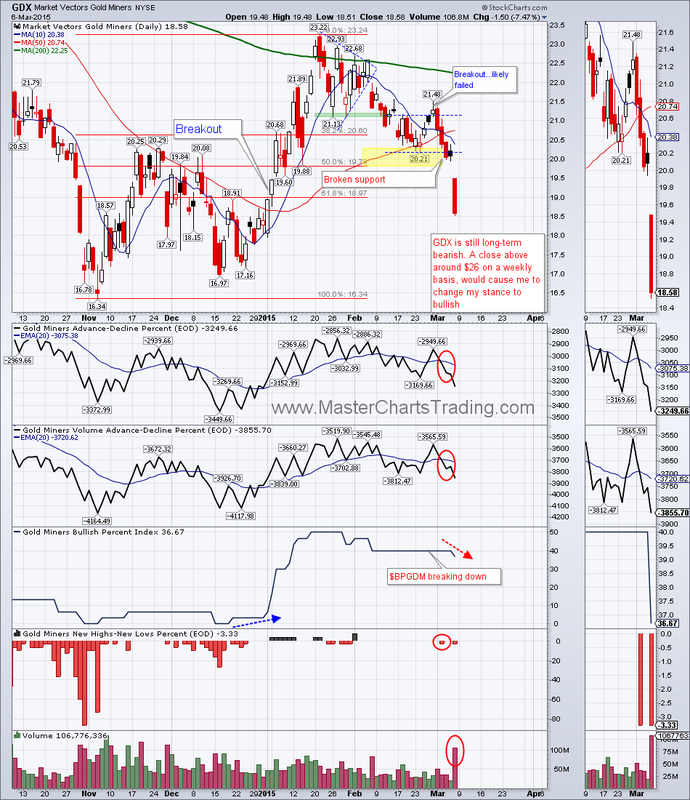
Gold Miners are leveraged to the price of gold, so today’s “mild” price drop in gold translated into a rout in gold miners. GDX collapsed 7.45%! Market breadth for the gold miners ETF is confirming the move lower. Just like gold itself, gold miners are very oversold and ripe for some sort of a counter-trend bounce. But these bounce are likely to be shorted, since both gold and the miners are in a long-term downtrend.
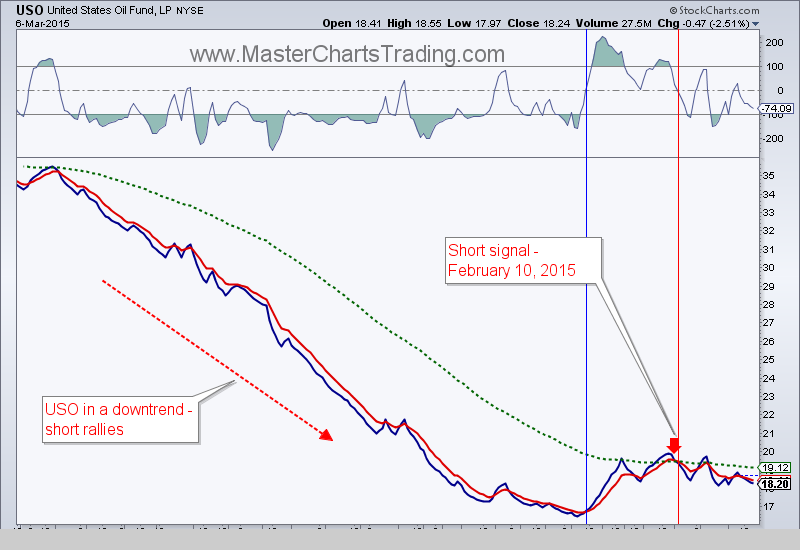
I believe oil is getting ready to retest the lows it set in January. Today again $WTIC closed below the 50 day moving average, a close below $47.80 would open the door to new lows. Alternatively a close above $54 may continue this rebound. We have a position open in SCO (2x inverse oil)

Best Regards and have another great trading week!
Alexander Berger (www.MasterChartsTrading.com)
Disclaimer, we have:
Open positions: SPY (took profits), SCO
New position:
Closed position: TLT
Alexander Berger (www.MasterChartsTrading.com)
Disclaimer, we have:
Open positions: SPY (took profits), SCO
New position:
Closed position: TLT


 RSS Feed