Friday, November 14, 2014. Weekly Market Recap.
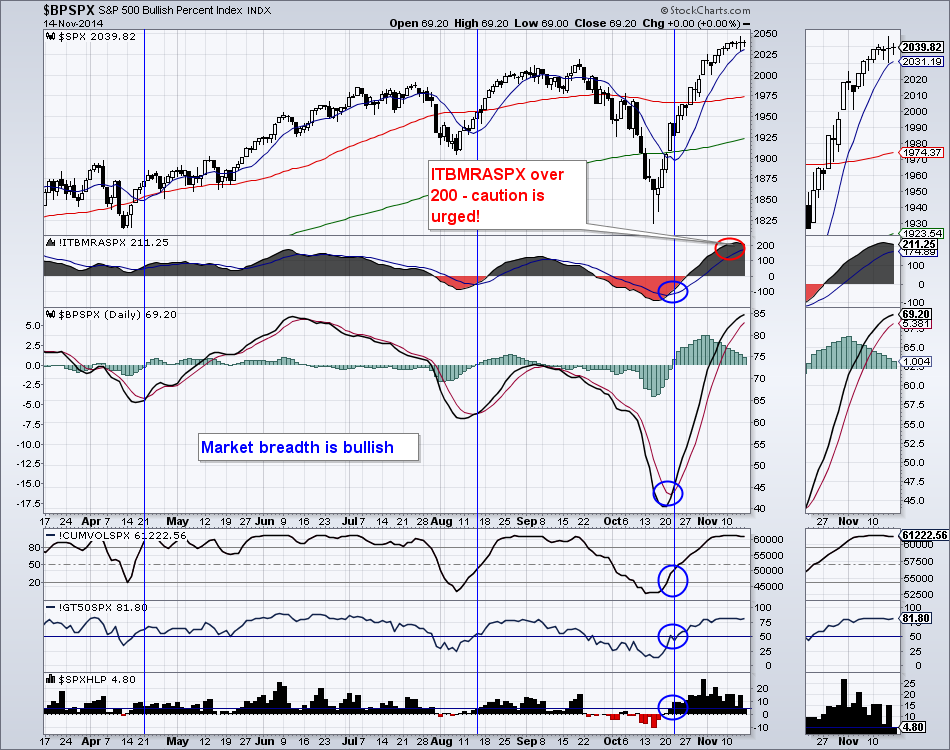
From our entry point on October 21st, we are up a little over 7% in S&P 500. The S&P 500 has been busy eking out new (marginal) all-time highs and this upswing may have overstayed its welcome. S&P 500 is extremely overbought on all indicators that I monitor: MACD, Commodity Channel Index, and the market breadth indicators such as ITBM (Intermediate Term Breadth Momentum Oscillator).
I covered ITBM in my previous video from November 10, when it first recorded a very rare reading of over 200. Looking back, I was only able to find 2 other instances of this high of a level. Both times a market decline followed.
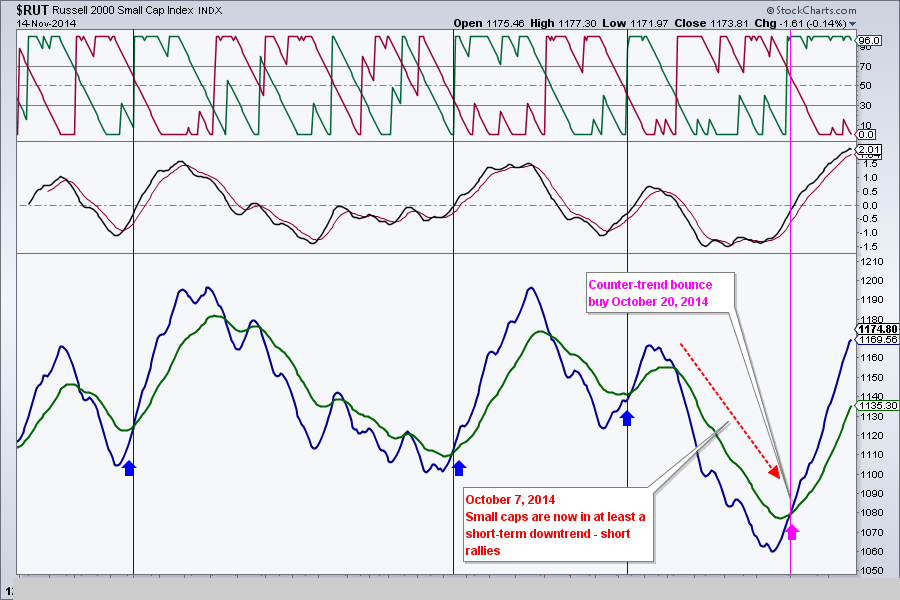
The Russell 2000 index ran into resistance in the 1180 area – corresponding to a prior peak from September 2nd. Should it roll over here, this may be a good place to go short (once indicators flip into bear mode).
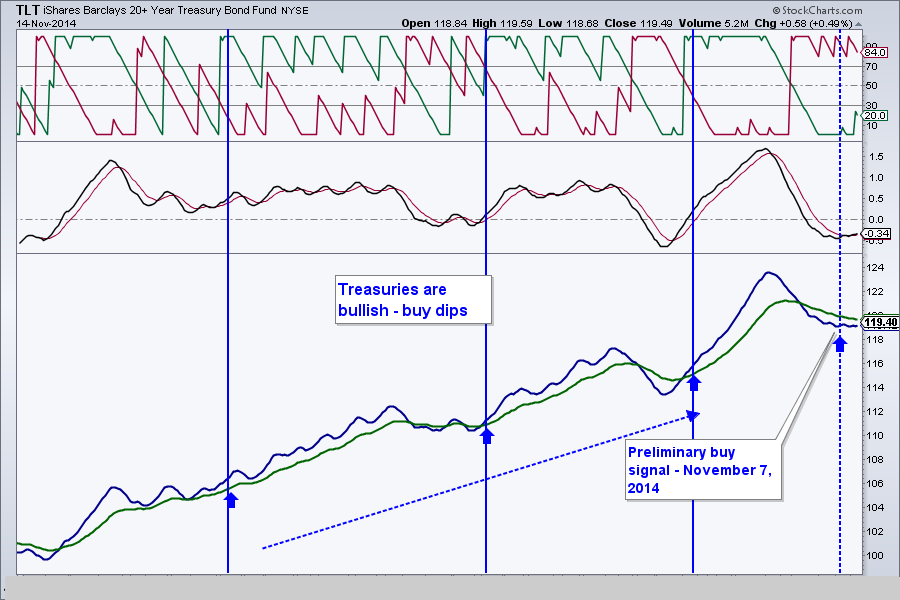
We did open small positions in TLT and AGG last Friday based on several factors. The jury is still out on whether it was a premature decision, as bonds are stuck in a tight trading range. For TLT, a close above 120 or below 118 should provide immediate bias. My money is on the breakout to the upside, at which point I will add to my position. Should I be wrong, I will cut my losses quickly.
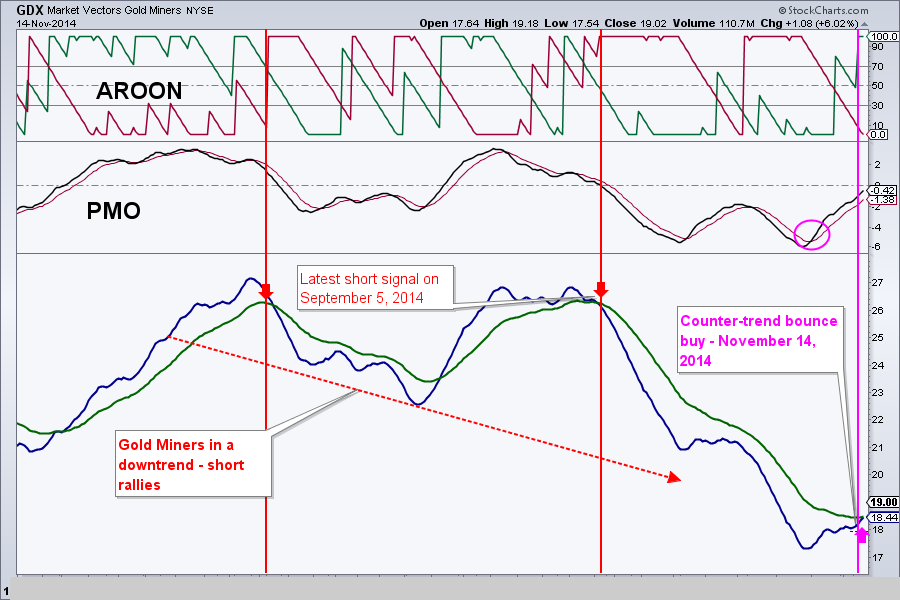
GDX began a trade-able counter trend bounce on Friday. We opened an appropriately-sized position for this trade, keeping in mind that this is a
1. counter-trend bounce
2. GDX is a very volatile security
1. counter-trend bounce
2. GDX is a very volatile security
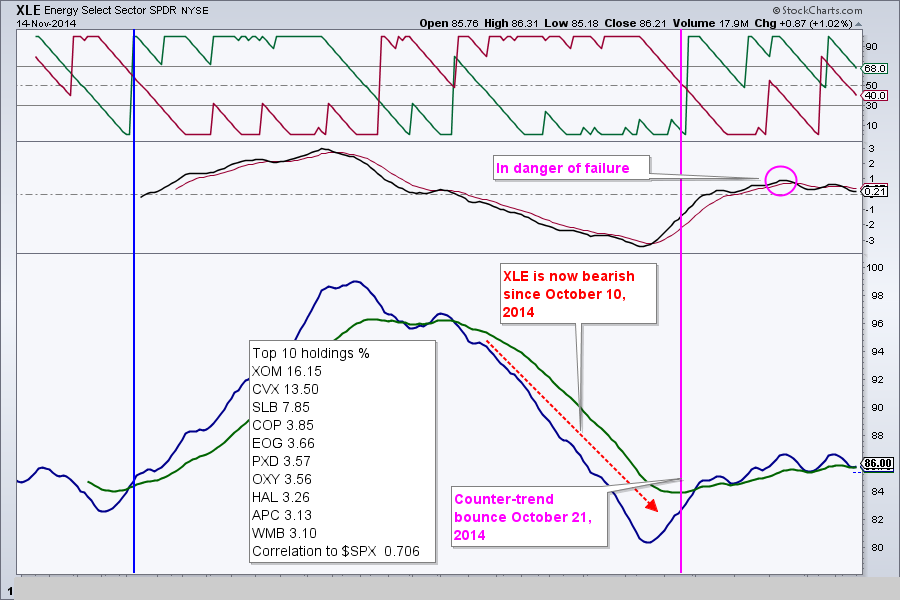
So far, all nine SPDR sector ETFs & real estate have not generated sell signals, but some are already showing either profit taking or signs of exhaustion.
XLF came under some selling pressure/profit taking, while the rebound in XLE was rather weak to begin with - no doubt because of an unending slide in oil prices.
XLF came under some selling pressure/profit taking, while the rebound in XLE was rather weak to begin with - no doubt because of an unending slide in oil prices.
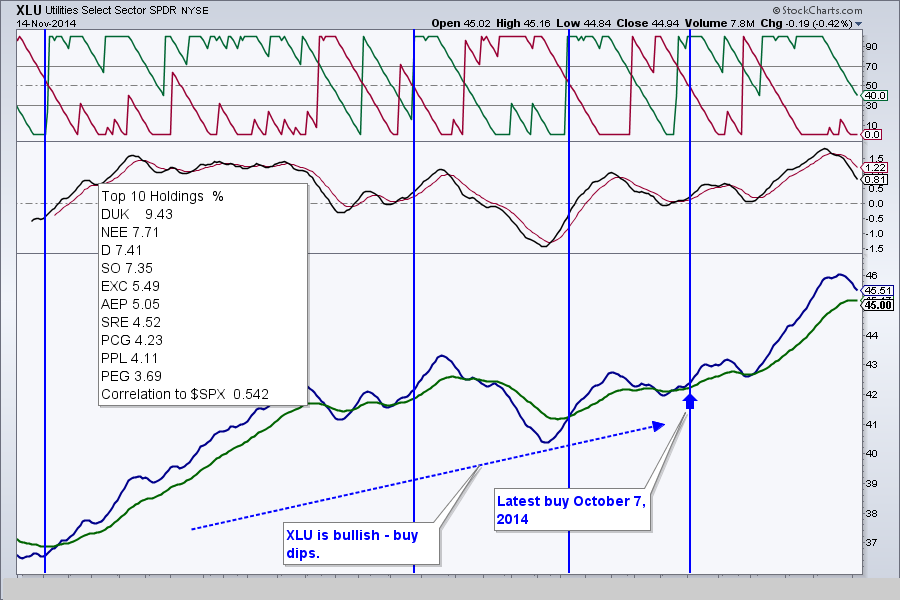
Finally XLU may be nearing its upswing’s end as it sold-off as much as 3.5% from its peak on November 5.
In one of my upcoming videos, I will be going over risk controls that will help you determine how to properly size your positions.
That’s it for this week. Thank you for reading and listening and have another great trading week!
Best Regards,
Alexander Berger (www.MasterChartsTrading.com)
That’s it for this week. Thank you for reading and listening and have another great trading week!
Best Regards,
Alexander Berger (www.MasterChartsTrading.com)


 RSS Feed