Support/resistance Indicators used in this article are available for TradigView.com.
1. I hope the indicators will help you visualize The Bull Market vs. The Bear Market in the instrument you are trading. This understanding, or visualization, sets our trading bias. During the bull market of the the instrument you are trading, we are only buying. In the bear market we are only shorting (selling).
2. Notice I keep saying "instrument". An instrument, or a vehicle of trading, could be anything that is traded on an exchange, such as: ETFs, futures, forex currency pairs, commodity link ETNs, CFDs, stocks, bonds, etc.
3. Generally speaking, for stocks and stock ETFs (not ETNs, or leveraged funds), I give more leeway towards the bullish side.
Stocks over time go up. Other instruments fluctuate.
4. I would not use my indicators to analyze ETNs, or leveraged funds. Always go to the underlying. For example, if you trade gold at a retail level by purchasing and selling the retail ETF called GDX, then do not analyze NUGT.
This is a common beginner mistake. I myself did it when I started out, because I was trying to analyze UNG instead of looking at the futures price of natural gas. This happens because UNG looses value over time if nothing happens. Its kind of like theta decay in options.
5. Once you have your bias, you reject 1/2 of all possible transactions. For example: during the bull market, we only buy. This simplifies things.
After the bias is set, we look for entry opportunities that would give us the most advantages, and the least amount of risk. The lower the risk, the bigger a position we can open. Less risk also equates with less gray hairs! :)
6. With proper position sizing, over time, slowly, we build our trading account. This could take months, or years. We simply must be patient. When I started, my trading account was $2K. Over time, I built it up.
The bigger your trading account, the more shares you can buy on your next transaction, and this could potentially mean more profits, if we follow our system and control our risks.
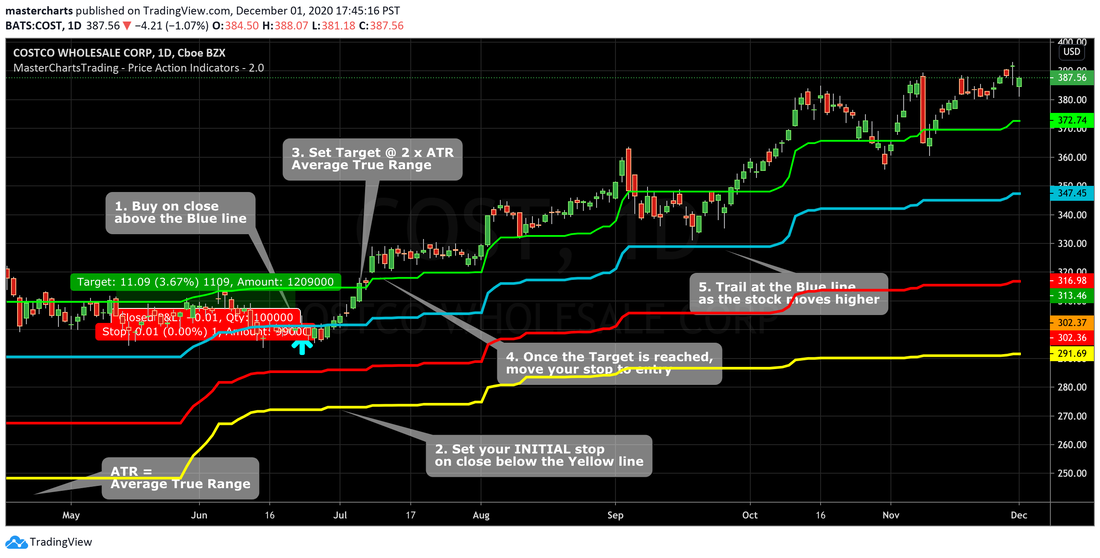
During the bull market we only buy (go long) the instrument we are trading
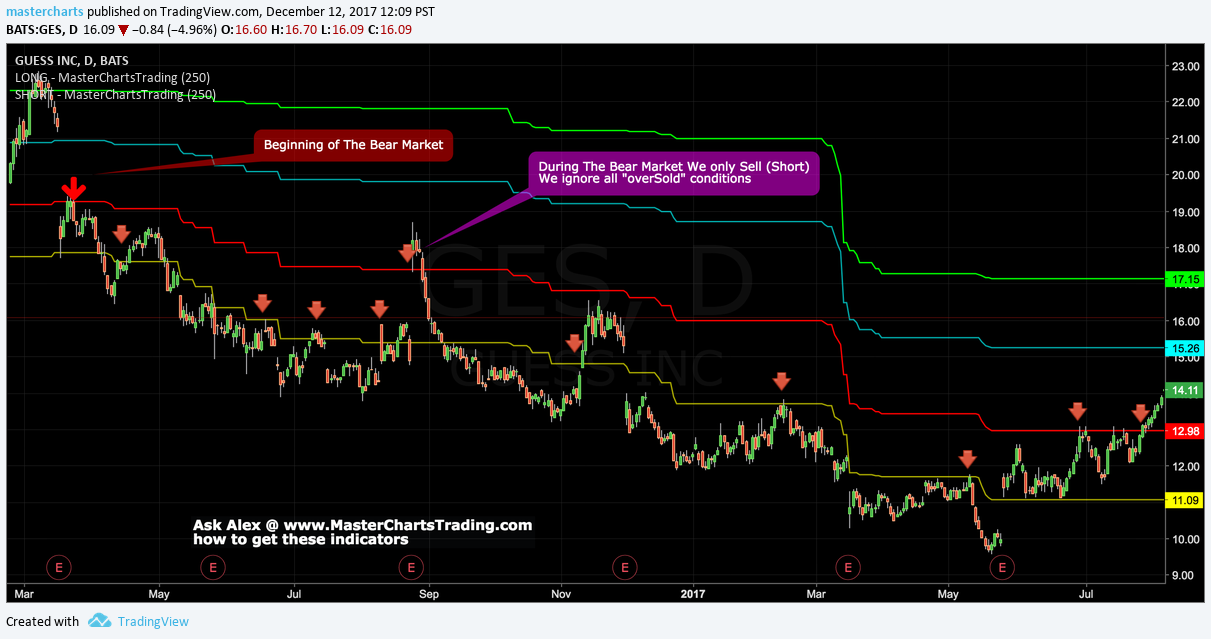
During The bear market, we only sell (short) the instrument we are trading


 RSS Feed